Sovereign Wealth and Risk Management
A New Framework for Optimal Asset Allocation of Sovereign
Wealth
Z. Bodie
1Boston University
M. Brière
2Amundi, Paris Dauphine University, Université Libre de Bruxelles
First version: February 2011 This version: April 2013
Keywords: Asset-Liability Management, Balance Sheet, Contingent Claim Analysis, Sovereign Wealth Funds, Central Bank Reserves.
JEL codes: G11, G18, H11, H50, H63
1
Boston University School of Management, 595 Commonwealth Avenue, Boston, MA 02215, USA. Email: [email protected]
2
Amundi, 90 Bd Pasteur, 75015 Paris, France.
Paris Dauphine University, Place du Maréchal de Lattre de Tassigny, 75016 Paris. Université Libre de Bruxelles, Solvay Brussels School of Economics and Management Centre Emile Bernheim, Av. F.D. Roosevelt, 50, CP 145/1, 1050 Brussels, Belgium. Email: [email protected]
Sovereign Wealth and Risk Management
A New Conceptual Framework for Optimal Asset Allocation of
Sovereign Wealth
Abstract
This paper sets out a new analytical framework for optimal asset allocation of sovereign wealth, based on the theory of contingent claim analysis (CCA) applied to the sovereign’s economic balance sheet. A country solves an asset-liability management (ALM) problem between its sources of income and its expenditures. We derive analytically the optimal asset allocation of sovereign wealth, taking explicit account of all sources of risks affecting the sovereign’s balance sheet. The optimal composition of sovereign wealth should involve a performance-seeking portfolio and three hedging demand terms for the variability of the fiscal surplus, and external and domestic debt. Our results provide guidance for sovereign wealth management, particularly with respect to sovereign wealth funds and foreign exchange reserves. A real-life application of our model in the case of Chile shows that at least 60% of the Chilean asset allocation should be dedicated to emerging bonds, developed and emerging equities. Chile’s current sovereign investment is under-diversified.
1. Introduction
The subprime mortgage crisis and its economic impact prompted governments to significantly expand both their balance sheets and their risk exposure. The issue of how countries manage their resources and wealth has recently come under the spotlight. Increasingly, public institutions other than budgetary government are engaging in large-scale financial transactions. Over the past twenty years, sovereign wealth funds (SWFs) have been set up to manage tax revenues from natural resources (Norway, Chile, Middle East, etc.) and exports (China, Singapore, etc.), and to transform them into a lasting source of national income. Since the subprime crisis, central banks have considerably expanded both their role and their balance sheets. Lastly, public pension funds have also been created in many countries, often as a result of an excess of contributions over benefits during a demographic transition. The fact that some developed countries suddenly found themselves on the brink of default led to growing awareness of the importance of sovereign risks and created the need for satisfactory monitoring tools.
The sovereign wealth management literature typically views each SWF as an independent entity, with central bank reserves and SWFs being considered separately. On one hand, Scherer (2009a, 2009b), Brown et al. (2010), Martellini and Milhau (2010) have addressed the optimal allocation for an SWF by examining a “shadow” oil asset or exogenous liabilities of the fund, proxied by an inflation-linked benchmark. On the other, Bernardell et al. (2004) and Beck and Rahbari (2008) determine the optimal allocation of central banks’ foreign exchange reserves with the dual objective of avoiding domestic
currency appreciation and building up a cushion against a liquidity crisis. But segregating the various items on government balance sheet according to the institutions that manage them is a delusion. This is because, when serious problems arise, all sovereign liabilities are taken into account, including debt and contingent liabilities (e.g. guarantees to the private sector), and all assets become fungible. The example of the recent crisis clearly shows that when a government is short of liquidity to meet its debt repayments, the SWF’s or the state pension fund’s assets are automatically available to substitute for the funds initially earmarked for this purpose. In 2010, Russia, Ireland, Kazakhstan and Qatar used SWFs or public pension fund assets to invest in banks or shore up equity markets.
In this paper we revisit the issue of sovereign wealth management, considering all sources of sovereign wealth and expenditures, including all public institutions, such as budgetary government, the central bank, SWFs, pension funds and any other public entities under the sovereign's authority. In essence, managing a sovereign seems little different to managing an individual’s assets. Each is endowed with capital (human, financial and/or natural resource-related) and has to meet expenditure needs that vary over time and are linked to economic objectives. A sovereign may manage its income and save wisely, using appropriate vehicles so that it can meet its spending requirements (on education, ageing populations, etc.) and cope with the risk of financial crises and the like. It has to manage the mismatch between its revenue sources and its expenditure, thus solving a classic asset-liability management (ALM) problem. Financial tools developed to manage personal wealth (Merton (1969), Bodie et al. (1992), Bodie et al. (2008)), or pension funds (Hoevenaars et al. (2008), Bodie et al. (2009), Bagliano et al. (2009)) are
well suited to this task. But they are only starting to be used to manage sovereign risks. Gray et al. (2007) and Gray and Malone (2008) laid the groundwork in this area by adapting contingent claim analysis (CCA) to sovereign balance sheets with the objective of measuring sovereign credit risk. Financial management of government resources and expenditures raises difficult questions, in which economic policy and financial management objectives are closely entwined.1.
This paper proposes an analytical framework for the optimal management of sovereign wealth, based on the analysis of the sovereign balance sheet. Its contribution is to extend the theory and practice of modern CCA to sovereign wealth and risk management. The sovereign balance sheet is not analyzed solely to evaluate sovereign assets and default risk, as in Gray et al. (2007), but also to measure the risk exposures of the various items composing the sovereign’s assets and liabilities. The optimal sovereign asset allocation is derived analytically in an integrated ALM framework, taking explicit account of the items on the sovereign’s economic balance sheet. The optimal composition of sovereign wealth should involve a performance-seeking portfolio and three hedging demand terms for the variability of the fiscal surplus, and external and domestic debt. These results shed new light on the sovereign’s optimal allocation of its wealth. Our theoretical results have important practical implications for countries where
1 Standard macroeconomic tools are ill-suited to this task. They lack a significant dimension, namely risk
(Gray et al. (2007)). Most of the macroeconomic variables describe flows. When macroeconomic data on stocks (rather than flows) are available, they are low frequency and cannot be used to evaluate the relevant risks correctly. In the case of sovereign balance sheets, risks are linked to market price fluctuations (for commodities, export goods, wage costs, etc.) that cause the government’s income and expenditures to fluctuate, and to inventory changes (natural resource depletion, population growth, etc.). Moreover, in a financial economy, financial risks play a crucial role, with their non-linear features (contingent liabilities modelled as options, etc.), and the accumulation phenomena that lead to systemic risks. Finally, intangible assets and natural capital are never counted.
macroeconomic variables are highly volatile but also for countries experiencing strong shocks on their debt. By taking explicit account of all sovereign assets and liabilities, therefore, our framework reconciles previous, separate findings in the literature on management of central bank reserves (Beck and Rahbari (2008), Caballero and Panageas (2006)) and SWFs (Martellini and Milhau (2010), Scherer (2009a, 2009b)),. Finally, we provide a real data application for Chile. We show that the optimal asset allocation is very different to what is currently implemented by Chile in its SWF and the central bank’s reserve management department. A substantial portion of the asset allocation should be dedicated to emerging bonds (providing relatively good protection for Chile’s liabilities), and to developed and emerging equities.
2. The Conceptual Framework
As far as we know, the question of efficient management of SWFs, which depends on the state’s objective function and structure of the economy, has not been tackled by macroeconomists in a general framework or even a partial equilibrium one. Resolving this problem would raise difficult questions on the optimal path of sovereign reserve accumulation and the generational distribution of the debt burden, along with the issue of fiscal sustainability and monetary policy efficiency (Aschauer (1985), Blanchard et al. (1990), Alfaro and Kanczuk (2009)).
In this article, we consider the concept of “sovereign” in the broad sense, including not just the state’s budgetary institutions and monetary authorities (central
bank), but also the other institutions related to it, such as pension funds, SWFs and state-owned enterprises. The sovereign’s fiscal and monetary policy objectives are considered exogenous. They lead to the issuance of a certain amount of base money, local and foreign debt2 In addition, revenues (tax receipts but also income from other sources such as state-owned enterprises, fees, seigniorage) are generated and expenditures (pensions and financing of social services,3 investing in key sectors or industries, etc.) are made. In some countries where a recurrent surplus is available, this leads to the accumulation of foreign exchange reserves or SWF assets. The government is thus left with pure financial choices for its wealth investments. Accordingly, the sovereign's financial wealth should be considered on a par with its other assets, which are managed to hedge its liabilities.
From a purely financial perspective, this can be seen as an ALM exercise. The sovereign has to maximize its expected utility, which is a function of its surplus, measured as the discounted present value of assets minus liabilities as defined in the sovereign’s economic balance sheet. This supposes that all sovereign assets and liabilities are estimated at market value. Moreover, changes in financial inflows, outflows and market price movements cause the values of the entity’s assets and liabilities to fluctuate. The risks associated with the various items need to be estimated (Gray et al. (2007)).
2 Eaton and Fernandez (1995) put forward the importance of the reputation objective that motivates the debt
repayment. For example Shleifer (2003) stress that Russia decided unilaterally to default in 1998 even if it could have met its financial obligations.
The Sovereign Economic Balance Sheet
The ALM exercise involves estimating the sovereign’s global economic balance sheet. Just as a company’s balance sheet is regularly used to assess the risk of bankruptcy (Merton (1974, 1977), KMV (1999, 2001, 2002)), so the same analytical framework may be applied to a state. We follow Gray et al. (2007), Gray and Malone (2008) to estimate the different components of the balance sheet.
The sovereign’s assets break down as follows:
(1) International reserves: in general, foreign currency reserves held by the central bank, commodities (especially gold) and Special Drawing Rights with the International Monetary Fund. These reserves often have multiple objectives: for example, to maintain currency stability or at least avoid an excessive appreciation caused by export-linked inflows of currencies; and to serve as a reserve asset in the event of a liquidity crisis.
(2) One or more SWFs, managed by the finance ministry or the central bank, also with multiple objectives, which may include savings, macroeconomic stabilization, and even political objectives
(3) Pension fund assets
(4) Other public-sector assets (property, state-owned enterprises, etc.) (5) Fiscal assets: taxes and revenues (fees, etc.) collected as tax receipts
The sovereign’s liabilities include:
(2) Local debt: debt denominated in the local currency of the monetary authorities, and mainly held by domestic agents
(3) Foreign debt: debt denominated in foreign currency (frequently US dollars), mainly held by foreigners
(4) Pension fund liabilities
(5) Contingent liabilities, such as those in the banking sector (notably those of too-big-to-fail institutions)
(6) Present value of expenditures on economic and social development, security, government administration, benefits to other sectors
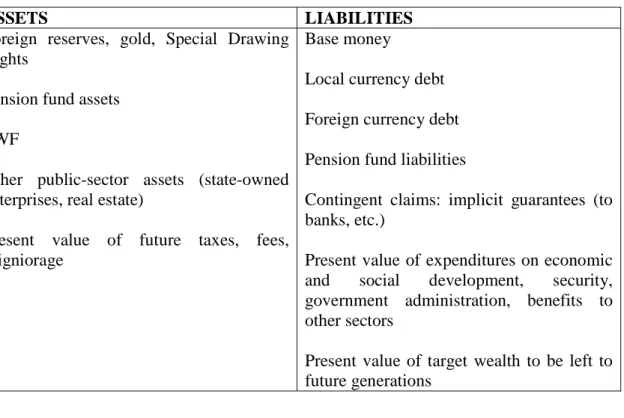
(7) Present value of target wealth to be left to future generations Table 1 gives a simplified example of a sovereign balance sheet
Table 1: Simplified Presentation of a Sovereign Balance Sheet
ASSETS LIABILITIES
Foreign reserves, gold, Special Drawing Rights
Pension fund assets SWF
Other public-sector assets (state-owned enterprises, real estate)
Present value of future taxes, fees, seigniorage
Base money
Local currency debt Foreign currency debt Pension fund liabilities
Contingent claims: implicit guarantees (to banks, etc.)
Present value of expenditures on economic and social development, security, government administration, benefits to other sectors
Present value of target wealth to be left to future generations
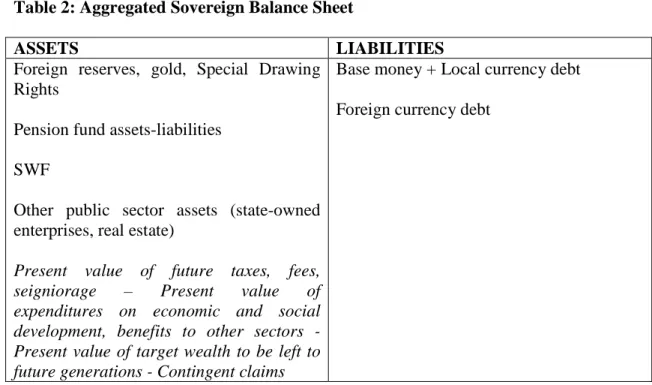
The present value of future income and expense flows can be estimated by discounting all forecasted financial flows, but this would require precise information on the sovereign’s expected budget inflows and outflows linked to economic policy decisions (taxation levels, spending targets, implicit liabilities,4 etc.). An alternative method is to estimate the balance sheet on an integrated basis using market data only (Merton (1974, 1977), Gray et al. (2007)). Table 2 presents this aggregated form. The balance sheet entries have been rearranged in this integrated presentation, subtracting the present value of expenses from the present value of income, and subtracting the value of contingent liabilities from assets.
Table 2: Aggregated Sovereign Balance Sheet
ASSETS LIABILITIES
Foreign reserves, gold, Special Drawing Rights
Pension fund assets-liabilities SWF
Other public sector assets (state-owned enterprises, real estate)
Present value of future taxes, fees,
seigniorage – Present value of
expenditures on economic and social development, benefits to other sectors - Present value of target wealth to be left to future generations - Contingent claims
Base money + Local currency debt Foreign currency debt
4
expected loss of the financial and corporate sector implicitly guaranteed by the government. The importance of contingent liabilities, especially from the banking sector, has been stressed by Arslanalp et al. (2012), Gray and Jobst (2010), Merton et al. (2013).
The total value of sovereign assets at any date t is equal to the market value of the claims on these assets: local currency liabilities and foreign liabilities, all expressed in foreign currency. Following Merton (1974, 1977), the two liabilities can be valued as contingent claims on sovereign assets and can be modeled as options on the total value of the assets. Gray et al. (2007) consider foreign currency debt as a “senior claim” and local currency debt plus base money as a “junior claim”. In practice, this hierarchy will depend on governments’ objectives and priorities in reimbursing their debt,5 but historical evidence has shown that many countries prefer to inflate local currency debt instead of defaulting on foreign currency debt. For simplicity, we consider a basic debt structure with two types of debt of zero-coupon form. In what follows, we omit subscript t at t=0.6
Domestic liabilities expressed in foreign currency DLf is the sum of the monetary base and local debt expressed in foreign currency:
F T r d T r d f X e B e M DL f d + − =( )
where r is the domestic interest rate, d r the foreign interest rate, f B the value of local d debt, M the monetary base in local currency, and d X the forward exchange rate. F
Domestic liabilities can be seen as a call option on the value of sovereign assets
f
A
V , also expressed in foreign currency, with a strike price equal to the default barrierB f
derived from payments promised in foreign currency until time T. The question of
5 A different debt hierarchy could be adopted without difficulty in our framework. 6
More complex capital structures could also be introduced (Geske (1977)) with multiple debt issues differing in maturity, coupon, seniority, etc.
identifying the default point is key. Legal enforcement is irrelevant for sovereigns, contrary to corporates. Thus, the decision to default largely depends on the trade-off between the short-run benefits and the longer-run costs of the consequences of a loss of reputation for repayment (Eaton and Gersovitz (1981), Eaton and Fernandez (1995)). As stressed by Rogoff (2011), empirical benchmarks and historical experience usually provide a better guide than theoretical models for forecasting default probability. For example, some countries are used to serial defaults, others are not. Gray et al. (2007), KMV (1999, 2001, 2002) measure medium-term default risk, and set the “distress barrier” as short-term foreign debt plus one-half of long-term foreign debt. Our objective here is different. We are not attempting to estimate the probability of a sovereign’s defaulting in the medium run but to measure the best way for it to manage its wealth. As a consequence, liabilities must be considered in their entirety. Total short- and long-term foreign debt must be taken into account.
Following Gray et al. (2007), we assume that the value of sovereign assets follows a lognormal diffusion process7 with constant volatility and risk-free rate. Under these assumptions, the value of domestic liabilities can be computed using the Black and Scholes (1973) formula (Merton (1974, 1977)):
) ( ) (d1 B e N d2 N A DLf = f − f −rfT (1)
with N(.) the cumulative standard normal distribution, µA the sovereign asset’s drift and
A
σ its volatility.
7
Departure from this hypothesis would lead to a more complex estimation of the sovereign assets as the Black-Scholes formula for option pricing would no longer apply but would still be feasible (Christoffersen et al. (2010)).
A A A f B A d σ σ µ ) 2 ( ) ln( 2 $ 1 + + = T d d2 = 1−σA
The real-world asset drift is related to the foreign interest rate according to the following relationship:
A f
A r λσ µ = +
Where λis the market price of risk reflecting the risk aversion of the investor (here, the sovereign entity).8
To find the values of the two unknowns V and A σA, we use a second equation, linking the volatility of the sovereign asset to that of the junior claim. Under the Black and Scholes (1973) assumptions,9 the following relationship holds:
) (d1 N A
DLfσLCL = fσA (2)
Thus, equations (1) and (2) can be solved to determine the value of the sovereign’s assets V and their volatility A σA, as a function of the foreign debt default barrier B . f
8 For the empirical investigation, we follow KMV(2002) and fix λ=0.45.
9 Efficient markets, no dividend during the option’s life, option exercised at maturity, no trading costs nor
Portfolio Choice for Sovereign Wealth
Managing sovereign wealth is not very different from managing the wealth of an individual (Merton (1969), Bodie et al. (1992), Bodie et al. (2008)), a pension fund (Bodie et al. (2009)) or a foundation (Merton (1993)). The sovereign receives tax revenues each year. Part of this income can be spent, and the residual can be saved in the SWF, central bank reserves, or public pension fund. How much should be saved and how it should be invested is a classic ALM problem. The optimal allocation and optimal expenditures of the sovereign will crucially depend on the nature and size of its assets and liabilities, and the sources of their uncertainty. A similar problem has been solved analytically in a dynamic case by Merton (1993) for a university endowment fund. The optimal portfolio can be decomposed into speculative demand (the result of the standard mean variance optimal portfolio), and hedging demand components, intended to cover unanticipated changes in assets and liabilities.
In the sovereign case, we consider a static decision process. Applying a dynamic approach would entail defining the macroeconomic dynamics of sovereign balance sheet variables (fiscal surplus, foreign and domestic debt), which would prove very complex and is out of the scope of this paper. We propose to approach the ALM exercise from the perspective of optimizing a surplus (or funding gap), as is traditionally done in the ALM literature for pension funds (van Binsbergen and Brandt (2006), Hoevenaars et al. (2008), Amenc et al. (2010)). The sovereign’s objective is to maximize its expected utility, which is a function of its Global Sovereign Surplus (GSS), measured as the value of assets
minus liabilities (all expressed in foreign currency). In all what follows, we omit subscript t: f f f f A FL DL GSS = − −
With Af,FLfandDLf the sovereign’s assets, foreign and domestic liabilities respectively.
We can further decompose sovereign assets as the sum of financial assets (held by the SWF or central bank) and the “fiscal surplus”:10
f f f f f FA FS FL DL GSS = + − −
With FAfandFSfthe sovereign’s financial assets and fiscal surplus.
Basically, the sovereign will try to maximize the value of the GSS (target wealth to be left to future generations) for a given amount of risk. In practice, it will choose the most appropriate risk measure for its situation (volatility, probability of a shortfall, expected shortfall, etc.). In what follows, we consider volatility.
The return of the GSS can be written as:
DL FL FS FA GSS wr r r r r =α +(1−α) −β −(1−β)
Where r is the annualized vector of returns of the n financial assets in portfolio over FA the investment horizon,
) ,..., ,
(w1 w2 wn
w= the fraction of capital invested in the asset i,
10
In our simplified framework, this comprises the present value of future taxes, fees, seigniorage - (the present value of expenses on economic and social development, benefits to other sectors + the contingent claims)
FS
r , r and FL r the fiscal surplus, foreign debt and domestic debt returns respectively, DL
αthe fraction of total sovereign assets dedicated to financial wealth (the remainder is the fiscal surplus),
β the fraction of total sovereign liabilities dedicated to foreign debt (the remainder is domestic debt). We assume that asset returns, fiscal surplus, foreign and domestic debt have lognormal distributions.
We define their annualized expected returns and second-order moments as: FA FA r E( )=µ ,E(rFS)=µFS, E(rFL)=µFL, E(rDL)=µDL FA FA t FA r r E( )=Ω , E(rFStrFS)=ΩFS, E(rFLtrFL)=ΩFL, E(rDLtrDL)=ΩDL FS FA FS t FA r r E( )=Ω , , E(rFAtrFL)=ΩFA,FL, E(rFAtrDL)=ΩFA,DL, FL FS FL FSr r E( )=Ω , , E(rFSrDL)=ΩFS,DL, E(rFLrDL)=ΩFL,DL
The expected return and variance of the GSS can be written as: DL FL FS FA GSS αwµ α µ βµ β µ µ = +(1− ) − −(1− ) DL FL DL FS FL FS DL FA FL FA FS FA DL FL FS t FA GSS w w w w w , , , , , , 2 2 2 2 2 ) 1 ( 2 ) 1 )( 1 ( 2 ) 1 ( 2 ) 1 ( 2 2 ) 1 ( 2 ) 1 ( ) 1 ( Ω − + Ω − − − Ω − − Ω − − Ω − Ω − + Ω − + Ω + Ω − + Ω = β β β α β α β α αβ α α β β α α σ
Like van Binsbergen and Brandt (2006), Hoevenaars et al. (2008), we assume Constant Relative Risk Aversion (CRRA) preferences on the GSS:
ρ ρ − − = 1 1 1 ) (GSS GSS
The sovereign chooses the weights assigned to the financial assets. Its optimization problem is: − + 2 ) 1 ( 2 1 GSS GSS w Max µ ρ σ (3)
Differentiating (1) with respect to w, we obtain the first-order condition:
[
2 2 (1 ) 2 2 (1 )]
0 ) 1 ( 2 1 , , , 2 ,t + − ΩFA+ − ΩFAFS − ΩFAFL − − ΩFADL = FA ρ α w α α αβ α β αµ (4)The solution to this asset allocation problem is:
DL FA FA FL FA FA FS FA FA t FA FA w 1 , , 1 , 1 , 1 (1 ) (1 ) ) 1 ( 1 * Ω − − Ω Ω + Ω Ω + − Ω Ω − = − − − − α β α β α α µ α ρ (5)
The portfolio has four components: a speculative portfolio (wspec) that depends only on expected asset returns and is the solution of the Markowitz (1952) problem, and three hedging portfolios that protect against intertemporal variations in the fiscal surplus (whedge,FS),foreign liabilities (whedge,FL) and domestic liabilities (whedge,DL), respectively:
t FA FA spec w 1 , ) 1 ( 1 µ α ρ− Ω− = FS FA FA FS hedge w , =−(1− )Ω−1Ω , αα FL FA FA FL hedge w , = Ω−1Ω , α β DL FA FA DL hedge w , = (1− )Ω−1Ω , α β
When ρ →∞, speculative demand disappears and the portfolio reduces to the portfolio that minimizes the mismatch risk between assets and liabilities. For α =1, the first hedging demand term disappears. This is the optimal solution for an investor having only financial wealth and no fiscal surplus. For β =1, the third hedging demand term disappears. This is the optimal solution for an investor having only foreign debt. The relative size of the hedging demand terms depends on the relative risk of the fiscal surplus, domestic and foreign debt in the total, but also on the respective size of these elements (α and β) in the total balance sheet.
These results shed new light on the sovereign’s optimal allocation of its wealth. We see that taking explicit account of all sources of risk affecting the balance sheet of the sovereign, namely its fiscal surplus, foreign and domestic liabilities, leads to a very different optimal portfolio. Previous results on SWFs’ asset allocation did not take into account the three sources of risk affecting the sovereign’s balance sheet. Martellini and Milhau (2010) express the SWF’s preference in real terms and observe a hedging demand against realized inflation. Scherer (2009a, 2009b) identifies the optimal asset allocation of a SWF with non-tradable wealth and observe a hedging demand against oil price variations. We show that in a more general framework, three hedging demand terms should be added to the classic speculative portfolio. It is necessary to take into account not only the risks from inflation and fluctuations in natural resources prices (which both influence the variability of the fiscal surplus), but all the risks stemming from the fiscal surplus, and foreign and domestic liabilities. Moreover, fiscal surplus variability is
influenced not just by commodity price and inflation volatility, but also by the sovereign’s policies on natural resource extraction, taxation, and so on.11
Our theoretical results have important practical implications for countries where macroeconomic variables are highly volatile and introduce considerable uncertainty. Countries that are natural resource-rich or those exporting manufacturing goods are particularly exposed to fluctuations in commodity or goods prices affecting their revenues. Moreover, the uncertainty surrounding the level of production or the speed of extraction of natural resources may also add volatility to the sovereign’s revenues. These countries can use their SWF to partly hedge fluctuations in prices and production levels that affect their balance sheet. This stabilizing role is one of the missions of stabilization funds.
In the next section, we assess the quantitative implications of the model by taking the example of a natural-resource exporting country. Chile is a particularly interesting case study. It is natural resource-rich, with revenues strongly dependent on copper. The central bank and finance ministry publish comprehensive information that make it possible to estimate the sovereign balance sheet. The country’s two SWFs and its central bank are extremely transparent, allowing us to compare the optimal portfolio composition of Chile’s wealth in our framework with what is currently implemented in practice.
11 This leads to another important difference with previous literature. In our framework, the variability in
the flow of revenues coming from the sale of natural resources need to be hedged, not the fluctuations of commodity prices themselves (Scherer (2009a, 2009b)). This has important implications as the fiscal surplus may not have a sensitivity of one to natural resource prices (as we will see in our estimation in Chile in section 3).
3. The Case of Chile
Chile has two SWFs. The Economic and Social Stabilization Fund (ESSF), launched in early 2007 has the goal to stabilise fiscal spending. It aims at reducing the budget dependency on global business cycles and the volatility of revenues derived from fluctuations of copper prices and other sources. The Pension Reserve Fund (PRF) was created at the end of 2006 in response to Chile’s new demographic scenario. It serves as a supplementary source for the funding of future pension contingencies. Market values of both funds as well as their detailed benchmark portfolio composition (end 2010) are provided by the Chilean Ministry of Finance.
Chile Central Bank’s reserves are intended to guarantee secure and efficient access to international liquidity and to permit intervention in the foreign exchange market in times of crisis. They are invested in liquid foreign assets under two main portfolios: the Investment Portfolio (84.3% of the total reserves) and the Liquidity Portfolio (10.2%). Reserves also contain 1.2% of other assets (gold, Special Drawing Rights, IMF reserve positions, reciprocal credit agreement). Information on the stock and composition of reserves at end-2010 are provided by the Chilean central bank.
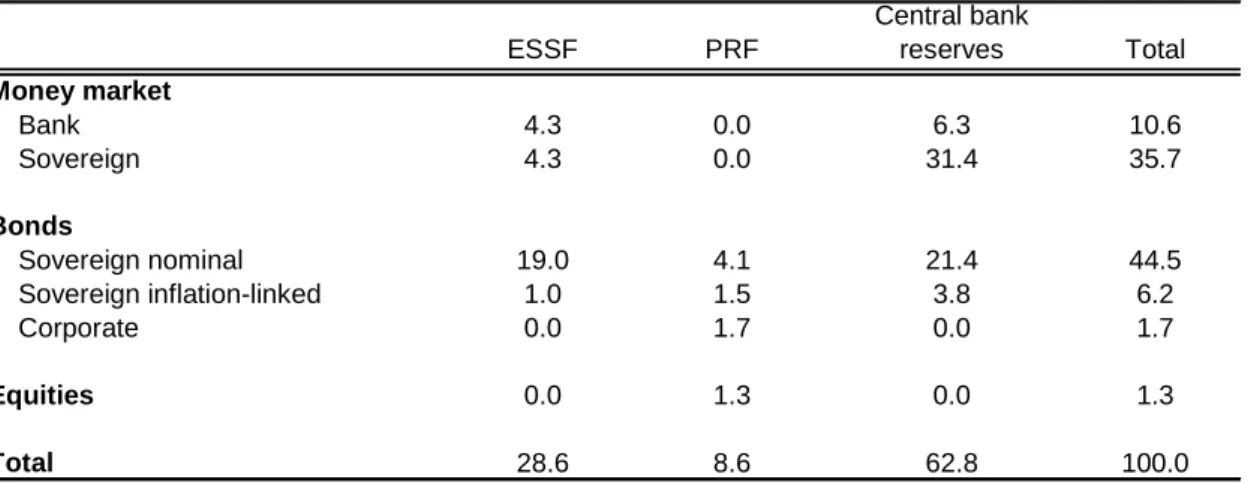
Asset allocation of the two SWFs and the central bank reserves portfolios are provided in Table A1 in Appendix A, currency composition of ESSF12 and central bank reserves in Table A2. Chile is strongly invested in money market instruments (46.3%) and bonds (52.4%). Among them, sovereign nominal bonds account for the largest part, with a small share invested in inflation-linked and corporate bonds. Equities, which have been introduced recently in the PRF, is a very small portion of the total allocation (1.3%). In terms of currency composition, both ESSF and central bank reserves are mainly invested in US dollars and euro, with a slight part of the portfolio diversified in other currencies (Australian dollar, Canadian dollar, British pound and Japanese yen).
For the sovereign wealth allocation exercise, we allow for a broader investment class than the one used by today’s Chilean Government via its currency reserves and SWF and assume that the state can invest in eight diversified asset classes: emerging equities, emerging bonds, developed equities, developed bonds, world inflation-linked bonds, as well as 3 short term bond investments in US Dollars, Euro, Yen. Data used are MSCI emerging equity index, MSCI World index (developed countries), JP Morgan EMBI+ index (external debt), JP Morgan ELMI+ index (local debt), JP Morgan GBI Broad all-maturities index (developed countries government debt all maturities). The three short-term debt indices in US Dollars, Euro and Yen are the Merrill Lynch BOFA Corporate and Government 1-3Y bond index in the US and EMU, Merrill Lynch BOFA 1-3Y Broad Index in Japan. We use monthly data for the period August 2000-December
12 PRF is invested in international indices and details on its currency composition is not provided on the
2010. All data come from Datastream, except the Merrill Lynch indices coming from Bloomberg.
Chile's Central Bank provides data on the stock of domestic and foreign debt13 and on the amount of monetary base in circulation. They represent respectively $14.9 bn, $3.5 bn and $17.5 bn at the end of 2010. To proxy the volatility of domestic liabilities (domestic debt + base money) and foreign liabilities, we take the JPMorgan Chile Local Government bond index (EMBI+)14 and the JPMorgan Chile Local Government bond index (ELMI+) respectively.15
Based on our analytical framework developed in Section 2, we estimate the sovereign default barrier, the stock of domestic (junior) debt and the sovereign entity’s total assets and their volatility. As previously discussed, the distress barrier for foreign currency denominated debt is taken as the whole stock of foreign debt. Resolving the system of equations (1) and (2) enables us to evaluate total sovereign assets in US dollars, as well as their volatility.16 We use a long time horizon for this analysis, with T= 50 years.17 Table A3 in Appendix A presents a simplified estimated economic balance sheet for the sovereign entity. The various assets and liabilities are shown, along with their
13
Issued by the central government and the central bank of Chile.
14 This simplifying hypothesis overstates the volatility of domestic liabilities as base money may have a
lower duration and thus lower volatility than local currency debt.
15 An implied volatility would have been more relevant, but futures markets are not available for
government bonds in Chile.
16
We use a Newton Raphson iteration technique, with 1% tolerance interval.
17 In theory, the sovereign horizon should be perpetuity. In practice, the government may have low
volatilities.18 The estimated balance of total assets is $64.5 bn, with a volatility of 11.4%. Subtracting financial wealth (SWFs and central bank reserves) from total assets, the present value of the fiscal surplus is estimated at $20.1 bn.
To estimate the fiscal surplus volatility, we proxy the surplus by the discounted sum of all the sovereign’s revenue flows less the discounted sum of all its expenditures. As discussed in the previous section, we assume19 that contingent liabilities are negligeable. + − + =
∑
∑
∞ = ∞ =1 (1 ) i 1(1 ) i i i i i lus fiscalsurp r E r R PWhere R and i E are the revenues and expenditures expected for year i, r is the discount i
rate, respectively.20
We further assume that receipts are indexed to Chilean inflation, copper prices and equities and that spending is indexed to inflation.21 This is a reasonable hypothesis as the inflation sensitivity to the annual expenditure growth rate is close to 1 over the period 1991-2009 (see Figure B1 and Table B3 in Appendix B).22 According to Ffrench-Davis
18 The SWFs’ volatilities are taken from the “Annual Report Sovereign Wealth Funds”, Ministry of Finance
2011. They have been estimated for both funds since their inception. A similar information is not available for the Central Bank Foreign Exchange reserves. The volatility of reserves is thus estimated as the volatility of the investment and liquidity portfolio over the period May 2008-December 2010, with the proportions invested remaining constant over the history (taken at end 2010).
19 This assumption seems quite realistic in the aftermath of the Subprime crisis, as there has been no
systemic banking crisis in Chile (Cowan and Marfan (2010))
20 The choice of the socially optimal discount rate might also be an economic policy choice (Gollier
(2002)).
21 In fact, the fiscal surplus is also affected by the government’s political decisions, e.g. choice of future
expenditures, and tax policy. It ought to depend on intangible assets such as human capital, and take account of the fact that natural resources are finite. Most of these data are not publicly available. We have taken a simplified case by way of illustration.
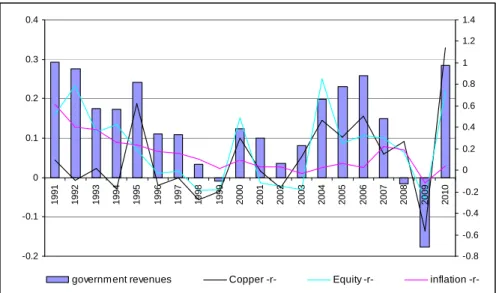
(2010), copper accounts for around 15% of fiscal income, including both taxes and all profits from CODELCO, the state-owned copper company, and taxation of private mining companies. We estimate the sensitivities of the expenditure growth rate to copper, Chile’s equity index and inflation over the period 1991-2009 to be respectively 1.05, 0.15 and 0.10.23 (see Figure B2 and Table B3 in Appendix B). We confirm Ffrench-Davis estimation.
The present value of government expenses is proxied by the price of an inflation-linked bond, of which real coupon is equal to the expenditures (in real terms) that the government expects to make in the future. As for inflation-linked bonds, the nominal coupon paid by the government at a future date i is:
) 1 ( i i i RR E = +π
With RR the real coupon, andi πithe annual inflation rate until year i.
24
In the same vein, the present value of fiscal revenues is estimated as a bond, whose real coupon is indexed on inflation, copper and equities. The “nominal coupon” received by the government at year i can thus be written as:
) * *
* 1
( inflation i copper icopper equity iequity i
i RR r r
R = +β π +β +β
23 The 3 factors explain more than 73% of the total volatility of government revenues. 24
The usual inflation indexation mechanism of inflation-indexed bonds uses lagged inflation instead of current inflation. Because our purpose is to approximate the present value of inflation-indexed expenses, we consider no delay in indexation.
With RR the real coupon, i πithe annual inflation rate until year i, copper i
r and riequity the copper and equity returns over year i, βinflation,βcopperand βequity the sensitivities to copper and equity prices respectively (assumed constant over time).
We consider a 50-year bond. This maturity is coherent with the assumed sovereign horizon in the balance sheet estimation.25 Considering the market quotes of real interest rates (quoted on Chile Inflation Adjusted Notes 20 years maturity, data available since 1994 on Datastream), inflation and copper prices, we estimate the monthly evolution of the present value of the fiscal surplus.
Table B4 in Appendix B presents descriptive statistics for each balance sheet variable, as well as the asset classes taken into consideration for the sovereign allocation. Table B5 presents their correlations. Among the possible investments, emerging equities present the most attractive returns (15.41%) over the study period, but also the highest risk (25% volatility, with high extreme risks), followed by emerging bonds (10.33% return, 10.39% volatility). Unsurprisingly, USD short-term bonds are the least risky investment (1.65% volatility) as the balance sheet is expressed here in USD, but they also offer relatively low returns (4.40%) over the period compared to EUR and JPY short-term bonds (8.69% and 3.76% respectively). Estimated liabilities have an annualized return of 8.08% for external debt and 6.60% for internal debt, with a volatility of 6.64% and 11.89% respectively. The correlation matrix (Table B5 in Appendix B) offers an interesting picture. Euro short-term bonds and developed equities offer slightly negative
25 The government may have in practice low visibility on its expenditures and revenues in the distant future.
correlations with the fiscal surplus (-9% and -7% respectively). Chile local and external debt have a positive correlation with all markets. External debt has the highest correlation with world inflation-linked bonds (65%), whereas local debt presents the highest correlation with emerging government bonds (57%).
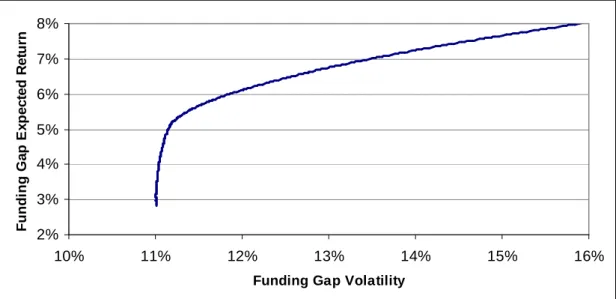
We determine the sovereign’s optimal asset allocation (i.e. allocation of its currency reserves and SWF) that (1) minimizes the volatility of the GSS, (2) minimizes the volatility of the GSS for a 5% target rate of return, (3) for a 8.1% target rate of return. This is the maximum return achievable without shorting26 certain asset classes. Chart B6 in Appendix B shows the efficient frontier obtained. Table C7 presents the results of three optimal allocations. To achieve the lowest risk, a substantial weight has to be given to equities, more than 34% of the allocation. Among them, 28% should be dedicated to developed markets, 6% to emerging markets. 37% needs to be invested in short-term bonds, especially in EUR (negatively correlated with the fiscal surplus and offering attractive returns over the period), while 27% is allocated to emerging bonds, which are closely linked to Chile’s local and external debt and therefore provide relatively good protection for the liabilities. Only 2% should be allocated to inflation-linked bonds. This allows to achieve a 2.83% return of the GSS. When the required return on the surplus is increased to 5%, the proportion allocated to emerging bonds and equities also increases (to 42% and 24% respectively) whereas the portion allocated to developed equities declines (0%). A significant proportion is still allocated to EUR-denominated short-term bonds (31%). Lastly, the maximum return on the surplus is reached with a portfolio allocated 100% in emerging equities. Note that the volatility of the GSS rises from
11.01% to 16.07% due to changes in allocation. This is because 69% of sovereign assets can be exposed to investment and we have excluded short sales and transactions on derivatives, which would have made it possible to modify the overall exposure of the sovereign balance sheet more substantially.
These optimal asset allocations are very different from what is currently implemented by Chile in its SWF and the central bank’s reserve management department. Chile invested mostly in developed countries through short term bonds (bank or sovereign instruments) and long term sovereign bonds. Our results show that a substantial portion of the asset allocation should be dedicated to emerging bonds (providing relatively good protection for Chile’s liabilities), and to developed and emerging equities.
4. Conclusion
This paper proposes an analytical framework for sovereign wealth and risk management, extending the theory of CCA. It derives the optimal sovereign asset allocation in an integrated ALM framework, taking explicitly into account the sovereign economic balance sheet items: fiscal surplus, contingent liabilities, external and domestic debt. Our theoretical results show that the optimal composition of sovereign wealth should involve a performance seeking portfolio and 3 demand terms hedging for fiscal surplus, external and domestic debt variability. Our real data application shows that Chile’s optimal asset allocation should be much more diversified than it is currently, with a substantial part of the asset allocation dedicated to emerging bonds (providing relatively good protection for Chile’s liabilities), developed and emerging equities.
A seminal contribution in the field, this work still suffers a couple of limitations. First, we consider a static portfolio choice problem. Introducing a dynamic model for the balance sheet variables (possibly endogeneous as governments have a large influence over their future path) would make it more realistic, but also much more complex. Second, the issue of liabilities having a “default” boundary is also a strong assumption for sovereigns, subject to sovereign immunity. Repudiation, or financial repression (Landon-Lane et Oosterlinck (2006), Reinhart and Sbrancia (2011)) are options for a sovereign unavailable to an individual and to a corporate. Finally, intangible assets such as human and natural capital should be taken into account. The initiative taken by World Bank (2006) to measure these components of national wealth calls for further development.
References
Alfaro, L., Kanczuk, F., 2009. Optimal reserve management and sovereign debt, Journal of International Economics, 77(1), 23-36.
Amenc, N., Martellini, L., Ziemann, V., 2009. Alternative Investments for Institutional Investors, Risk Budgeting Techniques in Asset Management and Asset-Liability Management. Journal of Portfolio Management, 35(4), 94-110.
Arslanalp S., Liao Y., 2012. Contingent Liabilities and Sovereign Risk: Evidence from Banking Sectors, IMF Working Paper, October.
Aschauer, D. (1985), Fiscal Policy and Aggregate Demand, American Economic Review, 75, 117-27.
Bagliano, F. C., Fugazza, C., Nicodano, G. (2009), Pension Funds, Life-Cycle Asset Allocation and Performance Evaluation, Univesita di Torino Working Paper, March. Beck, R., Rahbari, E. (2008), Optimal Reserve Composition in the Presence of Sudden Stops, the Euro and the Dollar as Safe Haven Currencies, European Central Bank Working Paper, No 916, July.
Bernardell, C., Cardon, P., Coche, J., Diebold, F.X., Manganelli, S. (2004), Risk Management for Central Bank Foreign Reserves, European Central Bank Publication, May.
van Binsbergen, J.H., Brandt, M.W. (2007), Optimal Asset Allocation in Asset Liability Management, NBER Working Paper 12970.
Black, F., Scholes, M. (1973), The Pricing of Options and Corporate Liabilities, Journal of Political Economy, 81, 637–654.
Blanchard, O., Chouraqui, J.C., Hagemann R.P., Sartor, N. (1990), The sustainability of Fiscal Policy: New Answers to an Old Question, OECD Economic Studies, 15, 7-36. Bodie, Z., Detemple, J., Rindisbacher, M. (2009), Life-Cycle Finance and the Design of Pension Plans, Annual Review of Financial Economics, 1, 249-286.
Bodie, Z., Merton, R., Samuelson, W.F. (1992), Labor Supply Flexibility and Portfolio Choice in a Life Cycle Model, Journal of Economic Dynamics and Control, 16, 427-449. Bodie, Z., Ruffino, D., Treussard, J. (2008), Contingent Claims Analysis and Life-Cycle Finance, American Economic Review, 98(2), 291-296.
Brown, A., Papaioannou, M., Petrova, I. (2010), Macrofinancial Linkages of the Strategic Asset Allocation of Commodity-Based Sovereign Wealth Funds, IMF Working Paper 10/9, January.
Caballero, R., Panageas, S. (2006), Contingent Reserves Management: An Applied Framework. In External Vulnerability and Preventive Policies, 1(10), edited by Caballero, R., Calderón, C., Céspedes, L.F. and Loayza, N., Central Banking Analysis and Economic Policies Book Series, Central Bank of Chile, 12, 399-420.
Castren, O., Kavonius, I. K. (2009), Balance Sheet Interlinkages and Macro-financial Risk Analysis in the Euro Area, ECB Working Paper, 1124, December.
Cowan, K., Marfan, M. (2010), The Evolution of Credit in Chile, in The Global Crisis and Financial Intermediation in Emerging Market Economies, BIS Paper 54, December. Eaton, J., Fernandez, R. (1995), ʺSovereign Debt,ʺ NBER Working Paper 5131.
Eaton, J., Gersovitz, M. (1981), Debt with Potential Repudiation: Theory and Estimation, Review of Economics Studies, 48, 76–88.
Ffrench-Davis, R. (2010), Latin America: The Structural Fiscal Balance Policy in Chile: a Move Toward Couter-Cyclical Macroeconomics, Journal of Globalization and Development, 1(1), article 14.
Geske, R. (1977), The Valuation of Corporate Liabilities as Compound Options, Journal of Financial and Quantitative Analysis, 12(4), 541-552.
Gollier C. (2002), Discounting an Uncertain Future, Journal of Public Economics, 85, 149-166.
Gray, D.F., Jobst A.A. (2010), “New Directions in Financial Sector and Sovereign Risk Management”, Journal of Investment Management, 8(1), 23-38.
Gray, D.F., Malone, S. (2008), Macrofinancial Risk Analysis, Wiley Finance, UK.
Gray, D.F., Merton, R.C., Bodie Z. (2007), Contingent Claim Approach to Measuring and Managing Sovereign Credit Risk, Journal of Investment Management, 5(4), 1-24. Hoevenaars, R.R., Molenaar, R., Schotman, P., Steenkamp, T. (2008), Strategic Asset Allocation with Liabilities: Beyond Stocks and Bonds, Journal of Economic Dynamic and Control, 32, 2939-2970.
Landon-Lane J., K. Oosterlinck (2006), “Hope Springs Eternal: French Bondholders and the Soviet Repudiation (1915-1919)”, Review of Finance, 10, p. 507-535.
Markowitz, H.M. (1952), Portfolio Selection, Journal of Finance, 7 (1), 77–91.
Martellini, L., Milhau, V. (2010), Asset-Liability Management Decisions for Sovereign Wealth Funds, Edhec-Risk Institute Publication, October.
Merton, R.C. (1969), Lifetime portfolio selection under uncertainty: The continuous-time case, Review of Economics and Statistics, 51, 247-257.
Merton, R.C. (1974), On the Pricing of Corporate Debt: The Risk Structure of Interest Rates, Journal of Finance, 29, 449-470.
Merton, R.C. (1977), An Analytic Derivation of the Cost of Loan Guarantees and Deposit Insurance: an Application of Modern Option Pricing Theory, Journal of Banking and Finance, 1, 3-11.
Merton, R.C. (1993), Optimal Investment Strategies for University Endowment Funds, Studies of Supply and Demand in Higher Education, Clotfelter C.T. and Rothschild M. ed., University of Chicago Press, 211-242.
Merton R.C., Billio M., Getmansky M., Gray D.F., Lo A.W., Pelizzon L., “On a New Approach for Analyzing and Managing Macrofinancial Risks”, Financial Analyst Journal, 69(2), forthcoming, 2013.
Reinhart, C.M., Sbrancia, M.B. (2011), The Liquidation of Government Debt, NBER Working Paper 16893.
Rogoff, K.S. (2011), Sovereign Debt in the Second Great Contraction: Is This Time Different, NBER Reporter 2011-3.
Scherer B. (2009a), A note on Portfolio Choice For Sovereign Wealth Funds, Financial Markets and Portfolio Management, 23(3), 315-327.
Scherer B. (2009b), Portfolio Choice for Oil Based Sovereign Wealth Funds, Journal of Alternative Investments, 13(3), 24-34.
World Bank (2006), Where is the Wealth of Nations? Measuring Capital for the 21st Century, 2006.
Appendix A
Table A1: Asset allocation of the 2 SWFs (ESSF and PRF) and Central Bank reserves portfolios (% of total assets)
Data provided by the Chilean Ministry of Finance and the Central Bank of Chile, 2010.
Table A2: Currency composition of the ESSF and Central Bank reserves portfolios, as a % of total assets
Data provided by the Chilean Ministry of Finance and the Central Bank of Chile, 2010.
Table A3: Estimation of Chile Balance Sheet, 2010
ESSF PRF Central bank reserves Total Money market Bank 4.3 0.0 6.3 10.6 Sovereign 4.3 0.0 31.4 35.7 Bonds Sovereign nominal 19.0 4.1 21.4 44.5 Sovereign inflation-linked 1.0 1.5 3.8 6.2 Corporate 0.0 1.7 0.0 1.7 Equities 0.0 1.3 0.0 1.3 Total 28.6 8.6 62.8 100.0 ASSETS (bn $) LIABILITIES (bn $)
Assets Volatility Liabilities Volatility
Balances of: Balances of:
FOREIGN CURRENCY GVT DEBT 3.5 6.5% STABILIZATION FUND (ESSF) 12.7 6.1% (senior claim)
PENSION RESERVE FUND (PRF) 3.8 6.1%
CURRENCY AND OTHER RESERVES 27.9 7.2%
MONETARY BASE + LOCAL
CURRENCY GVT DEBT 61.0 11.6% (junior claim)
PRESENT VALUE OF FISCAL SURPLUS - GUARANTEES TO BANKS AND NON BANKS
20.1
TOTAL ASSETS 64.5 11.4% TOTAL LIABILITIES 64.5 11.4%
USD EUR AUD CAD GBP JPY
Central bank reserves 50 40 3.5 3.5 3 0
Appendix B
Figure B1: Annual Growth of Government Expenses and Annual Inflation in Chile, 1991-2010
Government Expenditures are provided by the Chilean Ministry of Finance, inflation is measured by the yearly change in headline CPI.
Figure B2: Annual Growth of Government Revenues and Annual Inflation, Copper and Equity returns in Chile, 1991-2010
Government revenues are provided by the Chilean Ministry of Finance, inflation is measured by the yearly change of headline CPI, the equity market is the MSCI Chile (total return including dividends).
0 0.05 0.1 0.15 0.2 0.25 0.3 0.35 1 9 9 1 1 9 9 2 1 9 9 3 1 9 9 4 1 9 9 5 1 9 9 6 1 9 9 7 1 9 9 8 1 9 9 9 2 0 0 0 2 0 0 1 2 0 0 2 2 0 0 3 2 0 0 4 2 0 0 5 2 0 0 6 2 0 0 7 2 0 0 8 2 0 0 9 2 0 1 0
Government Expenses inf lation
-0.2 -0.1 0 0.1 0.2 0.3 0.4 1 9 9 1 1 9 9 2 1 9 9 3 1 9 9 4 1 9 9 5 1 9 9 6 1 9 9 7 1 9 9 8 1 9 9 9 2 0 0 0 2 0 0 1 2 0 0 2 2 0 0 3 2 0 0 4 2 0 0 5 2 0 0 6 2 0 0 7 2 0 0 8 2 0 0 9 2 0 1 0 -0.8 -0.6 -0.4 -0.2 0 0.2 0.4 0.6 0.8 1 1.2 1.4
-r-Table B3: Results of Annual Regression of Expenses and Revenues Growth Rate on Inflation, Copper and Equity Returns, Chile, 1991-2010
***,**, * significant respectively at the 1%, 5% and 10% level.
Table B4 : Descriptive Statistics of Monthly Returns of Assets and Liabilities, Chile Balance Sheet, August 2000-December 2010
Table B5 : Correlation Matrix between Assets and Liabilities, Chile Balance Sheet, August 2000-December 2010
USD EUR JPY Emg Eqty Dvp Eqty Emg Bond Dvp Bond
World IL Bonds Fiscal Surplus External Debt Local Debt USD 100% EUR 41% 100% JPY 33% 30% 100% Emg Eqty -13% 35% -11% 100% Dvp Eqty -19% 39% -7% 89% 100% Emg Bond 22% 38% 6% 61% 57% 100% Dvp Bond 61% 85% 65% 15% 16% 37% 100% World IL Bonds 53% 83% 32% 39% 37% 54% 83% 100% Fiscal Surplus 9% -9% -1% 2% -7% 14% -1% 4% 100% External Debt 57% 49% 7% 18% 13% 54% 57% 65% 8% 100% Local Debt 5% 35% 3% 56% 51% 57% 25% 39% 10% 31% 100% Expenses Revenues c 0.06*** (5.03) 0.03 (1.36) 1.16*** (6.86) 1.05*** (2.68) - 0.15*** (2.86) - 0.10 (1.53) 72.4% 75.2% 70.8% 70.5% SEE 0.035 0.065 copper ββinflation equity β 2 R 2 AdjR
USD EUR JPY
Emg Equity
Dvp
Equity Emg Bond Dvp Bond World IL Bonds Fiscal Surplus External Debt Local Debt Mean 0.37% 0.72% 0.31% 1.28% 0.30% 0.86% 0.62% 0.67% 1.11% 0.67% 0.55% Ann Mean 4.40% 8.69% 3.76% 15.41% 3.63% 10.33% 7.44% 8.07% 13.27% 8.08% 6.60% Median 0.36% 0.58% 0.02% 1.44% 0.94% 1.23% 0.46% 0.88% 1.37% 0.71% 0.59% Maximum 1.72% 10.37% 8.47% 17.85% 11.91% 8.52% 7.33% 7.41% 19.91% 6.39% 7.79% Minimum -0.97% -8.82% -8.14% -27.66% -19.37% -13.79% -4.94% -11.74% -26.41% -7.97% -17.59% Std. Dev. 0.48% 3.23% 2.85% 7.22% 5.01% 3.00% 2.19% 2.48% 7.11% 1.92% 3.43% Volatility 1.65% 11.20% 9.87% 25.00% 17.34% 10.39% 7.60% 8.58% 24.62% 6.64% 11.89% Skewness 0.11 0.07 -0.26 -0.67 -0.71 -1.01 0.01 -0.96 -0.48 -0.59 -1.22 Kurtosis 3.41 3.82 3.40 4.29 4.25 7.32 3.20 7.43 5.28 6.84 8.04
Figure B6: Efficient Frontier, GSS Expected Return and Volatility tradeoff, August 2000-December 2010
Table B7: Optimal portfolios for Chile, August 2000-December 2010
2% 3% 4% 5% 6% 7% 8% 10% 11% 12% 13% 14% 15% 16%
Funding Gap Volatility
F u n d in g G a p E x p e c te d R e tu rn Min Vol GSS return 5% GSS return 8.1% Mean 0.24% 0.42% 0.67% Ann. Mean 2.83% 5.00% 8.07% Median 0.32% 0.41% 0.81% Maximum 9.01% 9.49% 13.32% Minimum -9.07% -8.90% -12.78% Std. Dev. 3.18% 3.22% 4.64% Volatility 11.01% 11.15% 16.07% Skewness -0.05 -0.01 -0.05 Kurtosis 3.41 3.53 3.29 USD 7% 0% 0% EUR 30% 31% 0% JPY 0% 0% 0% Emg Eqty 6% 24% 100% Dvp Eqty 28% 0% 0% Emg Bond 27% 42% 0% Dvp Bond 0% 2% 0% World IL Bonds 2% 0% 0% Weights