HAL Id: pastel-00838906
https://pastel.archives-ouvertes.fr/pastel-00838906
Submitted on 26 Jun 2013HAL is a multi-disciplinary open access archive for the deposit and dissemination of sci-entific research documents, whether they are pub-lished or not. The documents may come from teaching and research institutions in France or abroad, or from public or private research centers.
L’archive ouverte pluridisciplinaire HAL, est destinée au dépôt et à la diffusion de documents scientifiques de niveau recherche, publiés ou non, émanant des établissements d’enseignement et de recherche français ou étrangers, des laboratoires publics ou privés.
aciers à haute performance : Expériences et modélisation
Matthieu Dunand
To cite this version:
Matthieu Dunand. Effets du taux de déformation sur la rupture ductile des aciers à haute performance : Expériences et modélisation. Mécanique des solides [physics.class-ph]. Ecole Polytechnique X, 2013. Français. �pastel-00838906�
Thèse présentée pour obtenir le grade de
D
OCTEUR DE L
’E
COLE
P
OLYTECHNIQUE
Spécialité : Mécanique
Par
M
ATTHIEU
D
UNAND
Effect of strain rate on the ductile fracture of
Advanced High Strength Steel Sheets:
Experiments and modeling
Soutenue le 25 juin 2013, devant le jury composé de :
Alexis RUSINEK LaBPS, ENIM Président
Tore BØRVIK SIMLab, NTNU Rapporteur
Vincent GROLLEAU LIMB, Univ. Bretagne Sud Rapporteur
Patricia VERLEYSEN Universiteit Gent Examinatrice
Han ZHAO LMT, ENS Cachan Examinateur
Gérard GARY LMS, Ecole Polytechnique Encadrant
Résumé
L’industrie automobile emploie massivement les Aciers à Haute Performance (AHP) pour la fabrication des caisses en blanc, en raison de leur rapport résistance/masse élevé. Ils sont utilisés afin d’augmenter la sécurité des occupants en cas de crash, ou de réduire la masse du véhicule grâce à une diminution des sections utiles. En parallèle, le prototypage virtuel est omniprésent dans le processus de conception des nouveaux véhicules. En prenant l’exemple d’une caisse en blanc automobile, la conception de la structure globale et des procédés de mise en forme de ses composants nécessite des modèles prédictifs et fiables décrivant le comportement et la rupture des matériaux utilisés. Des efforts soutenus ont été entrepris ces cinq dernières années pour développer des modèles prédisant la rupture des AHP sous chargement statique. Pourtant les taux de déformations rencontrés lors d’opération de mise en forme sont de l’ordre de 10 s-1, et peuvent atteindre 103 s-1 lors de crashs.
Le but de cette thèse est de développer une méthode fiable permettant d’évaluer l’influence du taux de déformation et de l’état de contrainte sur la rupture ductile d’AHP initialement non-fissurés. Une procédure expérimentale est conçue pour caractériser le comportement et l’initiation de la rupture dans des tôles chargées en traction à grande vitesse de déformation. La précision du dispositif est évaluée grâce à des validations numériques et expérimentales. Par la suite, une série d’expériences est réalisée à petite, moyenne et grande vitesse de déformation sur différents types d’éprouvettes de traction, afin de couvrir un spectre étendu d’états de contraintes. Une analyse détaillée de chaque expérience par la méthode des Éléments Finis permet de déterminer le trajet de chargement et l’état de déformation et de contrainte à la rupture dans chaque éprouvette, tout en prenant en compte les phénomènes de striction. La déformation à la rupture est significativement plus élevée à grande vitesse de déformation qu’à basse vitesse. De plus, les résultats montrent que l’influence du taux de déformation sur la ductilité ne peut pas être découplée de l’état de contrainte.
Le modèle de comportement constitue un élément essentiel de cette approche hybride expérimentale-numérique. Un modèle de plasticité dépendant du taux de
déformation est proposé pour prédire la réponse mécanique des AHP sur toute la plage de déformation, taux de déformation et état de contrainte couverte par le programme expérimental. La précision du modèle est validée par comparaison de mesures expérimentales globales et locales aux prédictions numériques correspondantes. De plus, l’influence de la discrétisation spatiale utilisée dans les simulations par Eléments Finis sur la précision de l’approche hybride expérimentale-numérique est quantifiée. Il est montré qu’un maillage fin d’éléments hexaédriques est nécessaire pour obtenir des prédictions précises jusqu’à la rupture. Ce type de maillage n’est pas compatible avec des applications industrielles à grande échelle pour des raisons évidentes d’efficacité numérique. C’est pourquoi une méthode de remaillage dynamique d’éléments coque vers des éléments solides est présentée et évaluée. Cette méthode permet d’obtenir des prédictions fiables de l’initiation de la rupture dans des tôles sans compromettre dramatiquement l’efficacité numérique obtenue grâce aux éléments coque.
La seconde partie de ce travail s’intéresse aux micro-mécanismes responsables de la rupture ductile du matériau étudié. Une analyse micrographique du matériau soumis à différents niveaux de déformation permet d’identifier l’enchainement des mécanismes d’endommagement. Ces observations suggèrent que le mécanisme critique conduisant à la rupture est la localisation de la déformation plastique dans une bande de cisaillement à l’échelle du grain. Un model numérique reposant sur la déformation d’une cellule élémentaire 3D contenant une cavité est développé pour modéliser ce phénomène. Il est montré que le mécanisme de localisation à l’échelle micro de l’écoulement plastique dans une bande de cisaillement permet d’expliquer la dépendance de la ductilité à l’état de contrainte et au taux de déformation observée à l’échelle macro.
Contents
Résumé ... i
Acknowledgement ... iii
Contents ... v
List of figures ... ix
List of Tables ... xv
1. General introduction ... 1
1.1 Industrial context ... 11.2 Objective and structure of the thesis ... 2
1.3 Material ... 5
2. Preliminaries ... 7
2.1 Characterization of the stress state ... 7
2.1.1 Stress invariants ... 7
2.1.2 Plane stress condition ... 10
2.2 Ductile fracture modeling ... 12
2.3 Rate-independent plasticity of AHSS ... 15
2.4 Split Hopkinson Pressure bar systems ... 18
3. High strain rate tensile experiments ... 21
3.1 Introduction ... 22
3.2 Load inversion device ... 27
3.2.1 Design objective and strategy ... 27
3.2.2 Proposed design ... 29
3.3 Experimental procedure ... 31
3.3.1 Split Hopkinson Pressure Bar (SHPB) system ... 31
3.3.2 Forces and velocities at the specimen boundaries ... 32
3.3.3 Local displacement measurements ... 34
3.3.4 Determination of the stress-strain curve ... 34
3.4 FEA-based validation ... 35
3.4.2 Simulation results ... 37
3.5 Validation experiments ... 41
3.5.1 High strain rate uniaxial tension experiments ... 41
3.5.2 Notched tension experiments ... 48
3.6 Conclusions ... 50
4. Hybrid experimental-numerical characterization of the effect
of strain rate on fracture ... 53
4.1 Introduction ... 54
4.2 Experimental program ... 58
4.2.1 Tensile experiments at low and intermediate strain rate ... 58
4.2.2 Tensile experiments at high strain rate ... 58
4.2.3 Local displacements and strain measurements ... 60
4.3 Experimental results ... 61
4.3.1 Uniaxial tension ... 61
4.3.2 Notched tension ... 63
4.4 Rate- and temperature-dependent plasticity modeling ... 66
4.4.1 Constitutive equations ... 66
4.4.2 Model specialization ... 68
4.4.3 Calibration procedure ... 72
4.5 Numerical analysis and plasticity model validation ... 76
4.5.1 Finite element model ... 76
4.5.2 Comparison of numerical and experimental results ... 79
4.6 Loading histories to fracture ... 80
4.7 Conclusion ... 86
5. Numerical methods for accurate and efficient ductile fracture
predictions ... 87
5.1 Introduction ... 88
5.2 An uncoupled fracture model for Advanced High Strength Steel sheets ... 89
5.2.1 Plasticity model ... 89
5.2.2 Fracture model ... 90
5.3 Influence of Finite Element modeling on ductile fracture predictions ... 91
5.3.1 Methodology ... 93
5.3.2 Results for shell elements ... 94
vii
5.3.4 Comparison shell-solid ... 100
5.3.5 Mixed shell-solid model ... 102
5.4 Dynamic shell-to-solid re-meshing ... 105
5.4.1 Principle ... 105
5.4.2 Simple example ... 107
5.4.3 Application to basic fracture experiments ... 110
5.5 Conclusion ... 118
6. Analysis of the failure micro-mechanisms ... 121
6.1 Introduction ... 122
6.2 Macroscopic analysis: experiments and simulations ... 122
6.2.1 Notched tension experiments ... 123
6.2.2 Tension on a specimen with a central hole ... 126
6.2.3 Punch Experiment ... 129
6.2.4 Dependence of the strain to fracture on stress state ... 129
6.3 Fractographic analysis ... 130
6.3.1 Sample preparation ... 130
6.3.2 Microscopic observations of polished cross-sections ... 131
6.3.3 Fracture surfaces ... 137
6.3.4 Effect of strain rate on damage ... 137
6.4 Mechanical interpretation of the observations ... 137
6.5 Conclusion ... 139
7. Modeling of the failure mechanisms ... 141
7.1 Introduction ... 142
7.2 Micromechanical modeling ... 146
7.2.1 3D unit cell model geometry and boundary conditions ... 147
7.2.2 Macroscopic rate of deformation tensor... 149
7.2.3 Control of the macroscopic stress state ... 150
7.2.4 Stress orientation evolution ... 153
7.2.5 Computation of the onset of localization for a given stress state ... 154
7.3 Simulation results ... 155
7.3.1 Onset of localization ... 155
7.3.2 Effect of anisotropy ... 159
7.3.3 Influence of the biaxial stress ratio on localization ... 162
7.4 Rate-dependent localization analysis ... 166
7.5 Conclusion ... 170
8. Conclusion ... 171
8.1 Summary of the contributions ... 171
8.2 Future research ... 173
8.2.1 High strain rate experiments ... 173
8.2.2 Influence of temperature ... 175
8.2.3 Rate-dependent fracture model ... 176
8.2.4 Rate-dependent localization analysis ... 177
A. Numerical implementation of the rate-dependent plasticity
model ... 179
A.1 Time integration scheme ... 179
A.1.1 Isothermal loading ... 180
A.1.2 Adiabatic loading ... 181
A.1.3 First guess for the Newtown algorithm ... 182
A.1.4 Explicit FEA solver ... 182
A.2 Material Jacobian ... 183
A.2.1 Isothermal loading ... 183
A.2.2 Adiabatic loading ... 185
A.3 Material derivatives ... 186
A.3.1 Yield and flow potentials and ... 187
A.3.2 Strain rate function ... 187
A.3.3 Strain hardening function ... 188
B. Publications & Presentations ... 191
B.1 Refereed journal publications ... 191
B.2 Conference proceedings ... 192
B.3 Presentations ... 193
List of figures
Figure 1-1: Optical micrograph of the undeformed TRIP material. ... 6
Figure 2-1: Characterization of the stress states in terms of stress triaxiality and Lode angle parameter. ... 9
Figure 2-2: Relation between the stress triaxiality , the Lode angle parameter and the stress ratio in case of biaxial stress states. ... 11
Figure 2-3: Uniaxial tensile testing – engineering stress strain ... 17
Figure 2-4: Schematic of a Split Hopkinson Pressure Bar system ... 18
Figure 2-5: Wave-propagation diagram ... 18
Figure 2-6: Example of signals measured in a SHPB experiment ... 19
Figure 3-1: Configurations for tensile testing with SHPB systems. ... 23
Figure 3-2: Schematic of the Load Inverting Device ... 30
Figure 3-3: Drawings of the specimens ... 31
Figure 3-4: Results from a FE simulation of a uniaxial tension experiment ... 38
Figure 3-5: Displacement of two nodes located on the surface of the specimen gage section ... 39
Figure 3-6: FE-based validation of the experimental technique for uniaxial tension .... 40
Figure 3-7: Photograph of the load inversion device ... 41
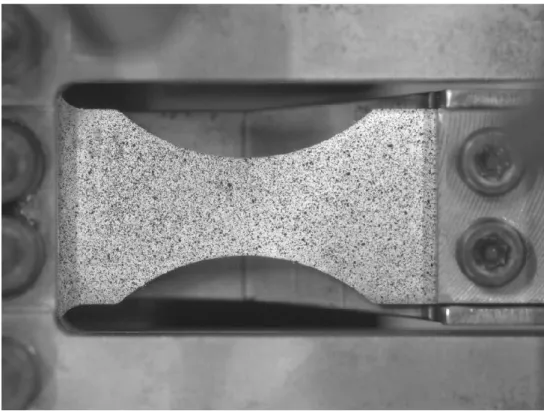
Figure 3-8: Close-up view of a notched specimen positioned in the load inversion device. ... 42
Figure 3-9: Strain histories of (a) the incident and reflected wave measured from the input bar and (b) the transmitted waves measured from both output bars ... 43
Figure 3-10: Approximation of the forces applied at the specimen/pusher interface .... 44
Figure 3-12: Summary of experimental results for different equivalent plastic strain
rates. ... 46
Figure 3-13: True stress-strain curves ... 48
Figure 3-14: Experiments on a notched tensile specimen. ... 49
Figure 4-1: Uniaxial tension specimens ... 59
Figure 4-2: Experimental engineering stress-strain curves under uniaxial tension. ... 62
Figure 4-3: Experimental results of notched tensile specimens with a 20mm radius. ... 64
Figure 4-4: Experimental results of notched tensile specimens with a 6.65mm radius. ... 65
Figure 4-5: Dependence of flow stress to temperature ... 71
Figure 4-6: Experimental (points) and simulation (solid curves) results for the notched tensile specimen with a radius, at (a) low, (b) intermediate and (c) high strain rate. ... 75
Figure 4-7: Experimental (points) and simulation (solid curves) results for uniaxial tension ... 77
Figure 4-8: Experimental (points) and simulation (solid curves) results for the notched tensile specimen with a radius, at (a) low, (b) intermediate and (c) high strain rate. ... 79
Figure 4-9: Numerical prediction of the evolution of equivalent plastic strain rate versus equivalent plastic strain ... 83
Figure 4-10: Loading path in the plane for low strain rate experiments. ... 84
Figure 4-11: Loading paths to fracture at low (black lines), intermediate (red lines) and high strain rate (blue lines). ... 85
Figure 5-1: Meshes of the notched tensile specimen. ... 92
Figure 5-2: View of the very fine mesh with 12 solid elements through the half-thickness ... 93
xi
Figure 5-4: Evolution of damage and equivalent plastic strain at the center of the
notched specimen ... 95
Figure 5-5: Contour plot of equivalent plastic strain after the maximum of force ... 96
Figure 5-6: Evolution of the stress triaxiality and the equivalent plastic strain ... 97
Figure 5-7: Predicted force displacement curves with solid elements. ... 98
Figure 5-8: Evolution of the equivalent plastic strain at the center of the gage section for different mesh densities. ... 98
Figure 5-9: Contour plot of equivalent plastic strain after the onset of localized necking ... 99
Figure 5-10: Predicted displacement at which fracture occurs ... 101
Figure 5-11: Mixed mesh with local refinement of solid elements. ... 103
Figure 5-12: Force displacement curves and fracture predictions using a solid mesh and a mixed mesh. ... 103
Figure 5-13: Evolution of equivalent plastic strain (solid lines) and stress triaxiality (dashed lines) at the center of the gage section ... 104
Figure 5-14: Simulation of a tension test using shell-to-solid re-meshing. ... 106
Figure 5-15: Force displacement curve of a tensile test with re-meshing ... 109
Figure 5-16: Evolution of the model kinetic energy ... 109
Figure 5-17: Flat tensile specimens with different notched radii and with a central hole. ... 111
Figure 5-18: Contour plot of equivalent plastic strain in a notched tensile specimen after re-meshing of the gage section center. ... 112
Figure 5-19: Predicted force displacement curve of the notched tensile test with re-meshing. ... 113
Figure 5-20: Predicted force displacement curve of the notched tensile test with re-meshing. ... 113
Figure 5-21: Predicted force displacement curve of the central hole tensile test with re-meshing. ... 114
Figure 5-22: Evolution of equivalent plastic strain at the center of the notched tensile specimen, predicted using a solid mesh or re-meshing. ... 115 Figure 5-23: Evolution of stress triaxiality at the center of the notched
tensile specimen, predicted using a solid mesh or re-meshing. ... 116 Figure 5-24: Evolution of damage at the center of the notched tensile
specimen, predicted using a solid mesh or re-meshing. ... 116 Figure 6-1: Tensile specimens with (a) a notch radius 6.65mm and (b) tensile
specimen with central hole. ... 123 Figure 6-2: Force displacement curves ... 125 Figure 6-3: Contour plot of the equivalent plastic strain at the instant of the onset of
fracture in a notched specimen. ... 126 Figure 6-4: Loading paths to fracture. ... 127 Figure 6-5: Specimen with a central hole: contour plot of plastic axial strain at the
instant of the onset of fracture. ... 128 Figure 6-6: SEM micrographs from notched tensile experiments interrupted at (a)
the maximum of force, (b) 95% of the displacement to fracture and (c) 99% of the displacement to fracture. ... 133 Figure 6-7: Cross sections of post-mortem specimens of (a) notched tensile
experiment, (b) central hole experiment and (c) punch experiment. ... 135 Figure 6-8: SEM fractographs from a broken notched tensile specimen. ... 136 Figure 7-1: (a) unit cell initial geometry and (b) FEA mesh representing half of the
cell. ... 146 Figure 7-2: Unit cell model in its (a) initial and (b) deformed configuration. ... 151 Figure 7-3: Contour plot of equivalent plastic strain in the plane ... 156 Figure 7-4: Influence of initial stress orientation on the onset of localization for
. ... 159 Figure 7-5: Cavity shape evolution during deformation under uniaxial tension
xiii
Figure 7-6: Dependence of (a) the macroscopic strain and (b) the stress orientation at the onset of localization to the biaxial stress ratio . ... 163 Figure 7-7: Influence of the initial defect volume fraction on (a) macroscopic
stress-strain curves and (b) the evolution of the defect volume fraction for a biaxial stress ratio of . ... 165 Figure 7-8: Evolution of the macroscopic equivalent strain rate in rate dependent
cell calculations. ... 167 Figure 7-9: Influence of strain rate on localization for a biaxial stress ratio of
. ... 168 Figure 8-1: Scatter in high velocity equi-biaxial punch experiments. ... 174 Figure 8-2: Isothermal uniaxial tension experiments at different temperatures. ... 176
List of Tables
Table 1-1: Chemical composition of the TRIP780 material in wt-% ... 5
Table 4-1: Material parameters for the rate-dependent model ... 73
Table 5-1: Material parameters for the TRIP780 steel ... 92
Table 5-2: CPU time (in s) for different mesh types and densities ... 100
Table 5-3: CPU time (in s) for the solid and mixed models ... 105
Table 5-4: CPU time (in s) when using re-meshing ... 118
Chapter 1
General introduction
Contents
1.1 Industrial context ... 1 1.2 Objective and structure of the thesis ... 2 1.3 Material ... 5
1.1 Industrial context
The automotive industry has widely incorporated Advanced High Strength Steels sheets (AHSS) in vehicle structures due to their high strength to weight ratio: they are used to improve the vehicle safety or to reduce the vehicle weight through the use of thinner gages. At the same time, new vehicle design relies heavily on virtual prototyping practices. In the specific example of automotive structures, both the engineering of the production process and of the final product require reliable models of plasticity and fracture. Consequently, great efforts have been undertaken during the last five years to develop models that can predict the fracture of AHSS under static conditions (e.g. Wierzbicki et al., 2010, [190]). However, rates of deformation encountered in sheet metal forming operations are typically of the order of 10s-1, while they can be as high as 103 s-1 under accidental crash loading. Therefore, there is a need to investigate the effect of strain rate on deformation behavior and fracture of AHSS, and to assess whether models developed for static loading conditions can satisfactorily be used in industrial applications.
1.2 Objective and structure of the thesis
This project was carried out in collaboration between the Solid Mechanics Laboratory (CNRS-UMR 7649, Ecole Polytechnique) and the Impact and Crashworthiness Laboratory (Massachusetts Institute of Technology).
The present research work consists of two main parts. The first part aims at developing a reliable methodology for evaluating the influence of strain rate as well as stress state on the ductile fracture properties of initially uncracked Advanced High Strength Steel sheets. An experimental procedure is designed to characterize the deformation behavior and the onset of fracture of sheet materials under tensile loading at high strain rate. Numerical and experimental validations of the proposed setup are performed to evaluate its accuracy. Then an experimental program is carried out at low, intermediate and high strain rates on different type of tensile specimens, thereby covering a range of stress states. Detailed Finite Element analyses of each experiment are used to determine the loading history and the material state at fracture in each experiment. A key component of this hybrid experimental-numerical approach is the constitutive model: a rate-dependent plasticity model is proposed to predict the mechanical response of AHSS over all the range of strains, strain rates and stress states reached in the experiments. The model accuracy is validated by comparing global and local test measurements to the corresponding simulation predictions. In addition, the influence of the geometric discretization used in Finite Element analysis on the accuracy of the hybrid experimental-numerical approach is evaluated. It is shown that fine meshes of brick elements are required for accurate fracture predictions, but cannot be used in industrial applications because of inadequate computational efficiency. A technique of shell-to-solid re-meshing is presented and evaluated, that allows for accurate predictions of the onset of ductile fracture in sheet materials without compromising the numerical efficiency of shell elements.
The second part of this work is concerned with the micro-mechanisms responsible for ductile failure. Micrographs of specimens corresponding to different stages of loading prior to failure are analyzed to identify the sequence of damage processes leading to fracture. Observations suggest that the governing failure mechanism is the localization of plastic deformation into shear bands at the grain level.
1.2. Objective and structure of the thesis 3
A numerical model based on three dimensional unit cell calculations is developed to assess whether the mechanism of shear localization of the plastic flow at the micro-scale can explain the dependence of the material ductility to both stress state and strain rate that was observed at the macro-scale.
The thesis is organized as follow:
In Chapter 2, background information is given on the characterization and modeling of plasticity and ductile fracture of AHSS under static loading conditions. In addition, variables that will be used throughout the manuscript to describe the stress state are precisely defined. Finally, Split Hopkinson Pressure Bar systems, used for characterizing mechanical behavior of materials under compression at high rates of deformation, are presented.
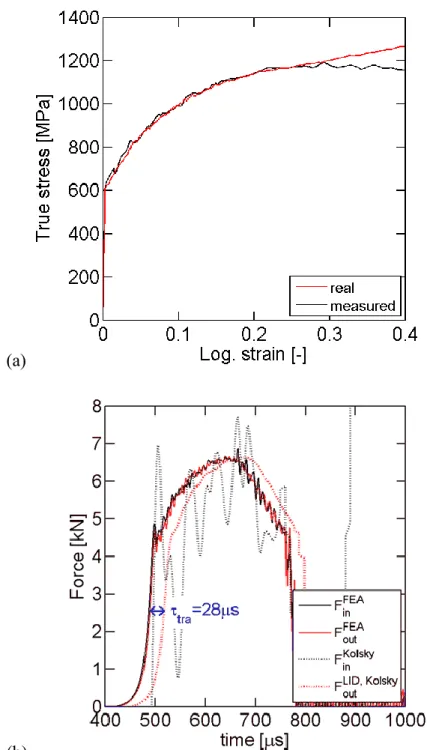
In Chapter 3, a high strain rate tensile testing technique for sheet materials is presented which makes use of a modified split Hopkinson pressure bar system in conjunction with a load inversion device. With compressive loads applied to its boundaries, the load inversion device introduces tension into a sheet specimen. Detailed finite element analysis of the experimental set-up is performed to validate the design of the load inversion device. It is shown that under the assumption of perfect alignment and slip-free attachment of the specimen, the measured stress-strain curve is free from spurious oscillations at a strain rate of 1000s-1. Validation experiments are carried out using tensile specimens, confirming the oscillation-free numerical results in an approximate manner.
In Chapter 4, the effect of strain rate on ductile fracture properties of the TRIP material is characterized using a hybrid experimental-numerical method. Tensile experiments are carried out at low ( ̇ ), intermediate ( ̇ ) and high strain rates ( ̇ ). The experimental program includes notched as well as uniaxial tension specimens. Local displacements and surface strain fields are measured optically in all experiments using Digital Image Correlation. Constitutive equations derived from the Mechanical Threshold Stress theory are proposed to describe the rate-dependent behavior as well as plastic anisotropy of the sheet material. Detailed Finite Element simulations of all experiments reveal that the model accurately predicts experimental
results, including force displacement curves and local surface strain evolution. In particular, the behavior at large strain (beyond the onset of necking) is well predicted. Stress and strain histories where fracture initiates are also obtained from the simulations in order to characterize the dependence of the material ductility to both strain rate and stress state. If the fracture strain is higher at high strain rate in all experiments, results show that the effect of strain rate on ductility cannot be considered independently from the state of stress.
In Chapter 5, the influence of the finite element modeling on predictions of mechanical response and ductile fracture in sheet structures is analysed. The inability of shell elements to accurately predict the post-necking behavior of sheet materials is highligted. On the contrary predictions independent from the mesh characteristics are obtained with solid elements if sufficiently fine meshes are used. However, intensive computation efforts associated with the use of fine meshes of solid elements to model sheet structures such as automotive parts make it unsuitable to an industrial environment. A dynamic shell-to-solid re-meshing technique is considered to benefit from both the numerical efficiency of shells and the accuracy of fine solid meshes. Comparisons between numercial predictions using re-meshing and experimental results show a significant increase of the accuracy of fracture predictions compared to shell simulations, and substantial time savings compared to solid simulations.
In Chapter 6, the evolution of damage and the mechanisms responsible for ductile failure are identified in the TRIP steel sheet submitted to different stress states, using optical and scanning electron microscopy. Experiments are performed on tensile specimens and on disk specimens submitted to out-of-plane hemispherical punching, thereby covering stress states from uniaxial to equi-biaxial tension. For each specimen geometry, experiments have been interrupted prior to fracture at different stages of deformation: onset of through the thickness necking and 95%, 99% of the displacement at which fracture initiates. Micrographs of samples extracted from the deformed specimens permit to evaluate the material damage for increasing amounts of accumulated plastic strain, and identify rupture mechanisms. It is shown that the critical mechanism responsible for material failure is the localization of the plastic deformation in a shear band initiating at a grown and isolated void. The orientation of the fracture surface is controlled by the shear band direction.
1.3. Material 5
In Chapter 7, a numerical model is developped to investigate the influence of the stress state and strain rate on the onset of localization of the plastic flow in a void-containing material. A three-dimensional unit cell void-containing an initially spherical void is submitted to proportional loadings in the macroscopic stress space. Fully periodic boundary conditions are applied. The range of stress states considered are limited to biaxial tension, i.e. from uniaxial to equi-biaxial tension under plane stress conditions. The model is able to predict qualitatively the dependence of ductility to the stress state observed experimentaly, as well as the increase of ductility at high strain rate.
1.3 Material
All the experimental work presented in this manuscript is performed on specimens extracted from 1.4mm thick TRIP780 steel sheets provided by POSCO (Korea). This particular representative of the AHSS family has been chosen as its plastic behavior and ductile fracture properties under static loading conditions have been extensively studied (Mohr et al., 2010, [122]; Dunand and Mohr, 2010, 2011, [48-50]). The chemical composition of the present TRIP780 material as measured by energy-dispersive X-ray analysis is given in Table 1-1. Micrographs (Fig. 1-1) reveal a fine grain structure with a maximum grain size of about and show that martensite and austenite grains (in blue/brown in Fig. 1-1) tend to segregate in bands parallel to the sheet rolling direction.
Table 1-1: Chemical composition of the TRIP780 material in wt-%
C Al Mn Si Mo
TRansformation Induced Plasticity (TRIP) steels present complex multi-phase microstructures consisting of a ferritic matrix and a dispersion of multiphase grains of bainite, martensite and metastable retained austenite (Jacques et al., 2001, [86]). The austenitic phase transforms to martensite when subject to mechanical or thermal loading (e.g. Angel, 1954, [4]; Lecroisey and Pineau, 1972, [103]; Olsen and Cohen, 1975, [142]; Stringfellow et al.,1992, [167]). The austenite-to-martensite formation is displacive which gives rise to internal stresses that may cause the yielding of the surrounding austenite matrix (e.g. Greenwood and Johnson, 1965, [69]). The active formation of martensite substantially increases the macroscopic work-hardening rate while the associated transformation strain contributes to the ductility of TRIP steels.
Figure 1-1: Optical micrograph of the undeformed TRIP material. The RD and Th orientations correspond to the sheet rolling and through-the-thickness directions, respectively.
Chapter 2
Preliminaries
Contents
2.1 Characterization of the stress state ... 7 2.1.1 Stress invariants... 7 2.1.2 Plane stress condition ... 10 2.2 Ductile fracture modeling ... 12 2.3 Rate-independent plasticity of AHSS ... 15 2.4 Split Hopkinson Pressure bar systems ... 18
Abstract
Variables that will be used throughout the manuscript to describe the stress state are precisely defined. In addition, background information is given on the characterization and modeling of plasticity and ductile fracture of AHSS under static loading conditions. Finally, Split Hopkinson Pressure Bar systems, used for characterizing mechanical behavior of materials under compression at high rates of deformation, are presented.
2.1 Characterization of the stress state
2.1.1
Stress invariants
Throughout our discussion, a clear description of the stress state is important. The frame invariant part of the stress is described through the first invariant of the Cauchy stress tensor , and the second and third invariants of the corresponding deviatoric stress tensor, ( ⁄ ) ,
( ) (2-1)
(2-2)
and
( ) (2-3)
Note that the hydrostatic stress and the von Mises equivalent stress are respectively proportional to the first and second invariants,
(2-4)
√ (2-5)
The stress state may be characterized through two dimensionless functions of the above invariants. We define the stress triaxiality as the ratio of the mean stress and equivalent von Mises stress,
√ (2-6)
with . The normalized third invariant is written as (Ilyushin, 1963, [84])
√
(2-7)
and lies in the range ; it characterizes the position of the second principal stress with respect to the maximum and minimum principal stresses and .
Alternatively the third invariant can be described in terms of the so-called Lode angle parameter
2.1. Characterization of the stress state 9
Figure 2-1: Characterization of the stress states in terms of stress triaxiality and Lode angle parameter. The blue, black and red lines highlight the plane stress states as described by Eq. (2-16).
According to the definition above, the Lode angle parameter approximates the negative Lode number (Lode, 1925, [113]),
̅ (2-9)
Note that the principal stresses , and are got back using
̅[ ( ̅)] (2-10)
̅[ ( ̅)] (2-11)
̅[ ( ̅)] (2-12)
( ̅) ( ( ̅)) (2-13)
( ̅) ( ( ̅)) (2-14)
( ̅) ( ( ̅)) (2-15)
Throughout this manuscript, the term stress state is employed to make reference to the pair of parameters ( ̅). Well-known stress states that we will refer to frequently are: Uniaxial tension ( ̅ ) Pure shear ( ̅ ) Generalized shear ( ̅ ) Axisymmetric tension ( ̅ ) Axisymmetric compression ( ̅ )
A representation of the ( ̅) stress state space is depicted in Fig. 2-1.
2.1.2
Plane stress condition
In sheet materials, the plane stress condition often prevails: one of the principal stress directions is parallel to the sheet thickness direction and the corresponding principal stress is equal to zero.
In case of plane stress, the stress triaxiality and the normalized third invariant are uniquely related according to the relationship
( ) (2-16)
In this investigation we focus more specifically on stress states in the vicinity of biaxial tension, i.e. plane stress states between uniaxial tension and equi-biaxial tension. In this case the stress triaxiality varies between 1/3 (uniaxial tension) and 2/3 (equi-biaxial
2.1. Characterization of the stress state 11
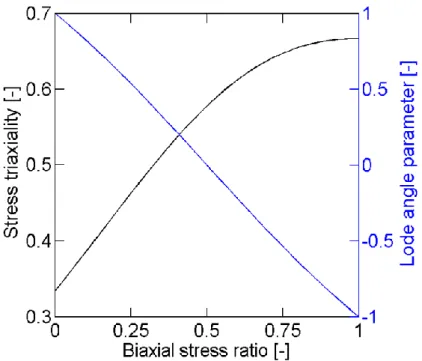
Figure 2-2: Relation between the stress triaxiality , the Lode angle parameter ̅ and the stress ratio in case of biaxial stress states.
tension). At the same time, the third invariant decreases from 1 (uniaxial tension) to -1 (equi-biaxial tension).
Denoting , the principal values of the Cauchy stress tensor, the stress state in biaxial tension is then fully characterized by the biaxial stress ratio
(2-17)
with . The stress triaxiality then reads
√ (2-18)
Figure 2-2 depicts the relationship between the stress triaxiality (black line in Fig. 2-2) and the Lode angle parameter ̅ (blue line in Fig. 2-2) to the biaxial stress ratio in case of a biaxial stress state.
2.2 Ductile fracture modeling
Ductile fracture is the result of a progressive material deterioration occurring during plastic deformation, generally identified as the nucleation and growth of micro-voids that ultimately link to form cracks. The early investigations of McClintock (1968, [119]) and Rice and Tracey (1969, [152]) on the evolution of cylindrical and spherical holes in ductile matrices have set the foundation for numerous studies on the micromechanics associated with void growth. The most prominent is that of Gurson (1977, [70]), who proposed a porous plasticity model based on the micromechanical analysis of a thick spherical shell subject to hydrostatic pressure. The model describes the growth of voids and its influence on the material’s stress carrying capacity at large mean stresses (but becomes less accurate for shear loads). The original Gurson model has been repeatedly modified to account for additional processes responsible for the material deterioration and subsequent ductile fracture: void nucleation (e.g. Chu and Needleman, 1980, [35]), loss of load-carrying capacity associated with void coalescence (e.g. Tvergaard and Needleman, 1984, [181]), enhanced strain hardening models (e.g. Leblond et al., 1995, [102]), void shape effects (e.g. Gologanu et al., 1993, [67]; Gologanu et al., 1994, [68]; Garajeu et al., 2000, [62]; Pardoen and Hutchinson, 2000, [146]) and plastic anisotropy (e.g. Benzerga et al., 2004, [18]). The reader is referred to Lassance et al. (2007, [100]) and Benzerga and Leblond (2010, [19]) for a comprehensive review of successive improvements of the Gurson model. Gurson type of models are not only used to describe macroscopic plastic behavior of materials with small void volume fractions, but also to predict ductile fracture assuming that fracture occurs as the void volume fraction reaches a critical value. As a result, “traditional” Gurson models are unable to predict fracture under shear-dominated loading conditions, where the void growth mechanism is inactive. Numerical investigations of an initially spherical void contained in a cubic unit cell submitted to various tri-axial loadings (e.g. Zhang et al., 2001, [196]; Gao and Kim, 2006, [59]) showed that the third stress invariant (or Lode parameter) has a strong influence on void shape evolution and on coalescence. The influence of the third stress invariant on the ductility of metals is
1 This Section is reproduced from: Dunand, M. and D. Mohr (2011). "On the predictive
capabilities of the shear modified Gurson and the modified Mohr–Coulomb fracture models over a wide range of stress triaxialities and Lode angles". Journal of the Mechanics and Physics of Solids 59(7): p. 1374-1394.
2.2. Ductile fracture modeling 13
also shown experimentally (e.g. Barsoum and Faleskog, 2007, [15]). This particular shortcoming of Gurson models has been addressed by the recent models of Xue (2008, [193]) and Nahshon and Hutchinson (2008, [130]). The latter consider the void volume fraction as damage parameter, and introduce a dependency of the damage evolution on the third stress invariant. This empirical modification has been introduced in an ad-hoc manner to deal with the material deterioration due to void distortion and inter-void linking under shearing. As a result, the Nahshon-Hutchinson model can predict failure under shear-dominated loading, such as during the cutting of sheet metal (Nahshon and Xue, 2009, [131]). However, Nielsen and Tvergaard (2009, [137]) found that this modification is inadequate in the case of high stress triaxialities, compromising the predictive capabilities of the original Gurson model for loading conditions where void growth is the main damage mechanism. Consequently, Nielsen and Tvergaard (2010, [138]) proposed a slight modification of the Nahshon-Hutchinson model, making the damage accumulation under shear-dominated stress states active only for low stress triaxialities. It is noted that these two recent shear-modified Gurson models do not account for the effect of void distortion at large shear strains. Micromechanical models that are able to deal with general ellipsoidal void shape evolution are still at an early stage of development and require further validation (e.g. Leblond-Gologanu, 2008, [101]).
As an alternative to Gurson type of models, uncoupled fracture models have been developed for metals where standard incompressible plasticity models are used in conjunction with a separate fracture model (e.g. Fischer et al., 1995, [57]). Unlike in Gurson models, it is assumed that the evolution of damage has no effect on the effective stress-strain response of the material before fracture occurs. Within this framework, damage is measured through the scalar variable and its increase is defined though the increment of the equivalent plastic strain ̅ with respect to a stress-state dependent reference failure strain ̂,
̅
̂( ) (2-19)
Assuming an initial value of for the material in its undeformed configuration, it is postulated that fracture initiates as . The reference failure strain may be
interpreted as a weighting function and corresponds to the strain to fracture for monotonic proportional loading. It is either chosen empirically or inspired by micromechanical results. A comparative study of various weighting functions (including models based on the work of McClintock (1968, [119]), Rice and Tracey (1969, [152]), LeRoy et al. (1981, [108]), Cockcroft and Latham (1968, [37]), Oh et al. (1979, [140]), Brozzo et al. (1972, [24]), and Clift et al. (1990, [36])) showed that none of them can accurately describe the fracture behavior of a aluminum 2024 over a large range of stress triaxialities (Bao and Wierzbicki, 2004, [11]). Wilkins et al. (1980, [192]) proposed a weighting function depending on the asymmetry of the deviatoric principal stresses in addition to hydrostatic pressure. It was assumed that the effect of hydrostatic pressure and stress asymmetry on ductility were separable. Attempts to define a more general fracture criterion have lead to the introduction of the third invariant of the stress tensor in the weighting function (e.g. Wierzbicki and Xue, 2005, [191]). Recently, Bai and Wierzbicki (2010, [6]) transposed the classical Mohr Coulomb fracture criterion into the space of stress triaxiality, Lode angle and equivalent plastic strain, defining the so-called Modified Mohr-Coulomb (MMC) fracture criterion.
There exist two more widely-used alternatives to the above two modeling approaches: Continuum Damage Mechanics (CDM) and Forming Limit Curves (FLC). In the framework of Continuum Damage Mechanics, material degradation is modeled through an internal damage variable while the constitutive equations are derived from the first and second principles of thermodynamics for continuous media (e.g. Lemaitre, 1985, [107]; Chaboche, 1988, [31, 32]). Most sheet metal forming processes are still designed against failure based on the concept of FLCs. The FLC is typically constructed in the space of the principal in-plane strains based on the experimental results for uniaxial tension and a series of Nakazima tests (e.g. Banabic et al., 2000, [9]). It is then assumed that failure (either necking or fracture) occurs as the strain path in a sheet metal forming operation crosses the FLC. In this approach, it is assumed that the FLC is independent of the loading path.
2.3. Rate-independent plasticity of AHSS 15
2.3 Rate-independent plasticity of AHSS
From a mechanical point of view, TRIP-assisted steels may be considered as composite materials at the micro-scale. Papatriantafillou et al. (2006, [145]) made use of homogenization techniques for nonlinear composites (e.g. Ponte Castaneda, 1992, [148]) to estimate the effective properties of TRIP-assisted steels. Based on the work by Stringfellow et al. (1992, [167]) for fully austenitic TRIP steels, Papatriantafillou et al. (2006, [145]) formulated the computational procedure for a four phase metallic composite with evolving phase volume fractions and isotropic viscoplastic phase behavior. Turteltaub and Suiker (2005, [176]) presented a more detailed multi-scale model for TRIP-assisted steels which includes anisotropic features associated with the phase crystal orientations and the martensite twinning. A mean-field model which describes DP steels as a composite of isotropic elasto-plastic phases with spherical inclusions has been proposed by Delannay et al. (2007, [44]). This model has been enhanced further to TRIP-assisted steels (Delannay et al., 2008, [45]) using the assumption that spherical austenite inclusions transform instantaneously into spherical martensite inclusions. Based on the intermediate strain rate tensile testing of TRIP600 and DP600 steels, Huh et al. (2008, [82]) conclude that both the flow and ultimate tensile strength increase as the level of pre-strain increases.
Most AHSS exhibit a pronounced Bauschinger effect. Banu et al. (2006, [10]) adopted an isotropic Swift law combined with saturated kinematic hardening of the Amstrong-Frederick type to model a series of Bauschinger simple shear tests on a DP600 steel. The accurate modeling of the cyclic behavior of AHSS is important in drawing operations where the sheet material is both bent and unbent. Using a stack of laminated dogbone specimens along with an anti-buckling device, Yoshida et al. (2002, [194]) measured the response of a DP590 steel under cyclic uniaxial tension-compression loading at large strains. Their study shows that the combination of isotropic, non-linear kinematic and linear kinematic hardening provides a satisfactory model for the observed transient and permanent softening in the dual phase steel. As Yoshida et al. (2002, [194]), Lee et al. (2005, [105]) emphasize the importance of an
2 This Section is reproduced from: Mohr, D., M. Dunand, and K.H. Kim (2010). "Evaluation of
associated and non-associated quadratic plasticity models for advanced high strength steel sheets under multi-axial loading". International Journal of Plasticity 26(7): p. 939-956.
accurate description of the Bauschinger and transient behavior in view of springback computations. Based on the comparison of uniaxial experiments on a DP steel and simulations, Lee et al. (2005, [105]) concluded that a modified Chaboche type combined isotropic-kinematic hardening law provides a good representation of the Bauschinger and transient behavior. However, a recent study by Tarigopula et al. (2008, [172]) on a DP800 steel demonstrated that the modeling of transient anisotropy in plastic flow induced by strain-path changes cannot be represented correctly when using a non-linear combined isotropic-kinematic hardening model. Broggiato et al. (2008, [22]) performed 3-point-bending tests on two DP600 and a TRIP700 steel. Their results show that the cyclic hardening behavior of both steel grades is very similar and can be modeled using a non-linear combined isotropic-kinematic hardening model. Using a double-wedge device, Cao et al. (2008, [29]) performed uni-axial tension-compression tests on 1.6mm thick DP600 steel. They modeled their experiments using using a modified Chaboche type combined isotropic-kinematic hardening law (with permanent softening and non-symmetric reloading) as well as the two-surface model by Lee et al. (2007, [104]). Note that the present thesis focuses only on monotonic loadings of the sheet material. Considerations on possible kinematic hardening will therefore be disregarded in the present work.
Different yield surfaces have been used in the past to model advanced high strength steels: von Mises yield surface (e.g. Yoshida et al., 2002, [194]; Durrenberger et al., 2007, [51]), quadratic anisotropic Hill (1948, [78]) yield function (e.g. Banu et al., 2006, [10]; Padmanabhan et al., 2007, [143]; Broggiato et al., 2008, [22]; Chen and Koc, 2007, [34]), high exponent isotropic Hershey (1954, [77]) yield function (Tarigopula et al., 2008, [172]), non-quadratic anisotropic Barlat (2003, [13]) yield function (Lee et al., 2005, 2008, [105, 106]). The reader is referred to Chaboche (2008, [33]) for a recent review of macroscopic plasticity theories.
The plastic behavior of the present TRIP780 material has been extensively characterized by Mohr et al. (2010, [122]). Using both uniaxial tension as well as biaxial shear-tension experiments (Mohr & Oswald, 2008, [126]), they measured the material response at low strain rate for more than twenty different stress states in the range of pure shear to transverse plane strain tension. A characteristic feature of this material is that almost same stress-strain curves are measured for uniaxial tension along
2.3. Rate-independent plasticity of AHSS 17
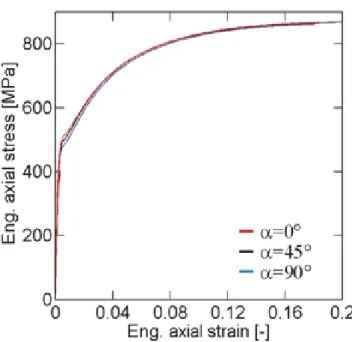
different material orientations (as shown in Fig. 2-3), indicating a planar isotropic yield behavior. At the same time the plastic flow exhibits a strong anisotropy: the Lankford ratios3 are r0=0.67, r45=0.96 and r90=0.85 for tension along the rolling direction, the 45° direction and the transverse direction, respectively. Mohr et al. (2010, [122]) proposed a rate-independent plasticity model made of (a) a planar isotropic quadratic yield surface, (b) a orthotropic quadratic non-associated flow rule and (c) isotropic strain hardening to capture this behavior.
Note that the discussion of non-associated formulations in metal plasticity has been partially initiated by the experimental observations of Spitzig and Richmond (1984, [162]). Non-associated plasticity models for metals have been considered by Casey and Sullivan (1985, [30]), Brünig and Obrecht (1998, [27]), Brünig (1999, [25]), Lademo et al. (1999, [99]), Stoughton (2002, [164]), Stoughton and Yoon (2004, 2008, [165, 166]) and Cvitanic et al. (2008, [41]).
Figure 2-3: Uniaxial tensile testing – engineering stress strain curve along the sheet rolling direction (red), transverse direction (blue) and 45° direction (black).
3 Lankford ratios, or r-values, characterize the preferred direction of plastic flow under uniaxial
tension and correspond to the ratio of width to thickness plastic strain rate: ⁄ . They are a widely used indicator of plastic anisotropy.
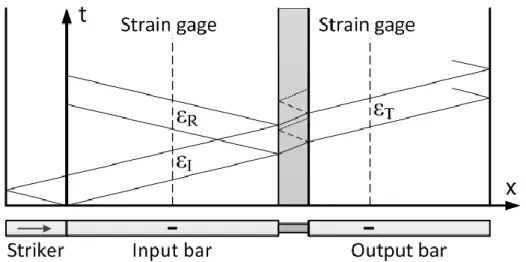
Figure 2-4: Schematic of a Split Hopkinson Pressure Bar system
2.4 Split Hopkinson Pressure bar systems
The experimental characterization of the mechanical behavior of a material at high rates of deformation requires specific experimental techniques. Issues particular to high strain rate testing include generating an appropriate loading pulse (a high velocity loading, of the order of 10m/s, with a rise time of a few tens of microseconds is required) and measuring forces applied to the tested specimens (in view of the extremely high accelerations occurring in high strain rate experiments, measured forces can easily be perturbed by spurious inertia effects). For an comprehensive review of high strain rate experimental techniques, the reader is referred to Field et al. (2004,[56])
Figure 2-5: Wave-propagation diagram depicting the propagation of elastic waves in the SHPB system through space (horizontal axis) and time (vertical axis).
2.4. Split Hopkinson Pressure bar systems 19
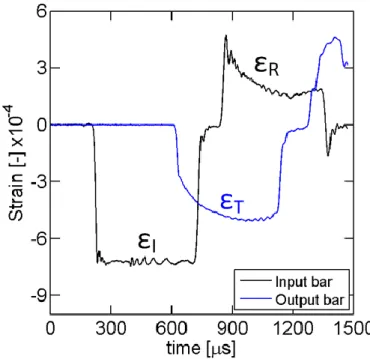
Figure 2-6: Example of signals measured in a SHPB experiment by the input (black line) and output (blue line) strain gages.
In this work, we will make use of a Split Hopkinson Pressure Bar (SHPB) system (Hopkinson, 1914, [80]; Davis, 1948, [43]; Kolsky, 1949, [96]) to perform high strain rate experiments. This type of apparatus has been widely used over the last 40 years to characterize the high strain rate behavior of materials under compression (e.g. Kolsky, 1949, [96]), and modified versions have been proposed for tension (e.g. Harding et al., 1960, [73]) or torsion (e.g. Duffy et al., 1971, [46]) loadings. SHPB systems permit to perform experiments with strain rates ranging from a few hundreds to a few thousands s-1.
A typical SHPB system is shown in Fig. 2-4. It consists of two coaxial slender bars that sandwich the specimen to be tested. The bars can be made of steel, aluminum, polymers (e.g. Zhao et al., 1997, [200])… depending on the strength of the specimen. During an experiment, the free end of the input bar (left side in Fig. 2-4) is impacted by a slender striker at a velocity . As a result, a compressive pulse is generated and propagates in the input bar towards the specimen. The propagation of the elastic waves in the system during an experiment is depicted in Fig. 2-5. When reaching the input bar/specimen interface, the loading pulse, or incident wave , is partially reflected in
the input bar (reflected wave ) and partially transmitted to the specimen. Similarly, when the wave inside the specimen reaches the specimen/output bar interface, it is partially reflected back in the specimen and partially transmitted to the output bar (transmitted wave ). The time-history of the elastic waves are recorded at specific locations in the input and output bars by strain gages. Examples of measured signals are shown in Fig. 2-6. Strain waves at any locations within the bars, and especially at the bar/ specimen interfaces, are reconstructed using analytical methods that describe the propagation of longitudinal waves in elastic cylindrical bars (e.g. Zhao and Gary, 1995, [197]) and then used to obtain the forces and velocities applied by the bars to the specimen boundaries (see Section 3.3.2 for more details).
Chapter 3
High strain rate tensile experiments
Contents
3.1 Introduction ... 22 3.2 Load inversion device ... 27 3.2.1 Design objective and strategy ... 27 3.2.2 Proposed design ... 29 3.3 Experimental procedure ... 31 3.3.1 Split Hopkinson Pressure Bar (SHPB) system ... 31 3.3.2 Forces and velocities at the specimen boundaries ... 32 3.3.3 Local displacement measurements ... 34 3.3.4 Determination of the stress-strain curve ... 34 3.4 FEA-based validation ... 35 3.4.1 Finite element model ... 36 3.4.2 Simulation results ... 37 3.5 Validation experiments ... 41 3.5.1 High strain rate uniaxial tension experiments ... 41 3.5.2 Notched tension experiments ... 48 3.6 Conclusions... 50
Abstract
A high strain rate tensile testing technique for sheet materials is presented which makes use of a split Hopkinson pressure bar system in conjunction with a load inversion device. With compressive loads applied to its boundaries, the load inversion device introduces tension into a sheet specimen. Detailed finite element analysis of the experimental set-up is performed to validate the design of the load inversion device. It is shown that under the assumption of perfect alignment and slip-free attachment of the specimen, the measured stress-strain curve is free from spurious oscillations at a strain
4 This Chapter is reproduced from: Dunand, M., G. Gary, and D. Mohr (2013). "Load-Inversion
Device for the High Strain Rate Tensile Testing of Sheet Materials with Hopkinson Pressure Bars".
rate of 1000s-1. Validation experiments are carried out using tensile specimens, confirming the oscillation-free numerical results in an approximate manner.
3.1 Introduction
The stress-strain response of engineering materials at high strain rates is typically determined based on uniaxial compression experiments on Split Hopkinson Pressure Bar (SHPB) systems (Kolsky, 1949, [96]). In the case of sheet materials, it is difficult to perform a reliable dynamic compression experiment due to limitations associated with buckling. Different techniques have been developed in the past for the high strain rate tensile testing of materials. The key challenges lie in the generation of the tensile loading pulse and the attachment of the specimen to the Hopkinson bars. The specimen gage section is always subject to a tensile pulse, but it is worth differentiating between techniques where the specimen boundaries are subject to tensile loading and those where a compressive loading is applied to the specimen. In the case where the specimen is subject to compressive loading, the loading pulse is inverted within the specimen. When a tensile loading is applied to the specimen boundaries, one may differentiate further between techniques where a tensile loading pulse is generated in the input bar and those where a compressive loading pulse is generated. Throughout our discussion of SHB systems, we will always assume a left-to-right positioning of the specimen, the input bar and the output bar.
Harding et al. (1960, [73]) proposed a technique where the specimen boundaries are subject to tensile loading while a compressive loading pulse is generated in the input bar. They placed a round inertia bar (output bar) inside a hollow tube (input bar). The right specimen shoulder is then connected to the right end of the tube, while the left shoulder is connected to the right end of the inertia bar; both connections are established through mechanical joints (Fig. 3-1a). A rightward travelling compressive loading pulse is generated in the tube which loads the specimen under tension. Only the elastic waves propagating in the output bar are measured in this experiment, therefore requiring two tests with the same loading pulse (one with a specimen, one with the output bar directly connected to the mechanical joint) to measure the force and velocities applied to the specimen boundaries. Nicholas (1981, [135]) and Ellwood et
3.1. Introduction 23
(a) (b)
(c) (d)
(e) (f)
Figure 3-1: Configurations for tensile testing with SHPB systems. The arrows highlight the direction of the incident wave (which is always compression). These schematics just illustrate the basic principle. The black pin-like symbol just indicates the approximate location of specimen attachment and may also correspond to an adhesive or other mechanical joint in reality.
al. (1982, [54]) developed a tensile experiment based on a SHPB system, in which an axisymmetric tension specimen is attached to the bar ends and surrounded by a collar initially in contact with the right end of the input bar and the left end of the output bar (Fig. 3-1b). The generated compressive loading pulse is transmitted to the output bar through the collar, without inducing any plastic deformation in the specimen. The loading pulse is then reflected into a tensile pulse at the free right output bar end which then loads the specimen under tension.
As an alternative to inverting the compressive loading pulse within the bars prior to loading the specimen, different techniques have been proposed where the loading pulse is inverted at the specimen level. Lindholm and Yeakley (1968, [112]) developed a hat-shaped specimen (Fig. 3-1c) which is put over the right end of the input bar (input bar diameter equals the hat’s inner diameter), while the hat’s rim is connected to a tubular output bar that partially overlaps with the input bar (inner output bar diameter equals the hat’s outer diameter). Four gage sections are machined in the hat’s cylindrical side wall to guarantee a uniaxial stress state at the specimen level. Mohr and Gary (2007, [123]) proposed an M-shaped specimen to transform a compressive loading at the specimen boundaries into tensile loading of the two gage sections (Fig. 3-1d). The M-shaped specimen is used for transverse plane strain tension, which allows shorter gage sections and therefore higher strain rates, and has been validated for strain rates higher than 4,000/s. The key advantage of their technique is that there is no need to attach the specimen to the bars.
For sheet materials, Tanimura and Kuriu (1994, [171]) proposed a non-coaxial SHPB system (Fig. 3-1e). The input and output bars are laterally shifted while a pin joint is used to attach the sheet specimen to the sides of the bars. Mouro et al. (2000, [129]) used a co-axial SHPB system to perform high strain rate tension experiments on sheet metal. They modified the shape of the bar ends such that a two-dimensional multi-gage section hat-shaped sheet specimen can be inserted between the input and output bars of a SHPB system. The specimen must be bent into the hat geometry prior to testing which introduces additional geometric inaccuracies. Haugou at al. (2006, [74]) adopted a configuration where four specimens are bonded to the external part of two threaded sleeves initially in contact and screwed to the input and output bars (Fig. 3-1f), thus permitting to use optical strain measurement methods. Similar to the
3.1. Introduction 25
technique proposed by Nicholas (1981, [135]), the compressive incident wave is thus directly transmitted to the output bar, before the reflected tensile pulse loads the specimens. Instead of inverting a compressive loading pulse, a tensile loading pulse may be directly generated in the input bar using a Split Hopkinson Tensile Bar (SHTB) system. Albertini and Montagnani (1974, [3]) and Staab and Gilat (1991, [163]) generated the tensile loading pulse in the input bar by releasing the elastic energy initially stored in a clamped and pre-stressed section of the input bar. The authors report a rising time of about 40μs to 50μs which is significantly larger than that in SHPB experiments; this is due to the time needed to release the clamping of the pre-stressed input bar. The tensile loading pulse can also be generated through a tubular striker surrounding the input bar and impacting an anvil attached to the input bar end (Ogawa, 1984, [139]). This technique is widely used (e.g. Wang et al., 2000, [188]; Huh et al., 2002, [81]; Smerd et al., 2005, [160]; Van Slycken et al., 2007, [182]; Verleysen et al., 2011, [185]; Guzman et al., 2011, [71]; Song et al., 2011, [161]). It can achieve rising times of the loading pulse of 20μs (Li et al., 1993, [109]). The loading pulse duration is often less than 300 μs in case of steel strikers (e.g. Song et al., 2011, [161]; Gerlacht et al., 2011, [65]) because of technological difficulties in supporting the input bar and the distance required for accelerating the striker bar, but longer pulse durations can be reached with polymeric strikers.
Split Hopkinson bar systems are typically used to perform experiments at strain rates in the range of a few hundreds to a few thousands s-1. In classical Hopkinson bar set-ups, the useful measuring time is limited by the length of the bars, imposing a compromise between the minimum achievable strain rate and the maximum achievable strain. Deconvolution techniques accounting for wave dispersion (e.g. Lundberg and Henchoz, 1977, [115]; Zhao and Gary, 1997, [199]; Bussac et al., 2002, [28]) have been developed to extend the available measuring time, allowing for large deformation experiments at intermediate strain rates. Alternative experimental techniques have also been proposed to perform tensile experiments in the intermediate and high range of strain rates, such as high velocity servo-hydraulic testing machines (e.g. Haugou et al., 2004, [75]; Rusinek et al., 2008, [154]) or direct impact methods (e.g. Tanimura et al., 2003, [171]).
Apart from the method used to generate the tensile loading, a specific issue with high strain rate tensile experiments lies in the attachment of the specimen to the testing apparatus. In the specific case of sheet materials, specimens can be either attached through pin connections (e.g. Tanimura and Kuriu, 1994, [171]), glued (e.g. Haugou et al., 2006, [74]), welded (e.g. Quik et al., 1997, [149]) or hold by friction through curvature (Mouro et al., 2000, [129]) or directly applying high lateral pressure (e.g. Huh et al., 2002, [81]). Pin joints lead to high stress concentrations around the pin/specimen interface, non-negligible deformations outside the specimen gage section and oscillations due to the vibration of the specimen shoulders. The use of epoxy adhesives for specimen attachment appears to reduce the oscillations in the measured force histories. However, it is speculated that this is due to the fact that adhesives act as mechanical filters and therefore suppress the oscillations from the measurements even though these are present within the specimen gage section. In particular, further research is needed to evaluate the influence of the visco-elastic behavior of epoxies on the accuracy of force measurements in SHTB experiments. High pressure clamps appear to be the suitable for attaching the specimen if the applied pressure is large enough to avoid slipping of the specimen and if the inertia of the clamp (including possible screws) is either negligible or matches the impedance of the bar.
In standard Hopkinson bars experiments, measurements of elastic waves propagating in the input and output bars with strain gages permit one to derive the history of force and velocity applied by the bars to each boundary of the specimen (Kolsky, 1949, [96]). In the case of tension experiments where specimen shoulders are wider than the gage section (dogbone shape), bar end displacement can only give an approximation of the strain in the gage section, as it does not take into account the deformation of the transition zones between the gage and clamping sections of the specimen. Optical methods are now widely used for a direct measurement of the strain history in the specimen gage section, such as laser beams (Li and Ramesh, 2007, [110]), Moiré techniques (e.g. Verleysen and Degrieck, 2004, [183]) and digital correlation of high speed video images from a single camera (e.g. Tarigopula et al., 2008, [173]) or stereo DIC with two cameras (e.g. Gilat et al., 2009, [66]).
In this chapter, we propose a new experimental technique for the tensile testing of a single sheet specimen in a modified split Hopkinson Pressure Bar apparatus made of