1
Comparison of residual stresses on long rolled profiles measured by X-ray diffraction, ring core and the sectioning methods and simulated by FE method
Authors
Chantal Bouffiouxa,*, Raphaël Pescib, Romain Bomanc, Nicolas Cailletd, Jean-Philippe Ponthotc, Anne Marie Habrakena
a University of Liège, Dept. ArGEnCo, Quartier Polytech 1, allée de la Découverte 9, B-4000 Liège, Belgium
b ENSAM-Arts et Métiers ParisTech, Laboratoire d'Etudes des Microstructures et de Mécanique des Matériaux (LEM3)
UMR CNRS 7239, 4 rue Augustin Fresnel, 57078 Metz Cedex 3, France
c University of Liège, Dept. A&M, Quartier Polytech 1, allée de la Découverte 9, B-4000 Liège, Belgium d ArcelorMittal, Research and Development, rue de Luxembourg 66, L-4009 Esch/Alzette, Luxemburg
*Corresponding author. Tel.: +32 4 366 9219, Fax: +32 4 366 9192.
E-mail addresses: chantal.bouffioux@ulg.ac.be (C. Bouffioux), raphael.pesci@ensam.eu (R. Pesci), r.boman@ulg.ac.be (R. Boman), nicolas.caillet@arcelormittal.com (N. Caillet), jp.ponthot@ulg.ac.be (J. P. Ponthot),
anne.habraken@ulg.ac.be (A. M. Habraken).
Abstract
Sheet piles are produced by hot rolling, a cooling step and, if required, by a straightening operation. Numerical simulations indicate that the stress field is almost homogeneous through the thickness, justifying the comparison of X-ray diffraction, ring core and the sectioning methods applied after the cooling step and after the straightening process. The equipment, the steps of the experimental
procedures and the results are detailed, showing the limits, the specificities and the advantages of each method. Moreover, the amplitude and the distribution of the stresses along the width of the sections present good agreement with results of numerical simulations.
2
Keywords
Residual stresses; X-ray diffraction; Ring-core; Sectioning; Sheet piles; Structural steel
1. Introduction
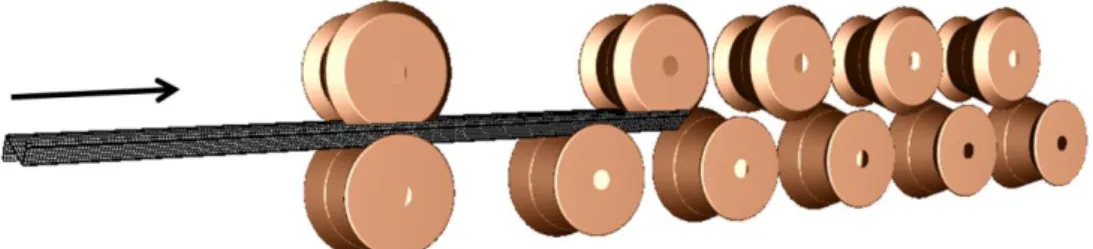
The sheet piles studied in this research are produced by ArcelorMittal, by hot rolling. The following cooling step, at ambient temperature, generates residual stresses and deformations. As the sheet piles have to be perfectly straight to easily fasten them to the others, an additional straightening process is applied to meet the standards. This straightening operation is performed by a series of identical rollers which lead the pieces by friction. The rollers are placed alternately above and below the pieces with shifts creating a succession of bendings (Fig. 1) and modifying the residual stress field generated by the cooling procedure.
The residual stress fields, inherent to any manufacturing process, are important data to know and to control as they can have a destructive or beneficial effect. They can modify the stiffness, the
toughness and have an impact on the piece service life. Numerous methods are developed to measure these stresses, each with specifications and limits, depending on the geometry of the pieces, the accessibility of the different parts, the measurement depth, the stress distribution ... These different methods are largely described in literature, for instance by Rossini et al. [1] with a comparison of numerous techniques classified into three categories: non destructive [2], semi destructive and destructive. Withers et al. tested and compared some of these techniques on a thick section in [3] (magnetic, synchrotron and contour methods). Moreover, these manufacturing processes are also often studied by finite elements models. In this study, the numerical and experimental methods are coupled: first, the numerical distribution of the stresses helps to chose three methods to measure the residual stresses and, secondly, the experimental measurements, among which the residual stress
3
fields, are used to validate the numerical model. The final goal is to create an efficient numerical tool for a better understanding of the procedures, making possible to study the sensitivity to the forming parameters, to optimize the industrial settings and, finally, to reduce both the final deformation and the level of the residual stress field.
The Finite Element method is often used to analyse the stress field. Quach et al. [4] used a numerical model to study the residual stresses in press-braked thin-walled steel section where the maximum levels occurred in the corner region and away from the surfaces, making difficult to use conventional measuring methods assuming a linear variation across the thickness. Jandera et al. [5] explored the effect of the residual stresses in cold-rolled stainless steel box sections using the X-ray diffraction measurements for a numerical model verification. These measures showed the influence of the through-thickness residual stresses on the structural behaviour of the sections.
The Finite Element code Metafor used in the current research, dedicated to process modelling, has already been applied on problems similar to straightening with difficult contact conditions,
complicated boundary conditions and friction, highly nonlinear material behaviour... [6]. The applied models (the boundary conditions, the industrial setting, the thermo-physical properties, the material laws, the material parameter data) and the simulations results related to the cooling and straightening processes of sheet piles are described in Bouffioux et al. [7]. The simulation results, validated by the measurements of the deformations and the rollers forces, indicate that the stress field is almost
constant throughout the thickness and that the longitudinal stresses are dominant in the central part of the web and the flanges. This information is precious as it helps to choose the appropriate methods to measure the residual stress fields.
The present article is focused on the residual stress measurements. Three methods are applied: first, a non-destructive one, i.e. the X-ray Diffraction (XRD) method, with measures near the surface, then another one, semi-destructive, i.e. the ring core method (with strain gauge rosettes) and finally, a destructive procedure, i.e. the sectioning technique. These procedures are selected in function of the
4
material, the stress state, the geometry and the size of the pieces. ENSAM-Arts et Métiers ParisTech, laboratory LEM3, performed the XRD measurements and the MSM laboratory was in charge of the tests with the ring core and the sectioning methods.
XRD is mainly used for the determination of intergranular strains and residual stresses in crystalline materials. It is based on the measurement of the crystal lattice strains, through the variation of the interplanar spacing dhkl for some {hkl} diffraction planes. The current spacing dhkl measured is
compared to that of a stress free state in order to get the average residual stress using the sin2 method fully described in Macherauch et al. [8] and Inal et al. [9]. This technique is very efficient and enables to get the residual stress value in a few minutes provided there is no interference between the X-ray beam and the analyzed part. Some limitations exist; some errors can arise in particular for some materials containing coarse grains or severe textures.
For the ring core method, special strain gauge rosettes, with three strain gauges oriented in radial directions, are stuck on the surface. From the other side of the piece, rings are drilled around them. The stresses of the extracted small cylinders are released. The deformations appearing during the drilling are measured in the radial directions by the strain-gauges. The residual stresses are computed from these deformations with an elastic law. The method can be accurate since the stress field is homogeneous throughout the thickness. Usually, only an annular grove is drilled, on the surface around the strain gauge, leaving the upper part isolated from the surrounding material and causing the stress release [10]. In the present case, the complete extraction of the core, which is possible because the thickness is not too high, ensures the complete relaxation through the whole thickness. This method, not often documented in literature, is described by Masláková et al. [11]. As explained by Šarga and Menda [12], the method is less common than the hole-drilling method but is also less sensitive to the position of the cutting tool.
For the sectioning method, small tongue-shaped samples are cut. There are oriented in the length direction of the sheet pile. The stresses, which must be constant along this direction, are computed
5
from the membrane and bending strains released by the cutting, in one direction only, neglecting deformations in the other directions. This implies to limit the measurements to the direction where the stresses are clearly dominant. The method can be accurate when the stress variation through the thickness is small or linear which is consistent with the results of the numerical model. This
procedure, classically used in case of long profiles, is described by Spoorenberg et al. [13] for roller bent wide flange sections and by Cruise and Gardner [14] for the structural steel sections. Moreover, Yuan et al. [15] used this method to study the residual stress distributions in welded steel sections, proposed and validated distribution patterns for several geometries.
Fig. 1. Sheet pile and rollers during the straightening process.
2. Experimental data
The geometry of the sheet piles studied is shown in Fig. 2a, with a length of 6000 mm. The curvilinear coordinates (Xc), shown in Fig. 2b, are used in the following figures, to present the
stresses along the width of the section.
Hereafter, the associated number to a sheet pile (SP*) corresponds to its production order. Two pieces (the second and the fifth ones) were selected to be measured: the sheet pile 2 only cooled (SP2) and the sheet pile 5 cooled and straightened (SP5).
All the measurements of the residual stresses are performed at a minimum distance of 2000 mm from the ends of the pieces to avoid edge effect. The measurements by XRD and ring core methods are localised in section 1, while the sectioning technique is performed in section 2 (Fig. 3a). The stresses
6
are examined in the transverse (X) and longitudinal (Z) directions (Fig. 3b). The reproducibility of the measurements is tested in the central third part of the sheet pile 2.
Fig. 2. (a) Sheet pile geometry (AZ 38-700+1, b= 700 mm, h= 501 mm, t=19 mm, s= 14.2 mm, α= 63.2°, length= 6000
mm), (b) location of curvilinear coordinates: Xc.
Fig. 3. (a) Localisation of the measures: XRD and ring core method in section 1 and sectioning method in section 2 (L=
6000 mm), (b) global reference frame.
The material has an isotropic behaviour, verified by tensile tests performed in three directions. Young’s modulus (E=190000 MPa) is computed from the available tensile tests and Poisson’s ratio is estimated equal to 0.3 as for classical steel.
For confidential reasons, hereafter, the stress fields are normalised. However, the maximum numerical and measured residual stress levels are clearly lower than the yield stress.
b
b
h
t
s
α
Xc= 247 mm Xc= 786 mm a b a b7
3. X-ray diffraction method
3.1. Experimental procedure
All the measurements are made with a portable Proto iXRD goniometer (Fig. 4), using the sin²ψ method and a 2 mm diameter spot. The ferritic phase of the steel is analyzed following the European standard: analysis of the {211} planes using a CrK= 0.228 nm radiation (corresponding diffraction peak at 2= 156°), 13 ψ angles considered, elastic constants S1= -1.25.10-6 MPa-1 and 1/2S2=
5.76.10-6 MPa-1. The obtained residual stresses are averaged for a thickness of about 10 μm.
Fig. 4. (a and b) XRD equipment and measurements on the sheet pile.
Each measurement provides the residual stress value in one direction and is performed on the upper surface of the sheet pile. Only a limited number of points are measured as the main purpose is to compare the results of the different methods, not to obtain the stress field in the whole section by the XRD method.
3.2. Results
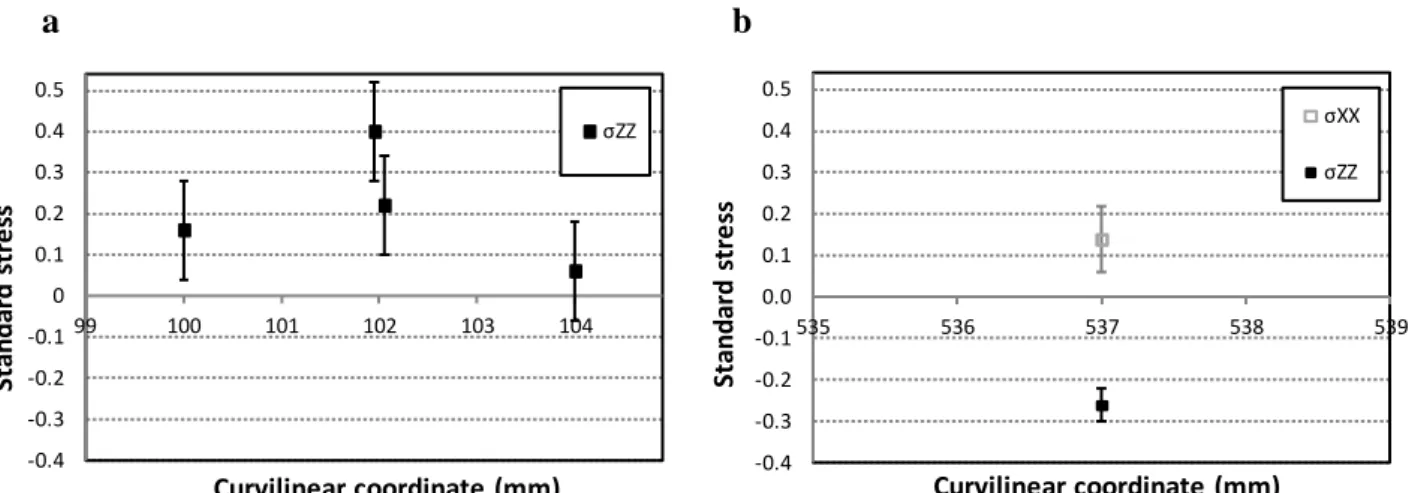
First, the measurements are performed on the sheet pile SP2 subjected to cooling only, with four measuring points distributed in the central part of the profile (one in section 1 and the three other ones between sections 1 and 2 in Fig. 3a), in the left flange but not exactly at the same curvilinear coordinate due to the presence of scale. The values of the longitudinal stresses σZZ, with their error
8
bars are shown in Fig. 5a, where the levels are dispersed. This scattering will be discussed in section 6.
The method is also applied to the sheet pile SP5 submitted to both cooling and straightening, at mid-width of the web, where two components σZZ and σXX are given in Fig. 5b, with the global frame
defined in Fig. 3b.
Fig. 5. Normalized residual stresses by the XRD method and error bars: (a) σZZ in sheet pile SP2, after cooling, on the
left flange (b) σZZ and σXX in sheet pile SP5, after cooling & straightening, on the web.
4. Ring Core method
4.1. Experimental procedure
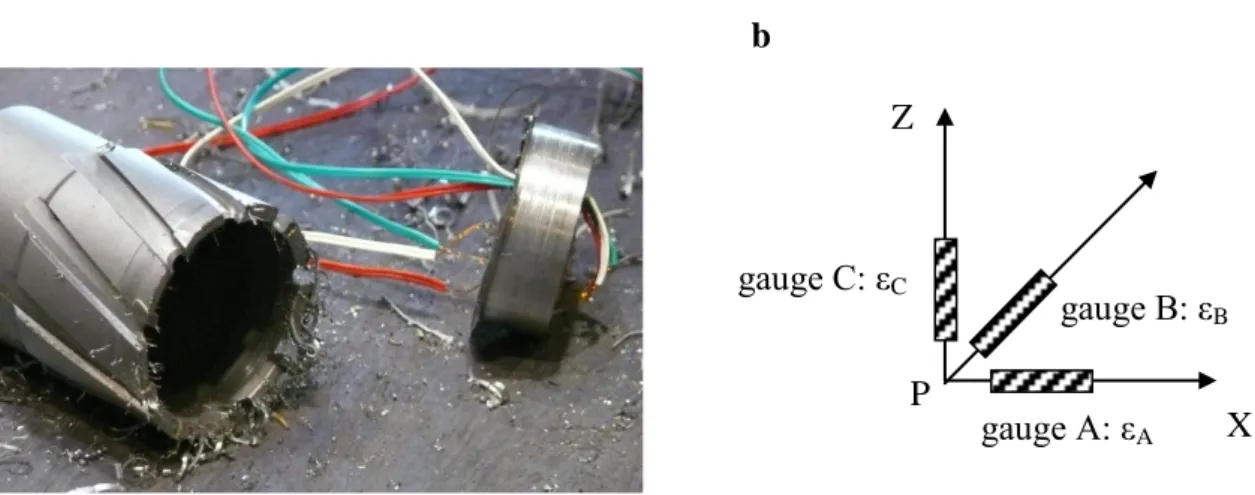
Ten strain gauges rosettes (ø: 14 mm) are stuck on different positions of section 1 (Fig. 3a), on the upper surface of the sheet piles 2 and 5 (respectively SP2, SP5). For SP2, additional rosettes are placed on the lower surface too, exactly in front of the first ones and small holes are drilled, as shown in Fig. 6 (a, b), in order to put all the wires on the same side of the profile. The strains released by this drilling operation are recorded to be added to the strains of the next step.
Then, annular groves (ø: 42 mm) are drilled around all the rosettes (Figs. 6c and 7a). Here too, the released strains are recorded in the three directions of the strain gauges A, B and C of each rosette (εA, εB and εC in Fig. 7b), with X and Z respectively in the transverse and longitudinal directions of
a b -0.4 -0.3 -0.2 -0.1 0 0.1 0.2 0.3 0.4 0.5 99 100 101 102 103 104 Sta n d ar d s tr e ss Curvilinear coordinate (mm) σZZ -0.4 -0.3 -0.2 -0.1 0.0 0.1 0.2 0.3 0.4 0.5 535 536 537 538 539 Sta n d ar d s tr e ss Curvilinear coordinate (mm) σXX σZZ
9
the sheet piles (see Fig. 3b). The strains are supposed to be fully released in the extracted cylinders.
Fig. 6. (a) Strain gauge rosette sticked on the sheet pile surface, (b) strain gauge rosettes after holes drilling, (c) ring
drilling procedure.
Fig. 7. (a) Tool used to drill the rings and core after the ring drilling procedure, (b) description of the strain gauge rosette
for residual stress measurements at point P.
Each measure is performed only once except for four specific measurements used to verify the reproducibility of the method. Therefore, the accuracy of the measurements from the rosettes could not be verified.
4.2. Results
The stresses in the transverse and longitudinal directions (X and Z) are computed from Eqs. (1) and (2) were the residual strains (εXX and εZZ) are deduced from the released strain εA and εC, with εXX =
-εA, and εZZ = -εC. a b a b c gauge A: εA gauge B: εB gauge C: εC X Z P
10
(1)
(2)
The strains of the gauges B, oriented at 45° from the gauges A and C, used to compute the principal stresses and the orientation of the principal axes, confirm that the dominant stresses (positive or negative) are always oriented in the Z direction.
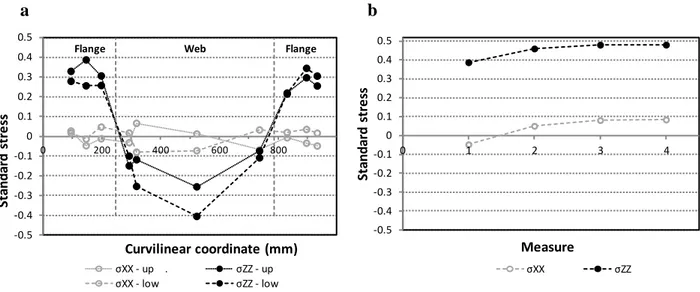
The distribution of the transverse and longitudinal stresses (σXX and σZZ) along the width of the
section, at the end of the cooling process (sheet pile 2), on the upper and lower surfaces ("σ**-up"
and "σ**-low"), are shown in Fig. 8a.
The reproducibility is checked by four measures performed at the same position in the section, in the middle of the left flange, with a 100 mm inter-distance in the longitudinal direction. The two
components of the standard stresses, computed on these four points, are shown in Fig. 8b, where the of the standard stress levels are almost identical. The maximum deviation, which can be the
imprecision of the method, has the same magnitude as the difference between the measures
performed on the two surfaces (Fig. 8a). This observation means that the difference between the two surfaces is not significant. It is consistent with the numerical model predictions where the residual stress state is homogeneous onto the thickness. Therefore, an average curve replaces the two sets of measures in Fig 9a, showing that the longitudinal stresses are clearly dominant.
11
Fig. 8. Residual stresses in sheet pile SP2, after cooling: (a) on the upper and lower surfaces in two directions: X and Z,
(b) verification of the stress reproducibility in the left flange, on the upper surface and in two directions: X and Z.
The distribution of the residual stresses in the sheet pile 5, subjected to the additional straightening after cooling is shown in Fig. 9b. It is clear that the stress variation through the width may be significant due to the localized contact between sheet pile and rollers. Such a phenomenon is classically observed for such processes.
Fig. 9. (a) Average residual stresses in the sheet pile 2, after cooling, in two directions: X and Z, (b) residual stresses in
the sheet pile 5, after cooling and straightening, on the upper surface and in two directions: X and Z.
a b a b -0.5 -0.4 -0.3 -0.2 -0.1 0 0.1 0.2 0.3 0.4 0.5 0 1 2 3 4 Sta n d ar d s tr e ss Measure σXX σZZ -0.5 -0.4 -0.3 -0.2 -0.1 0 0.1 0.2 0.3 0.4 0.5 0 200 400 600 800 Sta n d ar d s tr e ss Curvilinear coordinate (mm) σXX - up . σZZ - up σXX - low σZZ - low
Flange Web Flange
-0.6 -0.4 -0.2 -0.0 0.2 0.4 0.6 0.8 1.0 0 200 400 600 800 1000 Sta n d ar d s tr e ss Curvilinear coordinate (mm) σXX - up σZZ - up .
Flange Web Flange
-0.5 -0.4 -0.3 -0.2 -0.1 0 0.1 0.2 0.3 0.4 0.5 0 200 400 600 800 Sta n d ar d s tr e ss Curvilinear coordinate (mm) σXX_Ave σZZ_Ave .
12
5. Sectioning technique
5.1. Experimental procedure
This technique is carried out on the sheet pile 2 only, subjected to the cooling process. The test zone is localised at a minimum distance of 2000 mm from the extremities of the sheet pile, in section 2 (Fig. 3a), to avoid edge effect.
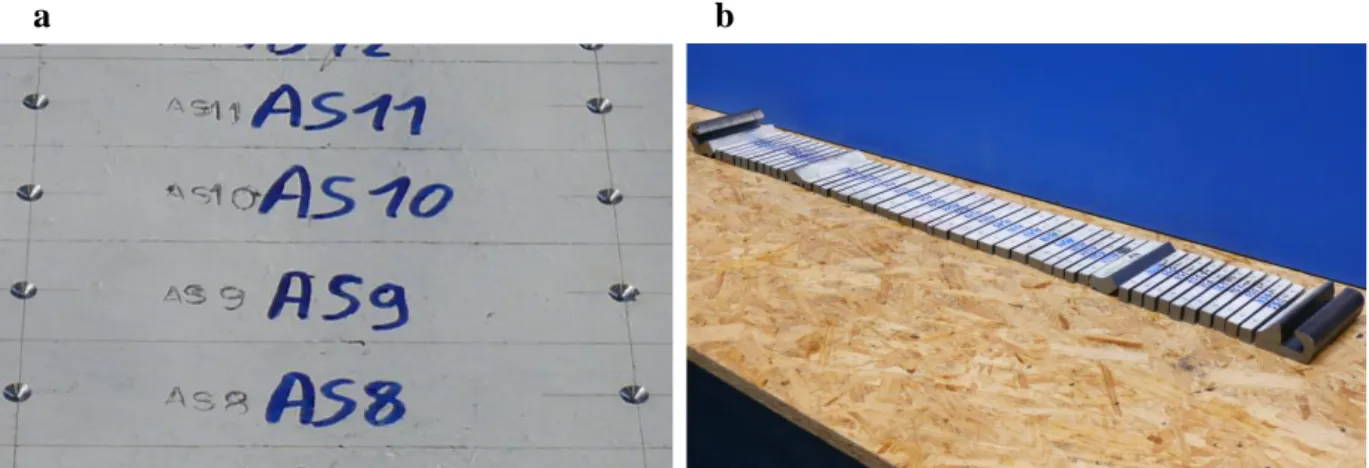
The surface is manually polished, painted with a white spray paint. A spike is used to draw the sample contours, with the length oriented in the longitudinal direction. Two small conical-spherical holes are drilled on each samples, on the upper and lower surfaces, with a 100 mm inter-distance (Fig. 10a), with a shape which correctly fits the edges of the extensometer.
The residual stresses of the tongues are considered to be fully released, or equilibrated, by the two transverse sections, separated by 140 mm, and by the longitudinal sections, providing 45 samples with a thickness of 14.2 or 19 mm and a width between 12 and 25 mm, depending on their positions (Fig. 10b). No cutting is done through the thickness because the stress variation is small in this direction, as indicated by numerical simulations. A saw and lubricant are used, at each step of cutting, to avoid machining stress.
Fig. 10. (a) Preparation of the sectioning method with small conical-spherical holes, (b) tongues obtained at the end of
the sectioning procedure.
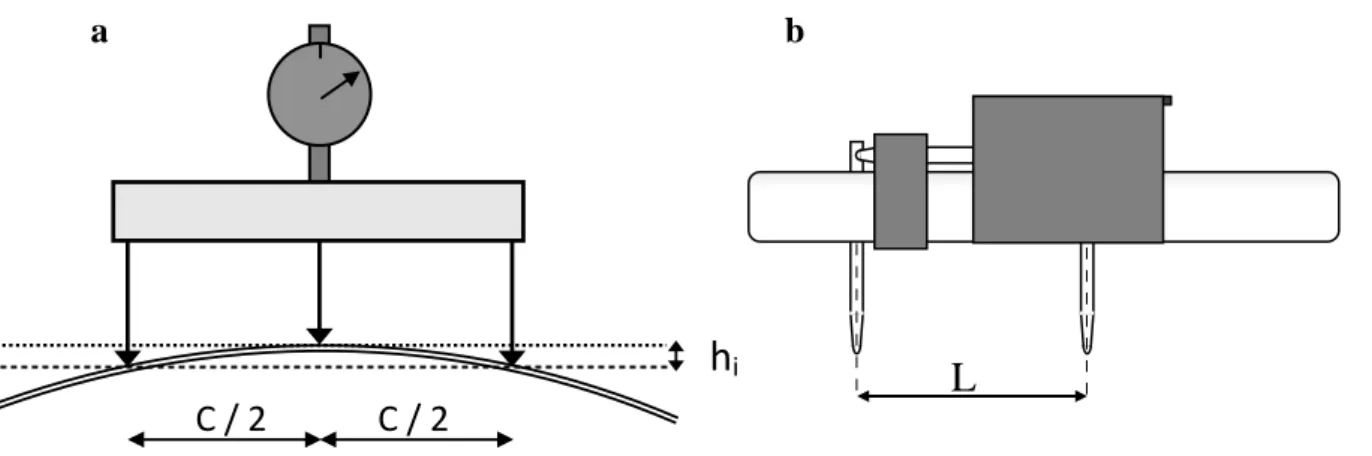
The deflections and lengths are measured on the upper and lower sides of each specimen, at the
13
initial state (hi,0, Li,0) and at the final state, after the separation of all the samples (hi,2, Li,2), using a
deflectometer (Fig. 11a), where C= 80 mm and an extensometer (Fig. 11b), where L= 100 mm. Some deformations were measured several times on the same sample. The reproducibility of the strain measurements was achieve unlike the deflection which was sensitive to the surface roughness. This point is discussed hereafter.
Fig. 11. Equipment used to measure the deformations due to sectioning: (a) deflectometer, (b) extensometer.
5.2. Results
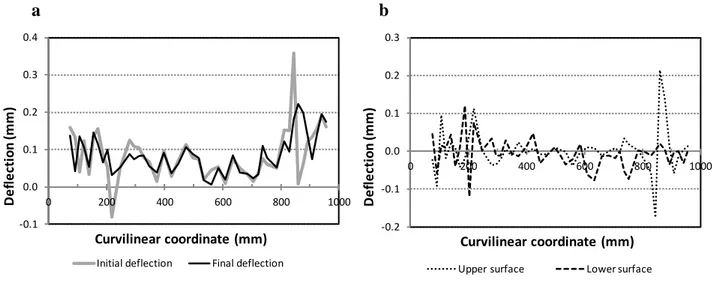
The deflection (hi,0 and hi,2) is very small ( 0.1 mm), clearly disturbed by the surface roughness and
positive on both sides due to an improved polishing near the zone where the small holes are drilled. The measurements performed on the upper surface, before and after the sectioning, are shown in Fig. 12a, where it is clear that the sectioning has almost no impact on the curvature of the pieces. This difference between hi,2 and hi,0 in the lower and in the upper surfaces, shown in Fig. 12b, indicates no
significant bending.
This statement is consistent with the numerical model where the stress state was almost homogeneous through the thickness resulting in membrane residual stresses only.
L
C / 2 C / 2hi
14
Fig. 12. (a) Deflections on the upper surface, before and after sectioning, (b) difference in the deflection before and after
sectioning the samples, on the upper and lower surfaces.
Fig. 13. (a) Membrane strain on the two surfaces & average strain in the sheet pile 2: after cooling, in the longitudinal
direction, (b) normalised longitudinal residual stress in the sheet pile 2: after cooling, in the longitudinal direction.
The longitudinal strains on both surfaces and an average curve are computed from the elongations of the samples (Fig. 13a).
An elastic law is used to compute the residual stresses from the average strains in the longitudinal direction only, neglecting the transverse strains, as classically done in case of long profiles. These transverse strains cannot be measured by this method but their low magnitudes was confirmed by the
a b a b -0.1 0.0 0.1 0.2 0.3 0.4 0 200 400 600 800 1000 D e fl e cti o n (m m ) Curvilinear coordinate (mm) Initial deflection Final deflection
-0.2 -0.1 0.0 0.1 0.2 0.3 0 200 400 600 800 1000 D e fl e cti o n (m m ) Curvilinear coordinate (mm) Upper surface Lower surface
0.00 0.00 0.00 0.00 0.00 0.00 0.00 0.00 0.00 0.00 0 200 400 600 800 1000 M e m b ra n e r e si d . str ai n Curvilinear coordinate (mm) Upper surface Lower surface Average
-0.4 -0.3 -0.2 -0.1 0.0 0.1 0.2 0.3 0.4 0.5 0 200 400 600 800 1000 Sta n d ar d s tr e ss Curvilinear coordinate (mm) σzz Web Flange
15
F.E. simulations and by the ring core measurements except near the connections between the flanges and the web where their levels are higher.
The stresses shown in Fig. 13b are normalised for confidential reasons. Three second order
polynomial curves help to visualize the stress distribution along the width of the flanges and the web separately.
6. Methods comparison
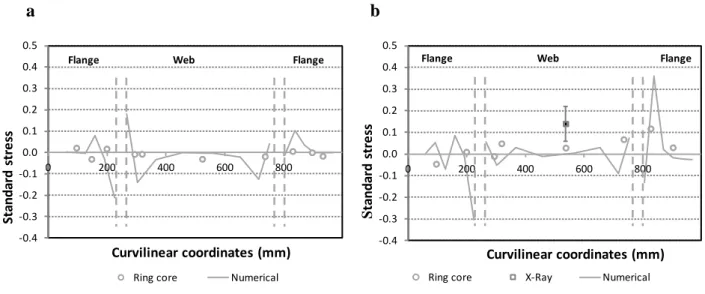
The residual stresses obtained by the three methods are compared with the numerical distribution along the width of the section, in Fig. 14 (transverse stresses) and in Fig. 15 (longitudinal stresses), respectively after cooling and after cooling and straightening.
For the different measurement techniques, both the magnitude and the distribution of the measures are in agreement. In addition, the consistency with the numerical predictions where the stresses are dominant in the longitudinal direction and where the stress distribution is definitely modified by the additional straightening was verified.
The dispersion of the stresses from the XRD method, after the cooling (Fig. 15a), can be explained by their high sensitivity to their position in the left flange where the stress variation is high. After the straightening, both the longitudinal and transverse stresses, measured by this method, are consistent with the levels predicted by the ring core method and the numerical simulation (Figs. 14b and 15b). The results of the ring core method are usually consistent except some measures which could not be verified (i.e.: Fig. 9b where standard stress= 0.88). Ideally, each measure should have been
performed at least twice to detect any experimental problem. This method is adapted to accurately predict the stresses because the stress state is almost homogeneous through the thickness.
The noise in the results of the sectioning technique can be due to imprecision in the manual measures of elongations. In addition, the lack of information about transverse strain induces errors, near the
16
connections between the web and flanges, where these deformations can be significant. However, the high number of measures enables to define an average curve with a realistic trend.
Difficulties to measure the initial temperature field, especially in the web-flange connections and in the interlocks, may induce inaccuracies in the stress levels of the numerical model and may explain the differences between the numerical and experimental stress levels. Moreover, in addition to
classical material property scattering, several industrial parameters are not perfectly reproducible: the ambient temperature, the relative positions of the other sheet piles during cooling, the duration of the cooling, the positions of the rollers in the straightening device adapted by the worker according to the initial curvature of each profile. These reasons explain why the numerical model with average industrial parameters may differ slightly from the pieces produced and studied in this research.
Fig. 14. Comparison between experimental and numerical transverse residual stresses: (a) in sheet pile SP2, after cooling,
(b) in sheet pile SP5, after cooling and straightening.
a b -0.4 -0.3 -0.2 -0.1 0.0 0.1 0.2 0.3 0.4 0.5 0 200 400 600 800 S ta n d ar d s tr e ss Curvilinear coordinates (mm) Ring core X-Ray Numerical
Flange Web Flange
-0.4 -0.3 -0.2 -0.1 0.0 0.1 0.2 0.3 0.4 0.5 0 200 400 600 800 Sta n d ar d s tr e ss Curvilinear coordinates (mm) Ring core Numerical
17
Fig. 15. Comparison between experimental and numerical longitudinal residual stresses: (a) in sheet pile SP2, after
cooling, (b) in sheet pile SP5, after cooling and straightening.
7. Conclusions
Three methods have been applied to provide the residual stress distributions in the sections of sheet piles. These stress fields are characterized by slight variation within the thickness, dominant
longitudinal stresses and peak stresses lower than the yield strength. The results of the three methods are quite close as both distribution and amplitude are consistent.
Only a limited number of measures are performed with the XRD method but it is clear that the portable equipment is adapted to the geometry of the pieces. The results are localised on a small region, at a near-surface depth of 10 μm only. An analysis on a deeper thickness would have imposed successive electrolytic polishing, up to max 500 μm. The advantage is the non destructivity of the procedure and the possibilities to measure small areas, near the surface. Its drawback is the cost of such equipment and its limitation to surface measurement without any scale if etching is not used. The ring core method applied in this research is a non incremental procedure, contrarily to the one often described in literature. The results (normal stresses in all directions) are usually accurate except some which were probably affected by experimental discrepancy and could not be verified because performed only once. The results, less localised than those from the XRD method, do not enable to
a b -0.4 -0.3 -0.2 -0.1 0.0 0.1 0.2 0.3 0.4 0.5 0 200 400 600 800 S ta n d ar d s tr e ss Curvilinear coordinates (mm) Ring core X-Ray Numerical
Web Flange -0.4 -0.3 -0.2 -0.1 0.0 0.1 0.2 0.3 0.4 0.5 0 200 400 600 800 Sta n d ar d s tr e ss Curvilinear coordinates (mm) Ring core Sectioning X-Ray Numerical
18
see local peaks because they are linked to the diameter of the small cylinders extracted, defining the measurement zone. The method is semi-destructive but the damage caused by the drilling of the cylinders makes it difficult to reuse the pieces if numerous measurements are performed.
The sectioning technique is based on the same assumptions than the ring core methods where the stresses are completely released by the cutting of the samples. Here, the elongations of the samples are manually measured with specific but simple equipment. Due to the size of the samples, it is mandatory to measure the length variation and the bending along the direction where the stresses are constant and dominant, neglecting the deformations in the other directions. The results show that the method is affected by noise. The numerical investigations show that the transverse stresses are not insignificant near the connections between the web and the flanges. The procedure is quite simple but completely destructive and surely time consuming.
The ring core method, which was the most widely tested on the pieces after the two processes, provides a stress distribution in agreement with the numerical models, both in the longitudinal and transverse directions indicating that this method is definitely well adapted to this kind of pieces.
Acknowledgments
The authors thank Luxinnovation for its help and the Luxembourg Ministry of Economy, the
Interuniversity Attraction Poles Program, Belgian Science Policy P7/21 and the FRS-FNRS for their financial supports. Max Verstraete and Michel Bechoux are acknowledged for their support during the ULg tests and Denis Bouscaud and Marc Wary for their help in the XRD measurements.
19
References
[1] Rossini NS , Dassisti M , Benyounis KY , Olabi AG. Methods of measuring residual stresses in components. Mater. Des 2012; 35: 572–588.
http://dx.doi.org/10.1016/j.matdes.2011.08.022.
[2] Hauk V. Structural and residual stress analysis by nondestructive methods. Elsevier Science B.V., Amsterdam 1997.
[3] Withers PJ, Turski M, Edwards L, Bouchard PJ, Buttle DJ. Recent advances in residual stress measurement. Int J Pres Ves Pip 2008; 85: 118-127. doi:10.1016/j.ijpvp.2007.10.007
[4] Quach WM, Teng JG, Chung KF. Finite element predictions of residual stresses in press-braked thin-walled steel sections. Eng Struct 2006; 28 (11): 1609-1619.
http://dx.doi.org/10.1016/j.engstruct.2006.02.013.
[5] Jandera M, Gardner L, Machacek J. Residual stresses in cold-rolled stainless steel hollow sections. J Constr Steel Res 2008; 64 (11): 1255-1263.
http://dx.doi.org/10.1016/j.jcsr.2008.07.022.
[6] Boman R, Ponthot JP. Continuous Roll Forming Simulation using Arbitrary Lagrangian Eulerian Formalism. Key Eng Mat 2011; 473: 564-571.
http://dx.doi.org/10.4028/www.scientific.net/KEM.473.564.
[7] Bouffioux C, Boman R, Caillet N, Rich N, Ponthot JP, Habraken AM. Effect of the
kinematic hardening in the simulations of the straightening of long rolled profiles. Key Eng Mat 2014; 611-612: 178-185. http://dx.doi.org/10.4028/www.scientific.net/KEM.611-612.178.
[8] Macherauch E, Müller P. Das sin2ψ-verfahren der röntgenographischen Spannungsmessung. Z. Angew Physik 1961; 13: 305-312.
[9] Inal K, Pesci R, Lebrun J L, Diard O, Masson R. Grain and phase stress criteria for behaviour and cleavage in duplex and bainitic steels. Fatigue Fract Eng M 2006; 29 (9-10): 685-696. http://dx.doi.org/10.1111/j.1460-2695.2006.01056.x.
[10] Ajovalasit A, Petrucci G, Zucarello B. Determination of Nonuniform Residual Stresses Using the Ring core Method. J Eng Mater Technol 1996; 118(2): 224-228.
http://dx.doi.org/10.1115/1.2804891
[11] Masláková K, Trebuna F, Frankovský P, Binda M. Applications of the strain gauge for determination of residual stresses using ring core method. Proc Eng 2012; 48: 396 – 401. http://dx.doi.org/10.1016/j.proeng.2012.09.531.
20
[12] Šarga P, Menda F. Comparison of Ring core Method and Hole-drilling Method Used for Determining Residual Stresses. American Journal of Mechanical Engineering 2013; 1 (7): 335-338. DOI: 10.12691/ajme-1-7-36. http://pubs.sciepub.com/ajme/1/7/36/
[13] Spoorenberg RC, Snijder HH, Hoenderkamp JCD. Experimental investigation of residual stresses in roller bent wide flange steel sections. J Constr Steel Res 2010; 66 (6): 737-747. http://dx.doi.org/10.1016/j.jcsr.2010.01.017.
[14] Cruise RB, Gardner L. Residual stress analysis of structural stainless steel sections. J Constr Steel Res 2008; 64 (3): 352–366. http://dx.doi.org/10.1016/j.jcsr.2007.08.001.
[15] Yuan HX, Wang YQ, Shi YJ, Gardner L. Residual stress distributions in welded stainless steel sections. Thin-Walled Struct 2014; 79: 38-51.