Stochastic Targeted (STAR) Glycemic Control – Design, Safety
and Performance
Alicia Evans1, BEng; Aaron Le Compte1, PhD; Chia-Siong Tan1, BEng; Logan Ward1, BEng; James Steel1, BEng; Christopher G Pretty1, ME; Sophie Penning2, MS; Fatnah Suhaimi1, BE; Geoffrey M Shaw3, MBChB; Thomas Desaive2, PhD; J. Geoffrey Chase1,
PhD
1
Department of Mechanical Engineering, Centre for Bio-Engineering, University of Canterbury, Christchurch, New Zealand
2
Cardiovascular Research Centre, University of Liege, Liege, Belgium
3
Department of Intensive Care, Christchurch Hospital, Christchurch School of Medicine, University of Otago, Christchurch, New Zealand
Work performed at:
- Christchurch Hospital, Christchurch, NZ
- Dept of Mechanical Engineering, Centre for Bio-Engineering, Univ of Canterbury - University of Liege, Liege, Belgium
Address for Reprints: Available from Corresponding Author: Prof J. Geoffrey Chase,
Department of Mechanical Engineering University of Canterbury,
Private Bag 4800 Christchurch New Zealand
Email: [email protected]
Financial Support: New Zealand Tertiary Education Commission, Government of Malaysia, Fonds Nationale Recherche Scientifique (FNRS).
Keywords: critical care, glycemic control, ICU, intensive care, intensive insulin therapy, STAR, Stochastic, Targeted, SPRINT, TGC
Disclosure and Conflict of Interest: None Acknowledgements: None
List of Abbreviations / Acronyms:
Acute Physiology and Chronic Health Evaluation II (APACHE II) American College of Chest Physicians (ACCP)
Cumulative Distribution Function (CDF) Intensive Care Unit (ICU)
Inter-Quartile Range (IQR) Length of Stay (LoS)
Society of Critical Care Medicine (SCCM)
Specialised Relative Insulin Nutrition Titration (SPRINT) Stochastic Targeted (STAR)
ABSTRACT:
Introduction: Tight glycemic control (TGC) has shown benefits, but been difficult to achieve consistently. STAR (Stochastic TARgeted) is a flexible, model-based TGC approach that directly accounts for intra- and inter- patient variability with a stochastically derived maximum 5% risk of blood glucose (BG) below 72mg/dL. This research assesses the safety, efficacy and clinical burden of a STAR TGC controller modulating both insulin and nutrition inputs in virtual and clinical pilot trials.
Method: Clinically validated virtual trials using data from 370 patients in the SPRINT (Specialised Relative Insulin and Nutrition Titration) study are used to design the STAR protocol and test its safety, performance and required clinical effort prior to clinical pilot trials. Insulin and nutrition interventions are given 1-3 hourly as chosen by the nurse to allow them to manage workload.
Interventions are designed to maximize the overlap of the model-predicted (5-95th percentile) range of BG outcomes with the 72-117mg/dL band, and thus provide a maximum 5% risk of BG<72mg/dL. Interventions are calculated using clinically validated computer models of human metabolism and its variability in critical illness. Carbohydrate intake (all sources) was selected to maximize intake up to 100% of SCCM/ACCP goal (25kg/kcal/hour). Insulin doses were limited (8U/hour maximum), with limited increases based on current rate (0.5-2.0U/hour). Initial clinical pilot trials comprised 3 patients covering ~450 hours. Approval was granted by the Upper South A Regional Ethics Committee.
Results: Virtual trials indicate that STAR provides similar glycemic control performance to SPRINT with 2-3 hourly (maximum) measurement intervals. Time in 72-126 mg/dL and 72-145mg/dL bands was equivalent for all controllers, indicating that glycemic outcome differences between protocols were only shifted in this range. Safety from hypoglycemia was improved. Importantly, STAR using 2-3 hour (maximum) intervention intervals reduced clinical burden up to 30%, which is clinically very significant. Initial clinical trials showed glycemic performance, safety, and management of inter- and intra- patient variability that matched or exceeded the virtual trial results.
Conclusion: In virtual trials, STAR TGC provided tight control that maximised the likelihood of BG in a clinically specified glycemic band and reduced hypoglycemia with a maximum 5% (or lower) expected risk of light hypoglycemia (BG < 72 mg/dL) via model-based management of intra- and inter- patient variability. Clinical workload is self-managed and reduced up to 30% compared to SPRINT. Initial pilot clinical trials matched or exceeded these virtual results.
1.0 Introduction
Critically ill patients often experience stress-induced hyperglycemia and high levels of insulin resistance [1-7]. The occurrence of hyperglycemia, particularly severe hyperglycemia, is associated with increased morbidity and mortality in this group of patients [1, 3]. Glycemic variability, and thus poor control, are also independently associated with increased mortality [8, 9]. It has been shown that tight glycemic control (TGC) can significantly reduce the rate of negative outcomes associated with poor control by modulating nutrition and/or insulin administration [7, 10, 11], including reducing the rate and severity of organ failure [12] and cost [13, 14]. However, consistent, effective TGC remains elusive with several studies achieving positive negative and inconclusive outcomes [15-18]. In addition, there is a little agreement on what constitutes desirable glycemic performance [19-21], particularly with regard to how TGC affects outcome.
The SPRINT protocol was successful at reducing organ failure and mortality [10, 12], with a patient-specific approach that directly considered carbohydrate administration along with insulin. It provided the tightest control across all patients of several large studies [22, 23], via its patient-specific approach to accounting for inter- and intra- patient variability. However, the protocol is also relatively inflexible, and the clinical burden, while acceptable, was higher than desired.
In particular, SPRINT has a fixed, implicit target glycemia of 90-110 mg/dL that could not be altered for specific clinical needs or more dynamic patients. Equally, the approach to control was fixed, titrating both insulin and nutrition with respect to the overall patient-specific insulin sensitivity evidenced in their glycemic response to the prior intervention.
Thus, approaches that preferred greater or lesser carbohydrate or insulin administration than SPRINT would recommend, or different combinations parenteral vs enteral nutrition administration routes, were not possible due to its model-derived, paper-based implementation [24-26]. In addition, its inability to forecast a range of outcomes to an intervention required more frequent 1-2 hourly measurement intervals to ensure tight control when it was not always necessary [24]. The choice of measurement interval was not free, and was specified as part of the protocol increasing perceived effort due to its inflexible approach.
This paper presents a model-based TGC protocol that ameliorates or eliminates all these issues. Model-based, it uses stochastic models [27, 28] to forecast the range of glycemic outcomes for a given intervention, providing greater certainty over longer measurement intervals. It can thus target a desired range and, unique to this stochastic targeted (STAR) approach, provide a guaranteed, cohort-wide level of risk for hypo- or hyper- glycemia to enhance control and optimise risk. This risk level can be clinically set and thus provide a much better measure of clinical control over the risk of hypo- and/or hyper- glycemia [29]. The STAR framework presented is also more flexible as glycemic target ranges and risk of hypo- or hyper- glycemia can all be clinically specified to meet local criteria without adjusting the overall STAR approach. This research presents the (clinically validated [30]) virtual trials protocol design and optimisation for an adult ICU cohort, its comparison to SPRINT clinical data, and three initial clinical pilot trial results covering ~450 hours of TGC.
2.0 Methods
2.1 Model and Virtual Trials:
Virtual trials enable the testing of new TGC protocols before clinical implementation. It is a safe means of optimising glycemic control performance, safety from hypoglycemia, clinical burden, and the ability to handle dynamic changes in patient metabolic state or other unanticipated errors or affects, prior to clinical implementation [24, 30, 31]. The metabolic system model used is defined:
̇ ( ) (1) ̇ (2) ̇ ( ) ( ( ) ) (3) Where: ( ) ( ) (4) ̇ ( ) (5) ̇ ( ) (6)
Where all model parameters are described in Table 1, including values for the population constants employed.
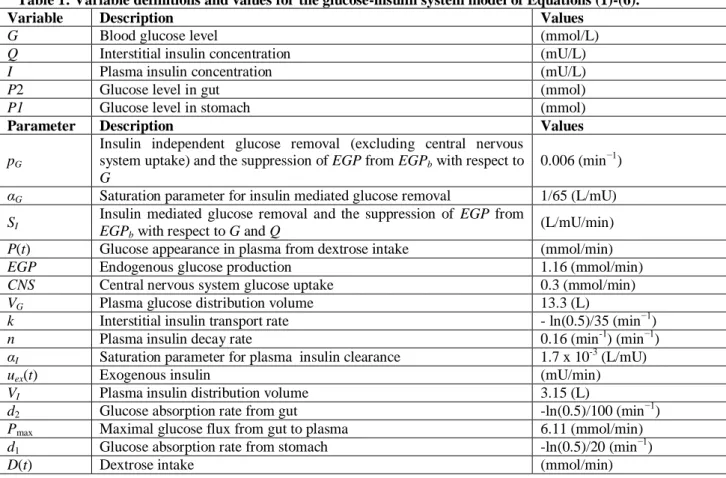
Table 1: Variable definitions and values for the glucose-insulin system model of Equations (1)-(6).
Variable Description Values
G Blood glucose level (mmol/L)
Q Interstitial insulin concentration (mU/L)
I Plasma insulin concentration (mU/L)
P2 Glucose level in gut (mmol)
P1 Glucose level in stomach (mmol)
Parameter Description Values
pG
Insulin independent glucose removal (excluding central nervous system uptake) and the suppression of EGP from EGPb with respect to G
0.006 (min−1)
αG Saturation parameter for insulin mediated glucose removal 1/65 (L/mU) SI
Insulin mediated glucose removal and the suppression of EGP from
EGPb with respect to G and Q (L/mU/min) P(t) Glucose appearance in plasma from dextrose intake (mmol/min)
EGP Endogenous glucose production 1.16 (mmol/min)
CNS Central nervous system glucose uptake 0.3 (mmol/min)
VG Plasma glucose distribution volume 13.3 (L)
k Interstitial insulin transport rate - ln(0.5)/35 (min−1)
n Plasma insulin decay rate 0.16 (min-1) (min−1)
αI Saturation parameter for plasma insulin clearance 1.7 x 10⁻³ (L/mU) uex(t) Exogenous insulin (mU/min) VI Plasma insulin distribution volume 3.15 (L)
d2 Glucose absorption rate from gut -ln(0.5)/100 (min−1) Pmax Maximal glucose flux from gut to plasma 6.11 (mmol/min) d1 Glucose absorption rate from stomach -ln(0.5)/20 (min−1)
D(t) Dextrose intake (mmol/min)
Time-varying insulin sensitivity profiles (SI(t)), created from the patient data [32], are
used as the critical marker of a patient’s metabolic state [28, 30, 31], and are identified hourly from clinical data [32]. This model-based insulin sensitivity metric has been shown to be independent of both the insulin and nutrition inputs used to derive it, and has been clinically validated in its ability to predict the median and variability of both cohorts and individual patients on matched cohorts treated with different TGC protocols [30].
Hence, these virtual patients can be used to accurately predict the outcome of new protocol designs and intervention strategies prior to clinical implementation. This approach allows more robust protocols to be designed and rigorously tested, which can improve patient safety when implemented, as well as minimise the need for protocol alterations after implementation to account for unforeseen uses or effects.
2.2 Virtual Patients and Clinical Data:
Clinical data from 370 patients reported in SPRINT [10] was used to create virtual patients. They thus represent the SPRINT cohort, as reported, to which STAR protocol results will be compared. Table 2 summarises these patients clinical data and much more specific information is available in [10, 12].
Table 2: SPRINT patient cohort clinical data and glycemic control summary. APACHE = Acute
Physiology And Chronic Health Evaluation; BG = Blood Glucose (level); IQR = Inter-Quartile Range; LoS = Length of Stay; and SD = Standard Deviation. Further details are in [10, 12].
Patient Data
Total patients 370
Age (years) 65 [49 – 74]
% Male 63.6%
APACHE II score 18 [15 – 24] APACHE II risk of death 25.7% [13.1% - 49.4%] Diabetic history 62 (16.7%) LoS [median, IQR] (days) 4.1 [1.7 – 10.4]
APACHE III Diagnosis
Operative Num. patients % Cardiovascular 76 20% Respiratory 9 2% Gastrointestinal 60 16% Neurological 7 2% Trauma 14 4%
Other (Renal, metabolic, orthopaedic) 4 1%
Non-Operative Num. patients % Cardiovascular 39 11% Respiratory 66 18% Gastrointestinal 10 3% Neurological 20 5% Trauma 32 9% Sepsis 17 5%
Other (Renal, metabolic, orthopaedic) 17 5%
2.3 Stochastic Model and Glycemic Control:
The Stochastic Targeted (STAR) TGC protocol recommends insulin and nutrition interventions based on recent patient data, predicted blood glucose response to a particular intervention, and a stochastic model [27, 28] of the potential variability in SI(t)
over the following 1-3 hours. The stochastic models and their use in TGC are presented in detail in [27, 28, 33, 34]. However, these models capture the potential variation of (patient-specific) insulin sensitivity (SI(t)) over the next 1, 2 or 3 hours based on a cohort
model. While the median and most likely variation is no significant change from the prior hour, the IQR and (5th, 95th) percentile variations can result in significant changes in BG for a given insulin intervention. Figure 1 shows this stochastic model and (schematically) its impact on BG outcome for a given intervention.
Figure 1: Stochastic model (left) can be used with an identified current level of SI(t) to
provide a forecast range of SI(t) values over the next 1-3 hour interval. This forecast range
of values can be used with a given insulin intervention and the system model of Equations (1)-(6) to yield a range of BG outcomes of differing likelihood. Note that the stochastic model shown is for a 1-hour interval, the 2-3 hour interval models are very similar but not shown here. More details are in [27, 28].
2.4 STAR Approach – Maximum Likelihood, Target to Range and Maximum Risk: The STAR approach explicitly targets the (5th - 95th) percentile outcomes shown in Figure 1 to specific, clinically chosen target levels. Thus, it targets ranges rather than any specific value, a “Target to Range” approach. The 5th
percentile is never allowed to be lower than 72-80 mg/dL, providing a cohort-wide guaranteed (maximum) risk of 5% for
Insulin sensitivity
Blood glucose
tnow
Stochastic model shows the bounds (5th– 95thpercentile)
for insulin sensitivity variation over next 1-3 hours from the initially identified level
For a given feed+insulin intevention an output BG distribution can be forecast using the model
tnow+(1-3)hr 95th 75th 50th 25th 5th 5th 25th 50th 75th 95th
Stochastic model shows the (5th, 25th, 50th = median, 75th and 95th) percentile bounds for insulin sensitivity (SI(t)) variation over the
next time interval from the currently identified value.
For a given insulin intervention, an output BG distribution is forecast using the system model
BG below these values for any intervention. Importantly, this level can be clinically specified and be different for different measurement intervals.
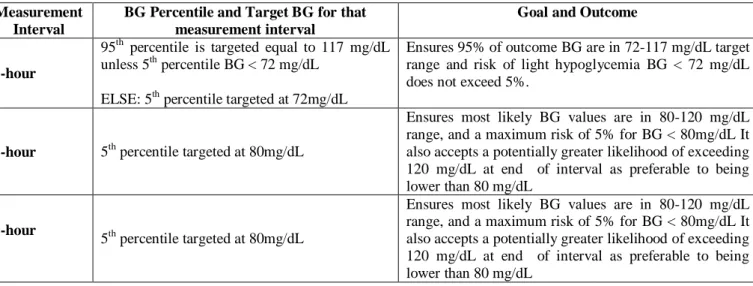
For every intervention, the nurses have a free choice of measurement interval of 1, 2 or 3 hours when BG is in the 72-117 mg/dL range, provided there is no forecasted risk of low blood glucose. Outside this range targeting and measurement interval are restricted to 1 hour for patient safety. Table 3 shows the target to range approach clinically specified in this case. The overall goal is a target range of 72-120 mg/dL with most measurements desired in the 80-120 mg/dL range. Safety is preferred with a maximum expected risk of 5% for low BG rising from a threshold of 72 mg/dL at 1-hourly measurement to 80mg/dL at 2-3 hourly intervals.
Table 3: STAR BG target ranges and approach for BG in the 72-135 mg/dL range Measurement
Interval
BG Percentile and Target BG for that measurement interval
Goal and Outcome
1-hour
95th percentile is targeted equal to 117 mg/dL unless 5th percentile BG < 72 mg/dL
ELSE: 5th percentile targeted at 72mg/dL
Ensures 95% of outcome BG are in 72-117 mg/dL target range and risk of light hypoglycemia BG < 72 mg/dL does not exceed 5%.
2-hour 5th percentile targeted at 80mg/dL
Ensures most likely BG values are in 80-120 mg/dL range, and a maximum risk of 5% for BG < 80mg/dL It also accepts a potentially greater likelihood of exceeding 120 mg/dL at end of interval as preferable to being lower than 80 mg/dL
3-hour
5th percentile targeted at 80mg/dL
Ensures most likely BG values are in 80-120 mg/dL range, and a maximum risk of 5% for BG < 80mg/dL It also accepts a potentially greater likelihood of exceeding 120 mg/dL at end of interval as preferable to being lower than 80 mg/dL
The specific insulin and nutrition interventions are optimised using the system model of Equations (1)-(6) and the stochastic models. More specifically, they are dosed in increments with a maximum allowed change from the prior intervention, defined:
Insulin: 0.0-6.0 U/hour in increments of 0.5U excluding 0.5U/hour. o Maximum Change: +3U/hour or down to 0 U/hour
Nutrition: 30-100% of ACCP/SCCM goal feed of 25kcal/kg/day [35, 36] in increments of 5%, using a low carbohydrate enteral nutrition formula (local clinical standard) of 35-40% carbohydrate content. Nutrition may be turned off for other clinical reasons (0%) leaving only insulin as an intervention.
o Maximum Change: 20% for a given intervention interval, typically altered every 3-5 hours to reduce workload.
The maximum changes of 20% (of goal feed) in nutrition rate, and +3 U/hour increase in insulin are set, with an unlimited insulin decrease to 0 U/hour allowed, for any given intervention period. These limits provide robustness to clinically observed sensor assay errors or failure. Thus, any sudden hyperglycemia will only be gradually reduced. If parenteral nutrition is specified, the value is set by the clinician and taken into account during all calculations. Thus, nutrition is modulated in the same percentages based on all sources administration.
More specifically, at each measurement, the algorithm searches over all feasible solutions within these intervention constraints. If no feasible solution is available for a 2-3 hour interval the 5th percentile is set on a value over 80 mg/dL within these limits. If both interventions are changing, then the protocol selects the feasible option with greatest nutrition administration, a choice that was clinically specified.
An additional 1 U/hour insulin infusion is recommended if the limits of nutrition and insulin are unable to adequately ensure avoidance of hyperglycemia, based on meeting the following conditions:
Insulin administered at rate ≥ 5 U/hour for the past 3 hours
The infusion is sustained for 6 hours and accounted in all subsequent calculations, unless enteral or parenteral feed is stopped or blood glucose is decreasing rapidly.
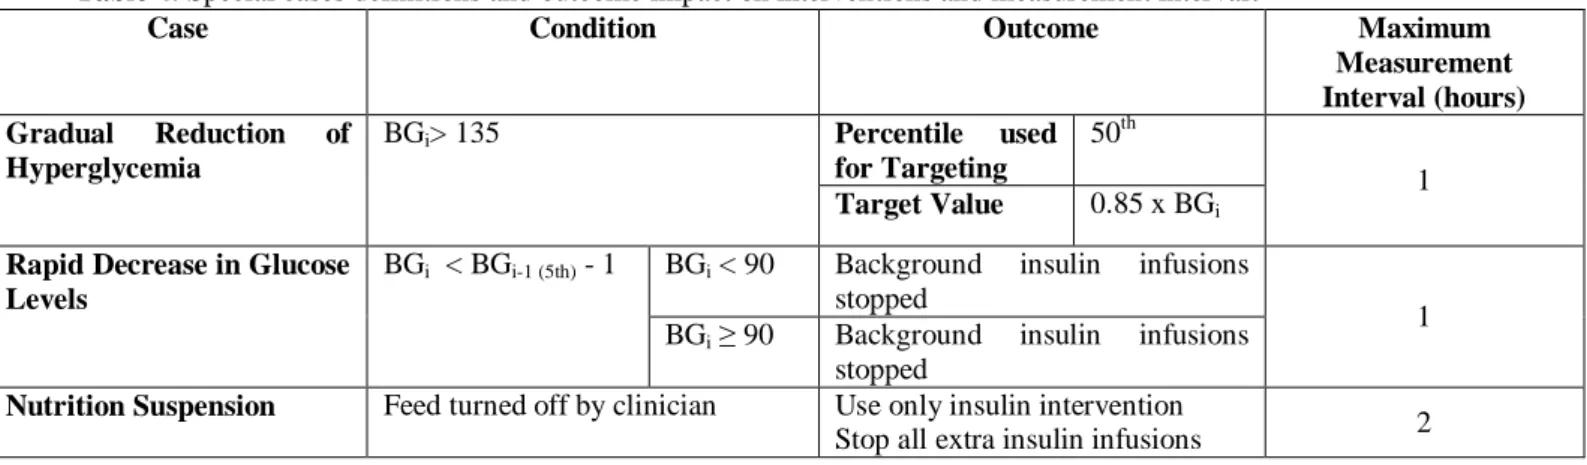
Finally, there are three special cases for which measurement intervals are restricted to 1 and/or 2 hourly and interventions modified, defined:
Gradual Reduction of Hyperglycemia: BG > 135 mg/dL (level set by clinician) Rapid Decrease in BG: BG is more than 18 mg/dL lower than the predicted 5th
percentile BG output, signifying very rapid change outside of forecast ranges and towards hypoglycemia
Nutrition Suspension: When nutrition administration is turned off for clinical reasons the risk of hypoglycemia can rise for a given insulin dose.
Each case represents a significant risk to patient safety where insulin can be dosed excessively in other protocols. The computerised system automatically detects these situations and offers only the relevant options. Table 4 summarises these cases and the resulting intervention and measurement interval.
Table 4: Special cases definitions and outcome impact on interventions and measurement interval.
Case Condition Outcome Maximum
Measurement Interval (hours) Gradual Reduction of Hyperglycemia BGi> 135 Percentile used for Targeting 50th 1 Target Value 0.85 x BGi
Rapid Decrease in Glucose Levels
BGi < BGi-1 (5th) - 1 BGi < 90 Background insulin infusions
stopped
1 BGi ≥ 90 Background insulin infusions
stopped
Nutrition Suspension Feed turned off by clinician Use only insulin intervention
2.5 Analyses:
Results from virtual trials of STAR were compared with clinical data from patients treated with SPRINT in the Christchurch ICU. Statistics were collated for 3 versions or clinical uses of STAR:
Measurement interval limited to 1 hour – Best Case
Measurement interval limited to 2 hours (when available) – Intermediate Case Measurement interval not limited (up to 3 hours) and longest available selected –
Minimum Clinical Effort Case
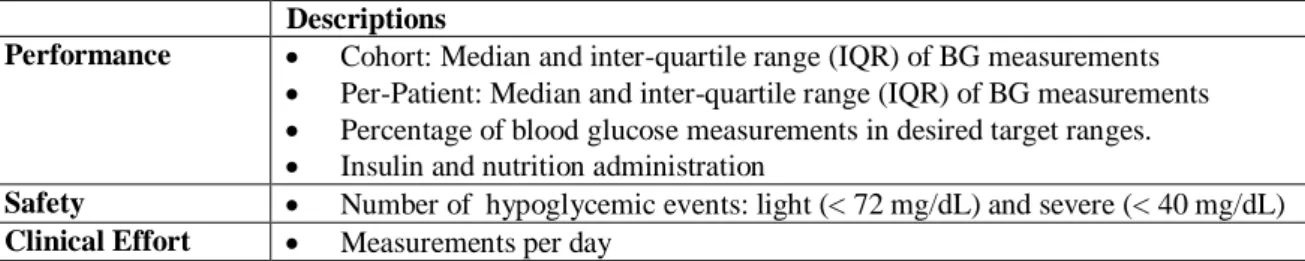
The 2 hour limited interval (Intermediate) case is the best comparator to the clinical SPRINT data [10] given similar measurement intervals. Table 5 defines the performance metrics used to assess performance, safety and clinical effort.
Table 5: Metrics to assess performance, safety and clinical effort Descriptions
Performance Cohort: Median and inter-quartile range (IQR) of BG measurements
Per-Patient: Median and inter-quartile range (IQR) of BG measurements
Percentage of blood glucose measurements in desired target ranges.
Insulin and nutrition administration
Safety Number of hypoglycemic events: light (< 72 mg/dL) and severe (< 40 mg/dL)
Clinical Effort Measurements per day
In addition, SPRINT and STAR are compared by the distributions, across the same cohort, of insulin and nutrition interventions to assess how differently the outcomes are achieved by each protocol.
2.6 Clinical Implementation:
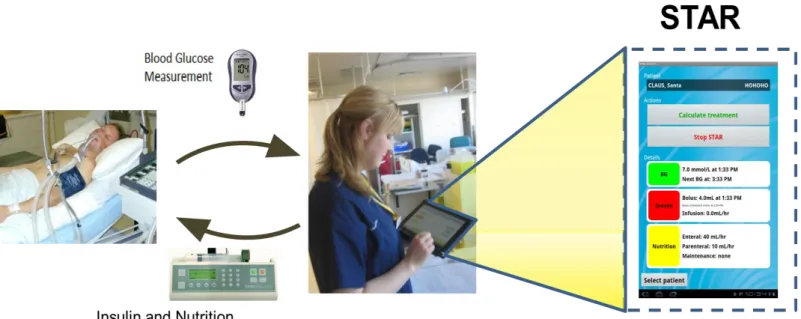
Clinical implementation of STAR is straightforward and illustrated in Figure 2. In particular, a BG measurement is taken, and that value input to a table computer, laptop or other device. The model then computes 1, 2 and 3 hourly treatment options as defined in prior sections. Finally, the nurse must input the chosen recommendation to the insulin and nutrition pumps, as necessary. This semi-automated, human-in-the-loop approach
improves safety, as advice can be examined or changed if desired, and avoids having to modify regulated equipment for full automation. The user interface and human factors are described in Ward et al [37, 38].
Figure 2: Schematic of clinical use of semi-automated and model-based STAR system on a tablet computer where the example screen shows the current STAR treatment and last BG measurement (right side). The arrows indicate nursing staff interaction with sensors and pumps in semi-automated human-in-the-loop control.
2.7 Clinical Pilot Trials:
Initial pilot clinical trials results are presented from 3 initial patients (479 hours) in an ongoing, larger pilot trial, as a proof of concept. These patients were recruited under informed consent based on treatment using SPRINT, the current standard of care at Christchurch Hospital. Ethics approval for this pilot study was granted by the Upper South A Regional Ethics Committee.
3.0 Results
3.1 Performance:
Table 6 shows STAR has similar or better performance than SPRINT. All BG results are resampled hourly with linear interpolation to provide a consistent timing basis across protocols with different prescribed measurement rates. The comparatively higher rate of measurements in the 90 – 117 mg/dL band reflects the higher range of 117mg/dL versus 110mg/dL in SPRINT. The percentage of measurements recorded in the target band (72 – 117 mg/dL) decreases with longer measurement intervals as more flexible control is permitted. Comparing the 2-hour version of STAR with SPRINT, shows SPRINT achieves slightly higher percentages in the 72-117mg/dL range, but are similar across the other ranges. The 3-hour interval case has slightly wider control towards slightly higher glycemia, as expected by design. Notably, in the 72-145mg/dL range all protocols are largely equivalent.
These glycemic outcomes in Table 6 were obtained using wider ranges of per-patient insulin and nutrition administration rates. Higher enteral nutrition rates in STAR are directly proportional to the overall enteral nutrition given as a single, fixed composition (Glucerna, Abbott Labs) nutritional formula was used, and were offset in part by the virtual trials, like SPRINT, providing no nutrition where clinically specified in the data. Hence, the 0% feeding over all patients includes several short stay cardiovascular surgery patients (and others) who were not fed by clinical decision. When only periods of feeding are included, the results are consistent. In particular, the lower quartile per-patient median dextrose administration rates (during nutrition administration) were 40-54% higher for STAR than for SPRINT, while the upper quartile value was similar to 20% higher. Note
that SPRINT had a maximum nutrition rate of 80% of goal ACCP/SCCM goal rate, where as STAR is limited to 100%.
Table 6: Summary of performance. The SPRINT raw data and closest comparator (STAR 2-hourly) are
shaded to show this comparison. Note that in virtual trials patients were not given nutrition when clinically specified in the raw data to match the clinical situation in the SPRINT data. The nutrition is shown twice for all patients and hours and then only including times when nutrition was allowed.
STAR 1 hour intervals STAR 2 hour intervals STAR 3 hour intervals SPRINT BG median [IQR] (mg/dL) 97 [90 - 110] 99 [90 - 114] 106 [95 - 119] 104 [90 - 117] %BG in 72–117 mg/dL 80.6 77.8 71.1 73.6 %BG in 72-126 mg/dL 86.0 84.4 81.2 82.4 %BG in 72-145 mg/dL 92.4 91.8 90.9 90.8
Median insulin rate [IQR] (U/hr) 2.5 [1.3 – 4.0] 2.0 [1.0 – 3.3] 2.0 [1.0 – 3.0] 3.0 [2.0 - 3.0]
Nutrition over all Patients:
Median dextrose rate [IQR] (g/hr) 3.3 [0.0 – 4.5] 3.1 [0.0 – 4.6] 3.6 [0.0 – 5.2] 2.3 [0.0 – 4.7]
Median glucose rate [IQR] (% goal) 51%
[0% - 70%] 48% [0% - 72%] 56% [0% - 80%] 35% [0% - 72%]
Nutrition only during feeding:
Median dextrose rate [IQR] (g/hr) 4.0 [3.1 - 5.1] 3.9 [3.1 - 5.1] 4.7 [3.5 - 6.1] 3.9 [2.3 - 5.2]
Median glucose rate [IQR] (% goal) 63%
[49% - 80%] 62% [48% - 80%] 73% [54% - 96%] 60% [35% - 80%]
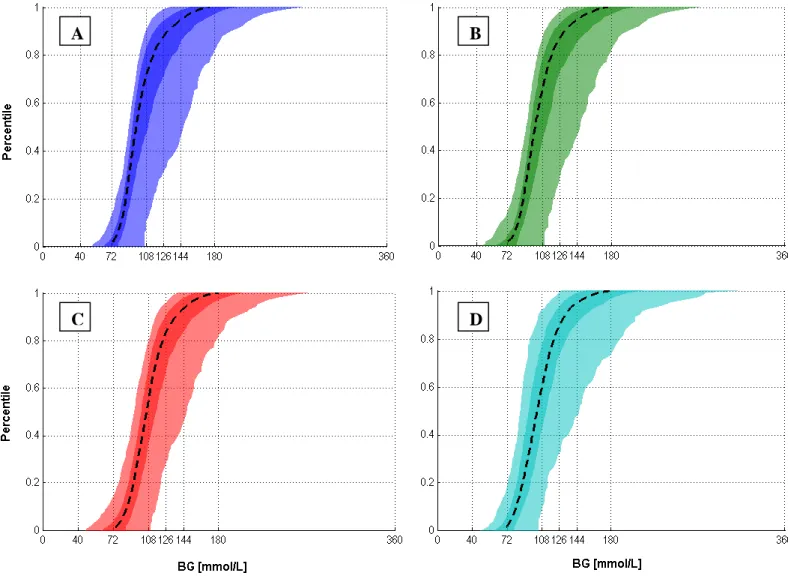
Figure 3 shows the per-patient BG cumulative distribution function (CDFs) for each case. STAR provided tighter control across all patients for each case than SPRINT. It did so using more insulin and a wider range of insulin administration rates, while also providing greater nutritional input. Hence, the model-based approach delivered better patient-specific management of intra- and inter- patient variability.
Figure 3: BG cumulative distribution functions (CDFs) of median, IQR and 5th – 95th percentile patients for the SPRINT and STAR protocols. (A) STAR 1 hour; (B) STAR 2 hour; (C) STAR 3 hour; and (D) SPRINT.
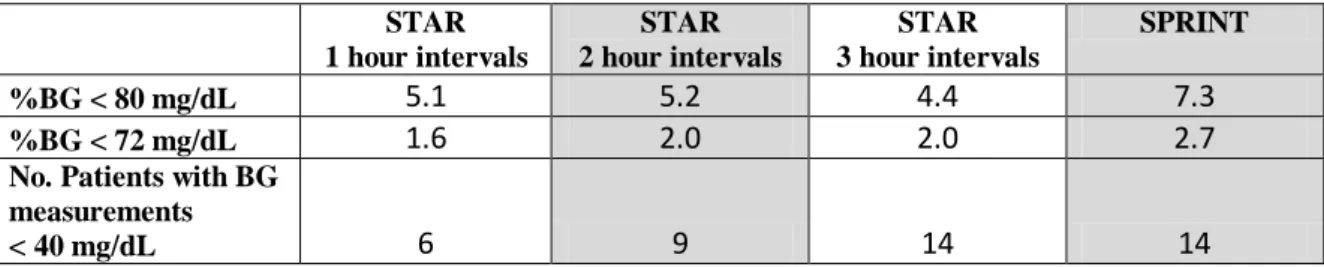
3.2 Safety:
Table 7 indicates that STAR effectively reduces hypoglycemia. Absolute (relative) reductions of 1.1% (41%), 0.7% (26%) and 0.7% (26%) can be seen in the percentage of light hypoglycemia assessed as percentage of BG < 72mg/dL for STAR 1, 2 and 3 hour maximum measurement intervals, respectively. There are similar results for BG < 80mg/dL (range: 2.1-2.9% absolute (28-40% relative)). Severe hypoglycemia (BG < 40 mg/dL) was unchanged for the 3-hourly maximum interval, but was significantly reduced by 5 patients for the best comparator 2-hourly case (35%) and to 6 for the 1-hourly best
A B
case (57%), which, despite improvement with STAR, still shows a (decreased) association between measurement interval and hypoglycemia.
Table 7: Summary of safety results STAR 1 hour intervals STAR 2 hour intervals STAR 3 hour intervals SPRINT %BG < 80 mg/dL 5.1 5.2 4.4 7.3 %BG < 72 mg/dL 1.6 2.0 2.0 2.7
No. Patients with BG measurements
< 40 mg/dL 6 9 14 14
3.3 Clinical Effort:
Table 8 shows the measurements per day, which are a main source of clinical effort. STAR reduces the average per day by 13.3% and 30.0% for the 2-3 hourly interval cases. These reductions are higher in longer stay patients.
Table 8: Summary of clinical effort as measurements per day STAR 1 hour intervals STAR 2 hour intervals STAR 3 hour intervals SPRINT
Average Measures / day 24 13 10.5 15
3.4 TGC Intervention Comparisons (SPRINT vs STAR):
Figure 4 compares the intervention choices made for STAR 2-hourly and SPRINT, the most directly comparable protocols as SPRINT only offered 2-hourly maximum measurements based on a series of rules to determine patient stability [10, 24, 25]. It is clear that STAR provides significantly more hours at higher goal feed rates than SPRINT. Equally, STAR makes far wider use of the range of insulin interventions. This result occurs because STAR tends to modulate insulin more dynamically around a narrower range of nutrition rates, where, in contrast, SPRINT tends to provide relatively constant insulin rates of 2-3 U/hour and modulate the nutrition rates more dynamically over the possible range. Thus, it is clear that STAR and SPRINT have very different approaches to
TGC with respect to these two interventions, from which STAR achieves similar or improved performance, safety and clinical burden outcomes in Tables 6-8.
Figure 4: Distribution of insulin and nutrition interventions for STAR 2-hourly (left) and SPRINT (right), where SPRINT does not offer 0.5U/hour interventions (e.g. 1.5, 2.5... 5.5 U/hour), which are shown as having zero counts of occurrence.
3.5 Pilot Clinical Trial Results:
Figures 5 show the glycemic (top panel) and intervention (bottom panel) results for each of the 3 patients in the clinical pilot trial (Patients A, B and C), comprising 479 hours of TGC. The overall median [IQR] BG is 104 [90-122] mg/dL. The percentage of clinical measurements in relevant bands is: %BG < 72: 5.4%; %BG in 72-117mg/dL: 64%; and %BG in 72-144mg/dL: 88%. These results are comparable to or better than those in Table 6. The lowest BG was 52 mg/dL.
0 1 2 3 4 5 6 30 40 50 60 70 80 90 100 0 500 1000 1500 Insulin (U/hr) STAR (2 Hour)
Percentage goal feed (%)
C o u n t 0 1 2 3 4 5 6 30 40 50 60 70 80 90 100 0 500 1000 1500 Insulin (U/hr) SPRINT
Percentage goal feed (%)
C
o
u
n
Figure 5: Patients A (top), B (middle) and C (bottom) showing BG (upper panel of each pair), and the insulin and nutrition interventions (lower panel of each pair) results on similar axes. The straight lines on the BG results are at 72 and 125 mg/dL. Vertical lines show insulin boluses (left axis, lower panels) and nutrition is on the right axis in (g/hour) of those lower panels.
Patient A
Patient B
4.0 Discussion
STAR is a unique, model-based TGC protocol that uses clinically validated metabolic and stochastic models to optimise treatment recommendations in the context of possible future patient variation. It enables probabilistic forecasting to achieve adaptable and more optimised patient care. This forecasting capability in a computerised protocol enables increased protocol flexibility, increased safety, and reduced clinical effort by design.
In particular, the stochastic approach enabled a unique targeting method. All interventions are designed based on maximising the likelihood of BG in a clinically specified and desired range, while guaranteeing a maximum (safety) cohort-wide risk of light hypoglycemia. The stochastic output range is thus overlaid with a clinically specified desired control range (72-117mg/dL in this case) to maximise the likelihood of being in that range, while also ensuring safety. Its control thus directly incorporates patient variability into control and selects treatments that are justified by their predicted effect on the full range of possible BG outcomes.
The use of stochastic forecasting and model-based control intrinsically avoids the risk of insulin saturation due to high insulin doses with minimum effect, thus minimising excessive insulin dosing [39, 40]. In particular, as insulin dose increases, the stochastic bounds become wider making it difficult to achieve the desired targets in Table 3. Equally, additional insulin infusion recommendations enable consistently high insulin resistance to be managed, while avoiding over-response. Hence, this approach can provide more flexible, patient-specific care compared to SPRINT, which is part of the results seen in Figures 4 and 5.
A further impact of stochastic forecasting is evident in the results of Table 6 for insulin rates. In particular, while the BG levels achieved are similar, the median (IQR) insulin rates are slightly lower for STAR than for SPRINT, despite similar or higher nutrition rates. In this case, the use of computer models and stochastic bounds allows STAR to be very aggressive with insulin when it is safe to do so. Hence, the stochastic forecasting available to STAR allows outlying (outside of the IQR or the outer 50%), aggressive insulin doses that SPRINT cannot use safely. This point of difference is evident also in Figure 4, where STAR clearly modulates insulin far more aggressively and frequently than SPRINT for both high (≥ 4U/hour) and low (≤ 1 U/hour) doses that are rarely used in SPRINT. Therefore, one gets similar BG outcomes for what appear, in terms of median and IQR, to be slightly lower insulin doses.
The STAR framework and approach presented allows (relatively) free choice of measurement interval to reduce real and perceived clinical burden through longer intervals between interventions [41, 42]. While longer intervals used different targeting in Table 3, the overall glycemic performance was still comparable to or better than SPRINT. Equally, all degradation of control was towards moderate hyperglycemia (BG>126mg/dL) by design and the use of stochastic maximum likelihood targeting. This approach reflects the greater opportunity for variation over a longer interval and thus maximises safety, while also keeping the glycemic outcome distribution centered on the desired range to maximise the likelihood of being in that range.
More specifically, the virtual patient simulations show that STAR is effective at reducing a primary source of clinical effort and negative feedback about TGC, which has been a major drawback in prior studies [19]. Staff perception of workload is influenced by the
number of measurements per day, actual time spent at the bedside performing measurements and administering treatment, and the accuracy of control obtained [41]. In particular, if a protocol is able to effectively regulate glycemic levels and achieve clinical outcomes, impressions of clinical staff are more positive and perceived effort is (at least slightly) reduced. Although STAR is able to reduce the number of measurements per day it is implemented through a computer, which requires time for data entry as well as calculation run-time. As a paper-based protocol SPRINT is faster in this respect and may be more transparent in its operation to users [41], which also affects perceived effort and compliance. Simulation results indicate the accuracy of control for STAR is comparable to, or exceeds, clinical SPRINT results so perceptions of effort will likely hinge on the outcome of clinical implementation.
The overall results highlight the trade-off between tight control and measurement rate (clinical effort). The CDFs of Figure 3 show that the best control is achieved by the 1 hour version of STAR, as expected, but at a consequence of 24 measurements per day. When the maximum interval is set at 2 or 3 hours with lesser measurements and clinical effort, STAR outperforms SPRINT with respect to hypoglycemia (safety) with comparably tight control (performance). However, there is still some dependence, although weaker, between measurement interval, and safety and performance.
In contrast, there is little degradation in performance between the 2-hourly and 3-hourly versions of STAR, which provide significant reductions in clinical effort. For a 17% (relative) reduction in measurements per day between the 2 and 3 hour versions of STAR, a penalty of 9.5% (relative) reduction in measurements in the tightest (72-117mg/dL) target band, which is not likely to be clinically significant as those measurements have
only moved to very slightly higher BG, as seen in Table 6 and Figure 3. Hence, STAR represents a potentially more optimal trade-off of clinical effort and performance.
Virtual trials are only a guideline. However, this in silico method has been extensively tested and validated for specific patients and in predicting both the median and variability of clinical trial outcomes. It is the only such model validated to this extent to date [30]. Hence, it is expected that clinical results, like those initially shown here, will be consistent with the virtual trial, in line with prior studies using this virtual trials method and approach [30, 31].
The STAR glycemic control approach presented is fully generalisable. The clinical targets and ranges can be set directly by clinical staff, as can the desired risk of hypo- or hyper- glycemia (maximum 5% for BG < 72mg/dL here). Hence, the approach is entirely flexible. The ranges and risk values used here represent those chosen at Christchurch Hospital.
In contrast, while the glycemic ranges used here broadly match those in the design of SPRINT, SPRINT was fixed in its implementation and did not allow this flexibility and could not be adjusted directly by clinical staff for different patients or groups, as has been done for STAR in ongoing pilot trials in Belgium and Hungary that use only an insulin intervention with fixed nutrition rates and different glycemic target ranges [43].
One possible limitation of this overall STAR framework and approach is the stochastic model. Its forecasting is at the centre of all the major advantages enabled by this approach. It is also a cohort based model, which means that for some patients it will be
too conservative, while for others potentially not conservative enough [34]. Equally, there is no assurance that all ICU cohorts would have similar metabolic variability. However, these models can be readily created from existing clinical data for any reasonably similar metabolic system model [27, 28, 34]. Equally, and perhaps more importantly, a recent study found similar metabolic variability between NZ and Belgian ICU cohorts [23], although this specific result needs to be further generalised going forward.
Finally, the initial clinical results are, to date, positive. They do clearly show that the STAR controller implemented clinically for ~450 hours has similar or better performance than the virtual trials. Equally, Patients A and B clearly showed patients with different levels of metabolic variability, which was managed equally well with respect to glycemic performance and safety for both cases. Patient C showed a unique case worth noting, where the controller recognised the relatively high insulin sensitivity of the patient after about half their stay, and was able to recommend no insulin be given. This recommendation was correct given the resulting good glycemic control within the desired target band for over 50 subsequent hours. The correct recommendation of no insulin is one that many protocols find difficult as their design is implicitly based upon and biased towards active intervention. Hence, the STAR controller was able to avoid over controlling the patient with insulin where necessary.
5.0 Conclusions
Clinically validated in silico virtual trials of the Stochastic Targeted (STAR) TGC approach show that this approach can provide quality control performance, while significantly reducing hypoglcycemia and clinical workload. The stochastic forecasting used is unique in this field and enables a maximum likelihood approach to targeting a desired glycemic range, while also enabling the clinical risk of hypo- or hyper- glycemia to be directly managed. It also enables patients with very different metabolic (intra- and inter- patient) variability to be directly managed and controlled within a single (STAR) framework. More specifically, the STAR approach presented is fully generalisable and clinical targets and ranges can be set directly by clinical staff, with those used here representing those chosen at Christchurch Hospital. Initial clinical trials as part of a larger ongoing pilot trial matched or exceed these virtual results.
REFERENCES:
1. Capes SE, Hunt D, Malmberg K, Gerstein HC: Stress hyperglycaemia and increased risk of death after myocardial infarction in patients with and without diabetes: a systematic overview. Lancet 2000, 355(9206):773-778. 2. Finney SJ, Zekveld C, Elia A, Evans TW: Glucose control and mortality in
critically ill patients. Jama 2003, 290(15):2041-2047.
3. Krinsley JS: Association between hyperglycemia and increased hospital mortality in a heterogeneous population of critically ill patients. Mayo Clin
Proc 2003, 78(12):1471-1478.
4. McCowen KC, Malhotra A, Bistrian BR: Stress-induced hyperglycemia. Crit
Care Clin 2001, 17(1):107-124.
5. Mizock BA: Alterations in fuel metabolism in critical illness: hyperglycaemia.
Best Pract Res Clin Endocrinol Metab 2001, 15(4):533-551.
6. Umpierrez GE, Isaacs SD, Bazargan N, You X, Thaler LM, Kitabchi AE: Hyperglycemia: an independent marker of in-hospital mortality in patients with undiagnosed diabetes. J Clin Endocrinol Metab 2002, 87(3):978-982. 7. Van den Berghe G, Wouters P, Weekers F, Verwaest C, Bruyninckx F, Schetz M,
Vlasselaers D, Ferdinande P, Lauwers P, Bouillon R: Intensive insulin therapy in the critically ill patients. N Engl J Med 2001, 345(19):1359-1367.
8. Egi M, Bellomo R, Stachowski E, French CJ, Hart G: Variability of blood glucose concentration and short-term mortality in critically ill patients.
Anesthesiology 2006, 105(2):244-252.
9. Krinsley JS: Glycemic variability: a strong independent predictor of mortality in critically ill patients. Crit Care Med 2008, 36(11):3008-3013.
10. Chase JG, Shaw G, Le Compte A, Lonergan T, Willacy M, Wong XW, Lin J, Lotz T, Lee D, Hann C: Implementation and evaluation of the SPRINT protocol for tight glycaemic control in critically ill patients: a clinical practice change. Crit Care 2008, 12(2):R49.
11. Krinsley JS: Effect of an intensive glucose management protocol on the mortality of critically ill adult patients. Mayo Clin Proc 2004, 79(8):992-1000. 12. Chase JG, Pretty CG, Pfeifer L, Shaw GM, Preiser JC, Le Compte AJ, Lin J,
Hewett D, Moorhead KT, Desaive T: Organ failure and tight glycemic control in the SPRINT study. Crit Care 2010, 14(4):R154.
13. Krinsley JS, Jones RL: Cost analysis of intensive glycemic control in critically ill adult patients. Chest 2006, 129(3):644-650.
14. Van den Berghe G, Wouters PJ, Kesteloot K, Hilleman DE: Analysis of healthcare resource utilization with intensive insulin therapy in critically ill patients. Crit Care Med 2006, 34(3):612-616.
15. Preiser JC, Brunkhorst F: Tight glucose control and hypoglycemia. Crit Care
Med 2008, 36(4):1391; author reply 1391-1392.
16. Finfer S, Delaney A: Tight glycemic control in critically ill adults. Jama 2008, 300(8):963-965.
17. Brunkhorst FM, Engel C, Bloos F, Meier-Hellmann A, Ragaller M, Weiler N, Moerer O, Gruendling M, Oppert M, Grond S et al: Intensive insulin therapy and pentastarch resuscitation in severe sepsis. N Engl J Med 2008, 358(2):125-139.
18. Griesdale DE, de Souza RJ, van Dam RM, Heyland DK, Cook DJ, Malhotra A, Dhaliwal R, Henderson WR, Chittock DR, Finfer S et al: Intensive insulin
therapy and mortality among critically ill patients: a meta-analysis including NICE-SUGAR study data. Cmaj 2009.
19. Mackenzie I, Ingle S, Zaidi S, Buczaski S: Tight glycaemic control: a survey of intensive care practice in large English hospitals. Intensive Care Med 2005, 31(8):1136.
20. Schultz MJ, Spronk PE, Moeniralam HS: Tight glycaemic control: a survey of intensive care practice in the Netherlands. Intensive Care Med 2006, 32(4):618-619.
21. Gale SC, Gracias VH: Glycemic control needs a standard reference point.
Critical care medicine 2006, 34(6):1856-1857.
22. Chase JG, Le Compte AJ, Suhaimi F, Shaw GM, Lynn A, Lin J, Pretty CG, Razak N, Parente JD, Hann CE et al: Tight glycemic control in critical care - The leading role of insulin sensitivity and patient variability: A review and model-based analysis. Comput Methods Programs Biomed 2011, in-press (available online).
23. Suhaimi F, Le Compte A, Preiser JC, Shaw GM, Massion P, Radermecker R, Pretty C, Lin J, Desaive T, Chase JG: What Makes Tight Glycemic Control (TGC) Tight? The impact of variability and nutrition in 2 clinical studies.
Journal of Diabetes Science and Technology 2010, 4(2):284-298.
24. Lonergan T, LeCompte A, Willacy M, Chase JG, Shaw GM, Wong XW, Lotz T, Lin J, Hann CE: A Simple Insulin-Nutrition Protocol for Tight Glycemic Control in Critical Illness: Development and Protocol Comparison. Diabetes
Technol Ther 2006, 8(2):191-206.
25. Lonergan T, Compte AL, Willacy M, Chase JG, Shaw GM, Hann CE, Lotz T, Lin J, Wong XW: A pilot study of the SPRINT protocol for tight glycemic control in critically Ill patients. Diabetes Technol Ther 2006, 8(4):449-462.
26. Chase J, LeCompte A, Preiser JC, Shaw G, Penning S, Desaive T: Physiological Modelling, Tight Glycemic Control and the ICU Clinician: What are models and how can they affect practice? Annals of Intensive Care 2011, in-press. 27. Lin J, Lee, DS, Chase, JG, Hann, CE, Lotz, T and Wong, XW: Stochastic
Modelling of Insulin Sensitivity Variability in Critical Care. Biomedical
Signal Processing & Control 2006, 1:229-242.
28. Lin J, Lee D, Chase JG, Shaw GM, Le Compte A, Lotz T, Wong J, Lonergan T, Hann CE: Stochastic modelling of insulin sensitivity and adaptive glycemic control for critical care. Comput Methods Programs Biomed 2008, 89(2):141-152.
29. Bagshaw SM, Webb SA, Delaney A, George C, Pilcher D, Hart GK, Bellomo R: Very old patients admitted to intensive care in Australia and New Zealand: a multi-centre cohort analysis. Crit Care 2009, 13(2):R45.
30. Chase JG, Suhaimi F, Penning S, Preiser JC, Le Compte AJ, Lin J, Pretty CG, Shaw GM, Moorhead KT, Desaive T: Validation of a model-based virtual trials method for tight glycemic control in intensive care. Biomed Eng Online 2010, 9:84.
31. Chase JG, Shaw GM, Lotz T, LeCompte A, Wong J, Lin J, Lonergan T, Willacy M, Hann CE: Model-based insulin and nutrition administration for tight glycaemic control in critical care. Curr Drug Deliv 2007, 4(4):283-296.
32. Hann CE, Chase JG, Lin J, Lotz T, Doran CV, Shaw GM: Integral-based parameter identification for long-term dynamic verification of a glucose-insulin system model. Comput Methods Programs Biomed 2005, 77(3):259-270.
33. Le Compte A, Chase J, Lynn A, Hann C, Shaw G, Wong X, Lin J: Blood Glucose Controller for Neonatal Intensive Care: Virtual trials development and 1st clinical trials. Journal of Diabetes Science and Technology (JoDST) 2009, 3(5):1066-1081.
34. Le Compte AJ, Lee DS, Chase JG, Lin J, Lynn A, Shaw GM: Blood glucose prediction using stochastic modeling in neonatal intensive care. IEEE Trans
Biomed Eng 2010, 57(3):509-518.
35. Krishnan JA, Parce PB, Martinez A, Diette GB, Brower RG: Caloric intake in medical ICU patients: consistency of care with guidelines and relationship to clinical outcomes. Chest 2003, 124(1):297-305.
36. Kreymann KG, Berger MM, Deutz NE, Hiesmayr M, Jolliet P, Kazandjiev G, Nitenberg G, van den Berghe G, Wernerman J, Ebner C et al: ESPEN Guidelines on Enteral Nutrition: Intensive care. Clin Nutr 2006, 25(2 ):210-223.
37. Ward L, Steel J, Le Compte A, Evans A, Tan C, Penning S, Shaw GM, Desaive T, Chase JG: Interface Design and Human Factors Considerations for Model-Based Tight Glycemic Control in Critical Care. Journal of Diabetes Science
and Technology 2012, in-press.
38. Ward L, Steel J, Le Compte A, Evans A, Tan C, Penning S, Shaw GM, Desaive T, Chase JG: Data Entry Errors and Design for Model-Based Tight Glycemic Control in Critical Care. Journal of Diabetes Science and Technology 2012, in-press.
39. Prigeon RL, Roder ME, Porte D, Jr., Kahn SE: The effect of insulin dose on the measurement of insulin sensitivity by the minimal model technique. Evidence for saturable insulin transport in humans. J Clin Invest 1996, 97(2):501-507. 40. Natali A, Gastaldelli A, Camastra S, Sironi AM, Toschi E, Masoni A, Ferrannini
E, Mari A: Dose-response characteristics of insulin action on glucose metabolism: a non-steady-state approach. Am J Physiol Endocrinol Metab 2000, 278(5):E794-801.
41. Chase J, Andreassen S, Jensen K, Shaw G: The Impact of Human Factors on Clinical Protocol Performance - A proposed assessment framework and case examples. Journal of Diabetes Science and Technology (JoDST) 2008, 2(3):409-416.
42. Aragon D: Evaluation of nursing work effort and perceptions about blood glucose testing in tight glycemic control. Am J Crit Care 2006, 15(4):370-377. 43. Penning S, LeCompte A, Moorhead K, Desaive T, Massion P, Preiser JC, Shaw
G, Chase J: First Pilot Trial of the STAR-Liege Protocol for Tight Glycemic Control in Critically Ill Patients. Computer Methods and Programs in