DOI: 10.1051/0004-6361:20011406 c
ESO 2001
Astrophysics
&
Spectroscopic monitoring of 10 new northern slowly pulsating
B star candidates discovered from the HIPPARCOS mission
?
P. Mathias1, C. Aerts2, M. Briquet3, P. De Cat2, J. Cuypers4, H. Van Winckel2,??, and J. M. Le Contel1
1
Observatoire de la Cˆote d’Azur, Departement Fresnel, UMR 6528, BP 4229, 06304 Nice Cedex 4, France
2 Instituut voor Sterrenkunde, Katholieke Universiteit Leuven, Celestijnenlaan 200 B, 3001 Leuven, Belgium 3
Institut d’Astrophysique et de G´eophysique, Avenue de Cointe 5, 4000 Li`ege, Belgium
4 Koninklijke Sterrenwacht van Belgi¨e, Ringlaan 3, 1180 Brussel, Belgium
Received 6 July 2001 / Accepted 27 September 2001
Abstract. A one-year follow-up campaign of high-resolution, high-signal-to-noise spectroscopy for 10 candidate
slowly pulsating B stars, which were discovered from the HIPPARCOS astrometric mission, shows that all stars exhibit line-profile variability. From our data, and from the HIPPARCOS photometry, we conclude that all but one of the targets provide evidence of multiperiodicity, with periods of the order of days, confirming their pulsational nature. Thus they are confirmed slowly pulsating B stars. We summarize the pulsation periods and Q-values and select the most interesting targets for very-long-term follow-up observations with the goal of performing asteroseismology.
Key words. stars: variables: slowly pulsating B stars – stars: oscillations – line: profiles – stars: binaries:
spectroscopic
1. Introduction
In the coming decade, a large step forward is expected in the detailed knowledge of the internal structure of stars through the technique of asteroseismology. The goal of this, relatively new, research domain is to derive the internal processes of stars with unprecedented precision through a detailed study of their non-radial oscillations. The predictive power of helioseismology performed on SoHO data has given rise to the development of several future space missions devoted to seismological studies of stars across the whole HR diagram. These missions, of which the launches are foreseen in the time frame 2002– 2004, are currently in full preparation.
This paper deals with a class of non-radial pulsators along the main sequence, namely the slowly pulsating B stars (hereafter termed SPBs – see Waelkens 1991 for the definition of the class of variables). These stars are multiperiodic high-order low-degree gravity-mode oscilla-tors with masses in the range 3−9 M .
The HIPPARCOS mission led to the discovery of many new SPB candidates (Waelkens et al. 1998, Paper I). In Send offprint requests to: P. Mathias,
e-mail: mathias@obs-nice.fr ?
Based on observations obtained at the Observatoire de Haute-Provence.
?? Postdoctoral Fellow, Fund for Scientific Research, Flanders.
view of their potential for asteroseismology, Aerts et al. (1999, Paper II) selected twelve bright stars of this sam-ple, together with five previously known SPBs, for spec-troscopic and photometric monitoring in the Southern Hemisphere. Of these seventeen stars, with spectral types ranging from B 2 up to B 9, two were misclassified since their line-profile variability indicates chemical inhomo-geneities at the rotating stellar surface rather than pulsa-tion. Additionally, one star is an ellipsoidal variable with an orbital period of 1.7 days. These stars are not SPBs. About half of the remaining stars in the sample presented in Paper II turns out to be close spectroscopic binaries. Their orbital parameters were derived by De Cat et al. (2000, Paper III). De Cat (2001) performed a detailed fre-quency analysis and a first attempt of mode identifica-tion for all targets. All true SPBs selected in Paper II exhibit clear line-profile variability. Thus a study of the latter in principle allows us to derive the characteristics of the g-mode pulsations in full detail, provided that the overall beat-period is well covered. This is a large obser-vational challenge, but is feasible if one has permanent ac-cess to a moderate-size telescope equipped with an Echelle spectrograph.
The main goal of this paper is to derive the basic pulsational characteristics of a sample of bright northern SPBs to increase the sample selected in Paper II. To con-firm the pulsational nature of the targets, we have started a long-term spectroscopic campaign with the 1.52 m
telescope, equipped with the spectrograph AURELIE, at the Observatoire de Haute-Provence over 1.5 years. In this paper, we report on the first results from this campaign for the 10 target stars, as well as on a search for multiperi-odicity in the HIPPARCOS photometry. A second paper will be devoted to the detailed study of the line-profile variations of one target, with the goal of identifying the pulsation modes.
2. Observations and data reductions
Observations were obtained in 1998–1999 with the AURELIE spectrograph (Gillet et al. 1994) at the Coud´e focus of the 1.52 m telescope situated at the Observatoire de Haute-Provence. The detector was a mono-dimensional CCD, having a pixel size of 13 µm. The observation jour-nal is provided in Table 1.
The spectral range was [4085–4155] ˚A, centered around the Si ii doublet λλ 4128, 4130, and containing also Hδ and the He i lines λλ 4026, 4120 and 4143. The resolving power was around 15 000 (8.1 ˚A mm−1). Each spectrum has been corrected for the pixel-to-pixel response by flat-field and offset spectra. The wavelength calibration was based upon about 30 lines of a thorium lamp. Finally, the spectra were normalized to the continuum by a cubic spline function. The target list, together with the observation parameters, are given in Table 2.
3. Programme stars
The programme stars were selected from Paper I. Some physical characteristics are provided in Table 3. From the log L/L provided in Paper I and the use of the available Geneva photometric indexes, log Teffand log g were
inter-polated from the calibration of North & Nicolet (1990). Then, masses were interpolated from the evolutionary tracks of Schaller et al. (1992), from which stellar radii were deduced. We derived an upper limit for v sin i from the Fourier Transform of both Si ii lines, averaged on all our spectra.
For each programme star, we measured the radial ve-locities associated with 3 lines: both lines of the Si ii dou-blet and the Hδ line. First a Gaussian fit applied to the
147394 6092 (τ Her) 280 460 15 190
182255 7358 (3 Vul) 53 348 48 150
206540 8292 25 159 77 100
208057 8356 (16 Peg) 36 201 52 140
whole profile (only the line core for Hδ) was considered. However, because of the distortion from symmetry asso-ciated with the non-radial pulsations, strongly present for the Si ii doublet, we also considered the velocity associ-ated with the first moment of these lines (for a definition, see e.g. Aerts et al. 1992). Sometimes large discrepancies occur between values determined from different methods and/or lines. In particular, the amplitudes associated with Hδ are larger than those corresponding to the Si ii dou-blet. These different velocity values occur for all stars and are a consequence of the limited resolving power and S/N ratio of our spectra compared to those presented in e.g. Papers II and III. The differences are particularly striking for our rapid rotators, since here the broadening affects particularly faint lines. To reduce the noise in our veloci-ties, we just consider hereafter the mean value related to the above-mentioned lines and methods.
Once the different radial velocity variations are ob-tained, a frequency analysis was performed on them, as well as on the HIPPARCOS photometry. The latter data were specifically used to search for multiperiodicity. Four different period-search methods, adapted to unequally spaced data, were used to perform the frequency analyses: Fourier analysis, CLEAN (Roberts et al. 1987), Vanicek (1971), and PDM (Stellingwerf 1978). Each periodogram was computed in the [0; 3] c d−1 interval. For the CLEAN method, 100 iterations were performed, with a 0.5 gain. For the PDM method, the bin structure was (5, 2). We em-phasize that the CLEAN and Vanicek algorithms are not independent. Moreover, they are both based on Fourier analysis. Both methods try to deconvolve alias frequen-cies from the periodogram. Since there is always the risk of removing a real frequency instead of its alias, we pre-ferred to use both methods. The PDM methods is based on a different principle and offers an independent check of the results. We accepted a frequency when it was found by each of the four methods.
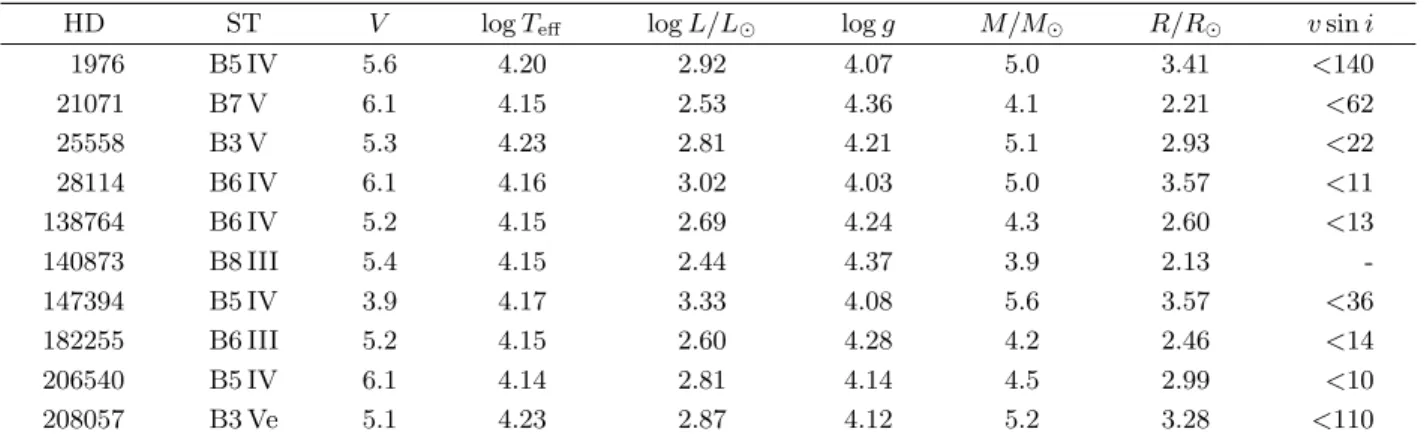
Table 3. Summary of the physical characteristics of the programme stars. For each star we give the HD number, the spectral
type, the V -magnitude, log Teff, log L/L and log g provided by HIPPARCOS and Geneva photometry (see text), stellar masses
and radii interpolated from Schaller et al. (1992), and the projected rotation velocity we measured from the Si ii doublet. Note that, because we were unable to remove the lines of the companion for HD 140873, the corresponding v sin i value is omitted.
HD ST V log Teff log L/L log g M/M R/R v sin i
1976 B5 IV 5.6 4.20 2.92 4.07 5.0 3.41 <140 21071 B7 V 6.1 4.15 2.53 4.36 4.1 2.21 <62 25558 B3 V 5.3 4.23 2.81 4.21 5.1 2.93 <22 28114 B6 IV 6.1 4.16 3.02 4.03 5.0 3.57 <11 138764 B6 IV 5.2 4.15 2.69 4.24 4.3 2.60 <13 140873 B8 III 5.4 4.15 2.44 4.37 3.9 2.13 -147394 B5 IV 3.9 4.17 3.33 4.08 5.6 3.57 <36 182255 B6 III 5.2 4.15 2.60 4.28 4.2 2.46 <14 206540 B5 IV 6.1 4.14 2.81 4.14 4.5 2.99 <10 208057 B3 Ve 5.1 4.23 2.87 4.12 5.2 3.28 <110
We also point out that the variable exposure times do not introduce smoothing effects on the frequency spectra, since the temporal resolution, i.e. the ratio of the exposure time to the pulsation period, is less than 5.2% for each measurement.
The HIPPARCOS data do not lead to severe alias problems. Moreover they have a time base of some 3.3 years, which is much longer than for the spectra. The space photometry is therefore most useful for the frequency analysis. As shown by De Cat (2001) through his detailed frequency analysis of data of bright southern SPBs, the HIPPARCOS data allow the detection of multi-periodicity for bright stars. In the following we provide the significance of the frequencies based on the HIPPARCOS data by means of the formula provided by Kovacs (1981):
σf =
√
2aσN √
N AT, (1)
with σN the standard deviation due to the errors of the
measurements, A the amplitude, and T the total time span of the data. We have substituted the value of a = 0.55 (as is usually done) for the unknown parameter a. Each of the accepted frequencies is determined with the accuracy pro-vided by (1); candidate frequencies that need further ob-servational verification are calculated to a lesser accuracy in order to limit the calculation time; for these frequen-cies we do not indicate the significance level. At the end of the section we provide a table with information on the used HIPPARCOS data and a summary of the frequency analysis, and the relevant standard deviations.
In the following parts of this section, we describe the results for each target star. All stars exhibit line-profile variations. We chose to show line profiles only for those stars whose variations are clear from visual inspection.
3.1. HD 1976
The standard deviation in the HIPPARCOS photome-try amounts to 0.0106 mag for HD 1976. A first very clear frequency of f1 = 0.93914± 0.00003 c d−1 has an
amplitude of 0.0097 mag. After prewhitening, we clearly find a second frequency of f2 = 0.39934± 0.00004 c d−1
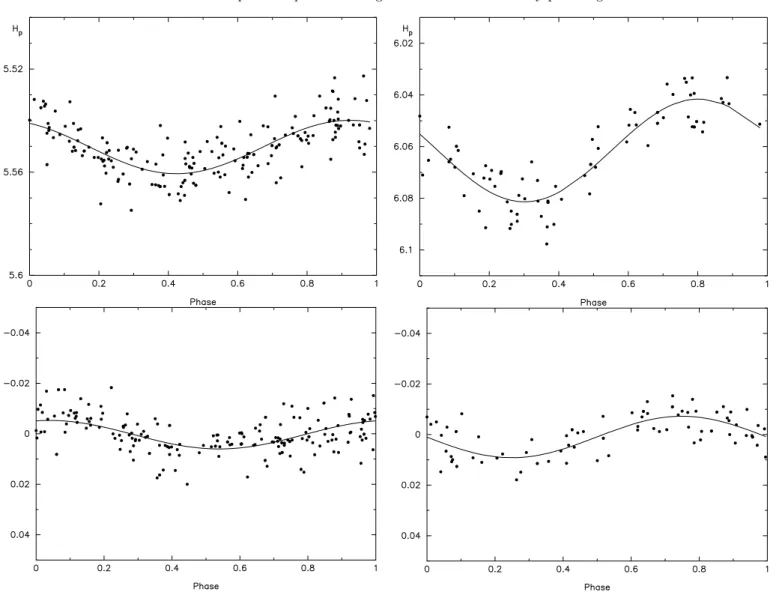
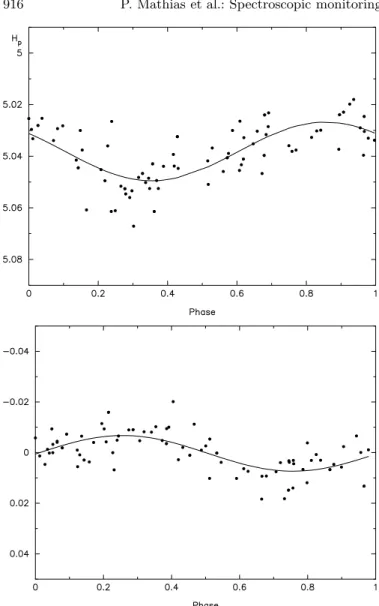
with an amplitude of 0.0060 mag. The remaining standard deviation after prewhitening with these two frequencies is 0.0062 mag. After a next round of prewhitening, two candidate frequencies, one around 0.6230 c d−1 and one around 0.8126 c d−1, emerge, but they reduce the standard deviation to only 0.0059 mag and cannot be accepted as confirmed. The phase plots for the two accepted frequen-cies are shown in Fig. 1.
Because of the large projected rotational velocity, spec-tral variations are present but difficult to vizualize. The peak-to-peak variation corresponding to the Hδ line is some 50 km s−1, a value larger than that associated with the metallic lines (30 km s−1). Both large variations are connected to the orbital motion of the star which has an amplitude around 23.4 km s−1 (Tokovinin 1997). This au-thor mentions a 25.44 d orbital period. When we remove the orbital motion from the radial-velocity variations be-fore the frequency analysis is performed, the peak-to-peak variations become of the order of 16 km s−1, but the un-certainty is about 3.9 km s−1.
None of the HIPPARCOS frequencies are dominant in the different power spectra of the frequency analyses of the radial velocity curves. No well-defined peaks are present at all. There is some indication for the second frequency f2to
be present in the line-profile variations. A formal periodic fit with the frequency f2 found in the HIPPARCOS data
leads to an amplitude of 2.7 km s−1 and hardly reduces the standard deviation.
Hence, the radial-velocity variations of this spectro-scopic binary seem to be dominated by a different fre-quency than the HIPPARCOS photometry. Our spectra are not sufficiently numerous, and have a too low resolu-tion, to identify the pulsation modes.
3.2. HD 21071
For HD 21071, the Hp-magnitudes have a standard
Fig. 1. Phase diagrams of the Hp-data of HD 1976. Top: fit for f1 = 0.93914 c d−1; bottom: fit on the residuals for f2 =
0.39934 c d−1.
the space data: f1= 1.18843± 0.00003 c d−1 with an
am-plitude of 0.0190 mag and f2 = 1.14942± 0.00006 c d−1
with an amplitude of 0.0090 mag. They reduce the stan-dard deviation to 0.0058 mag. The phase diagrams are plotted in Fig. 2.
Figure 3 represents the observed line-profile variations, sligthly broadened by the moderate rotation. Clear mod-ifications of the profile shapes with time are present.
The frequency analysis applied to the radial-velocity data leads to a common peak around 1.14 c d−1, close to the f2value derived from the photometry. Since our
spec-troscopic data set is not very large, we imposed the two frequencies f1 and f2 for a harmonic fit. This leads to
amplitudes of 3.3 and 0.9 km s−1 for, respectively, f1 and
f2. The phase diagram of the velocity variations for f1 is
displayed in Fig. 4. The radial-velocity variations reach a peak-to-peak amplitude around 13 km s−1. This is a large variation for an SPB (for typical values, see also Papers II and III).
Fig. 2. Phase diagrams of the Hp-data of HD 21071. Top: fit for f1 = 1.18843 c d−1; bottom: fit on the residuals for f2 =
1.14942 c d−1.
Thus this SPB is clearly multiperiodic. More and higher quality spectroscopic data are needed to derive the spherical wavenumbers of the pulsation.
3.3. HD 25558
For HD 25558, only one clear frequency emerges from the
Hp-data, which have an original standard deviation of
0.0142 mag. This frequency, f1= 0.65284± 0.00003 c d−1,
has an amplitude of 0.0181 mag and reduces the standard deviation to 0.0067 mag (see Fig. 5). Two candidate fre-quencies appear after prewhitening: f2' 0.7318 c d−1and
f20 ' 1.9298 c d−1. They both additionally reduce the
stan-dard deviation by a millimag but cannot be accepted with-out further observational evidence.
The profile variations are very well-marked (as seen in Fig. 6) and not broadened too much by rotation. The different periodograms for the radial-velocity dataset show power in the neighbourhood of the frequency f1, which
accounts for∼52% of the variance. A comparison between the formal fits with, on the one hand, f1 and f2 and, on
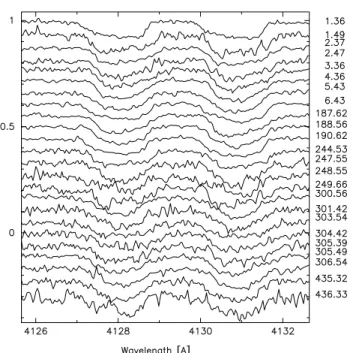
Fig. 3. Line-profile variations of the Si ii doublet λλ 4128–4130
for HD 21071. Observation dates are indicated on the right of the panel (+2450850 HJD).
Fig. 4. Phase diagram of the mean heliocentric velocities for
the star HD 21071 for f1. The main uncertainty in the radial
velocity data is 2.0 km s−1.
the other hand, f1and f20 does not permit us to determine
which secondary frequency should be preferred. We find amplitudes of respectively 2.1 and 0.9 km s−1 for f1 and
f2/f20. The phase diagram corresponding to the frequency
f1for the spectroscopic data is represented in Fig. 7. The
total peak-to-peak variation is of the order of 7 km s−1. Again, our dataset is insufficient to derive more de-tailed information on the pulsational velocity field of this star, for which the photometric variability points towards multiperiodicity.
3.4. HD 28114
Only 56 Hp measurements were taken for HD 28114.
The standard deviation of 0.0132 mag leaves no doubt,
Fig. 5. Phase diagram of the Hp-data of HD 25558. The fit is for 0.65284 c d−1.
Fig. 6. Same as Fig. 3, but for the star HD 25558.
however, that we are dealing with a variable star. We found f1 = 0.79104± 0.00005 c d−1, with an amplitude
of 0.0159 mag, which leads to a remaining standard devi-ation of 0.0060 mag (see Fig. 8). The HIPPARCOS team gave a different frequency of 0.93 c d−1 (Paper I), but it reduces the standard deviation to only 0.0078 mag.
The low projected rotation velocity of the star allows us to see the line-profile variations immediately (Fig. 9). The velocity variations are spread over a∼7 km s−1range, but most of the values are in a 3 km s−1range, the uncer-tainty being 1.1 km s−1. The departures from this range are due to asymmetric and broad profiles (Fig. 9 for the 4.31 day spectrum for instance). We find an amplitude of
∼1.7 km s−1 for f1.
Wolff (1978) claims, from 9 low-resolution spectro-grams (13.6 ˚A mm−1), that the star is a spectroscopic
Fig. 7. Same as Fig. 4, but for HD 25558 and for f1. The un-certainty is 1.9 km s−1. Note that the two points that have a high value near phase 1 correspond to asymmetric and broad profiles.
Fig. 8. Phase diagram of the Hp-data of HD 28114. The fit is for 0.79104 c d−1.
binary, with a 0.2–0.4 c d−1orbital frequency and a peak-to-peak variation of 13 km s−1. It is very likely that she misinterpreted the radial-velocity variations originating from the line-profile variability as being caused by a com-panion. Our 17 spectra are by far too few to disentangle the pulsational behaviour, but the clear profile variability allows us to conclude that the star pulsates with a veloc-ity amplitude compatible with the one reported by Wolff (1978).
3.5. HD 138764
HD 138764 was already extensively studied in Paper II and in De Cat (2001) by means of spectra and photometry taken from La Silla in Chile. This star is also a slow ro-tator, with v sin i = 18 km s−1, and presents well-marked line-profile variations in our OHP spectra (Fig. 10).
Fig. 9. Same as Fig. 3, but for the star HD 28114.
Fig. 10. Same as Fig. 3 but concerning the star HD 138764.
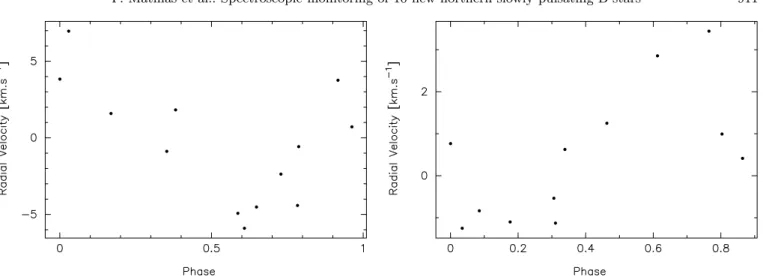
A frequency search in the radial velocities led to the value provided in De Cat (2001), 0.7944±0.0009 c d−1, and an amplitude of 4.7 km s−1, compatible with the results of Paper II. In De Cat (2001), an additional frequency of 0.6372± 0.0009 c d−1 is reported. This frequency is also present in our radial velocity variations, and corresponds to a velocity amplitude∼2.0 km s−1. The phase diagram of the radial-velocity variations for the main frequency is displayed in Fig. 11. The peak-to-peak amplitude is of the order of 12 km s−1. Paper II and De Cat (2001) contain a much more detailed analysis.
Fig. 11. Same as Fig. 4, but for HD 138764 and for f1. Uncertainty on velocity data is 1.4 km s−1.
Fig. 12. Same as Fig. 3, but for the star HD 140873. Lines of
the secondary are sometimes visible.
3.6. HD 140873
For the double-lined spectroscopic binary HD 140873, Paper II, Paper III and De Cat (2001), who studied this object by means of spectra and photometry taken from La Silla in Chile, contain relevent background informa-tion. As is shown in Paper III, the star is a spectroscopic binary with a 39 d orbital period and an eccentric orbit. Its large profile variations are due to both the pulsation of the primary, which has a quite high projected rotation velocity, and the presence of weak, sharp lines of the sec-ondary (Fig. 12).
The orbital parameters from Paper III were used to compute the radial velocity curves in the frame of HD 140873. Our data are not numerous enough, and have a too low signal-to-noise ratio, to remove the lines of the companion. Therefore, no frequency search has
Fig. 13. Same as Fig. 4, but for HD 140873 and for f1. The velocity data have an uncertainty of 2.1 km s−1.
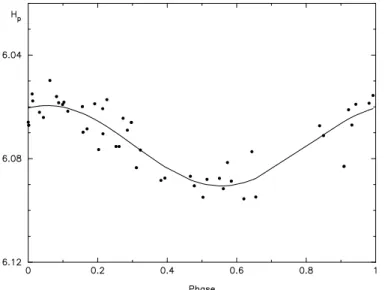
Fig. 14. Phase diagram of the Hp-data of HD 147394. The fit is for 0.80027 c d−1.
been attempted on our radial velocity data. Imposing the 1.1515 c d−1frequency reported in Paper II (a nearly iden-tical value of 1.1516 c d−1 is obtained in Paper III) and in De Cat (2001) leads to an amplitude of 2.0 km s−1 (Fig. 13).
3.7. HD 147394
The first frequency found in the Hp-data of HD 147394
is f1 = 0.80027 ± 0.00002 c d−1 with an amplitude
of 0.0099 mag. It reduces the standard deviation to 0.0070 mag (see Fig. 14). Several candidate frequencies emerge after prewhitening with f1. They all reduce the
standard deviation to about 0.006 mag but it is not clear which one is the most likely. After prewhitening with any of them, we find candidates for a third frequency which all differ from each other.
Adelman et al. (2001) report that on some of their high resolution, high signal-to-noise spectra, the metal lines are asymmetric. Line-profile variations have also been
Fig. 15. Same as Fig. 3, but for the star HD 147394. For a
better viszualisation, only a small fraction of the spectra are represented.
reported recently by Masuda & Hirata (2000), who ob-tained 30 spectra in 5 nights for He i λλ4471 and Mg ii
λλ4481. From these limited data, these authors propose
one frequency: 0.855 c d−1 or its alias 1.866 c d−1. These two frequencies do not correspond to the main frequency found in the HIPPARCOS data and account for less than 2% of the radial velocity variations.
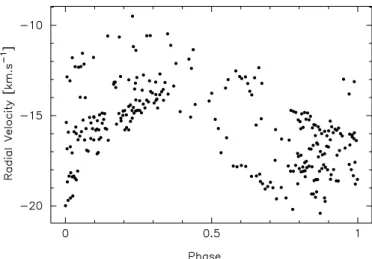
Our much more extensive dataset of 280 spectra pro-vides a better view of the line-profile variations (see Fig. 15). All frequency analyses on the radial-velocity dataset indicate f1 without any doubt. It corresponds
to an amplitude of 1.9 km s−1. A prewhitening of our data with that frequency leads to a second frequency at 0.7813 c d−1. This latter is associated with an amplitude of 1.7 km s−1. Together, these frequencies reduce the stan-dard deviation with some 70%. The deduced phase dia-grams of the radial-velocity variations for f1are presented
in Fig. 16. The total peak-to-peak variation is again of the order of 10 km s−1.
Briquet et al. (in preparation) present a much more detailed analysis and mode identification for this star.
3.8. HD 182255
The Hp-measurements of HD 182255 have a large
stan-dard deviation of 0.0192 mag. The main frequency f1 =
0.79220± 0.00001 c d−1 emerges very clearly with an amplitude of 0.0173 mag. A large standard deviation of 0.0127 mag remains after prewhitening, and a second fre-quency f2 = 0.97191± 0.00001 c d−1, with an amplitude
of 0.0155 mag, is easily found in the residuals, leading to a still large remaining standard deviation of 0.0097 mag. After subsequent prewhitening, a third frequency of
Fig. 16. Same as Fig. 4, but for HD 147394 and for f1. The uncertainty on velocity data is 1.1 km s−1.
0.47233± 0.00003 c d−1 is clearly found with all methods, with an amplitude of 0.0065 mag. The three frequencies to-gether reduce the standard deviation to 0.0086 mag. Two additional candidate frequencies are revealed after subse-quent prewhitening. They occur in a less convincing way than the three first ones: 1.14708± 0.00004 c d−1 with an amplitude of 0.0058 mag and 0.65933±0.00005 c d−1with an amplitude of 0.0046 mag. If these fourth and fifth fre-quencies are real, this star could have a frequency quin-tuplet, a suggestion which certainly needs observational verification. The phase plots for the first three frequen-cies are shown in Fig. 17. After prewhitening with the five frequencies, we obtain a standard deviation of 0.007 mag. Line-profile variations of this star were first reported by Hube & Aikman (1991), who observed “traveling bumps” in the Si ii doublet profiles. This discovery led them to classify the star as a member of the 53 Per class introduced by Smith (1977). Some of the 53 Per stars of Smith’s original sample (see e.g. Chapellier et al. 1998) are the line-profile-variable analogues of the original sample of photometrically discovered SPBs by Waelkens (1991). All SPBs turn out to be line-profile variables as well (see Paper II). Therefore, HD 182255 must be regarded as an already known, confirmed SPB before the present study. Its clear line-profile variations (Fig. 18) are easily seen thanks to the low projected rotation velocity. These vari-ations are superposed on line shifts due to orbital motion. Indeed, HD 182255 is a member of a single-lined spectro-scopic binary which has an orbital period of 367 d (Hube & Aikman 1991). It is therefore necessary to remove the ve-locity associated with the binary motion before analysing the intrinsic variability. We have subtracted the orbital radial velocity by estimating the latter according to the orbital elements given in Hube & Aikman (1991).
The frequency analysis after removal of the orbital motion leads to the two frequencies f1 and f2. The first
frequency found in the radial velocity data is f1 and
af-ter prewhitening we find f2 in the residuals. The
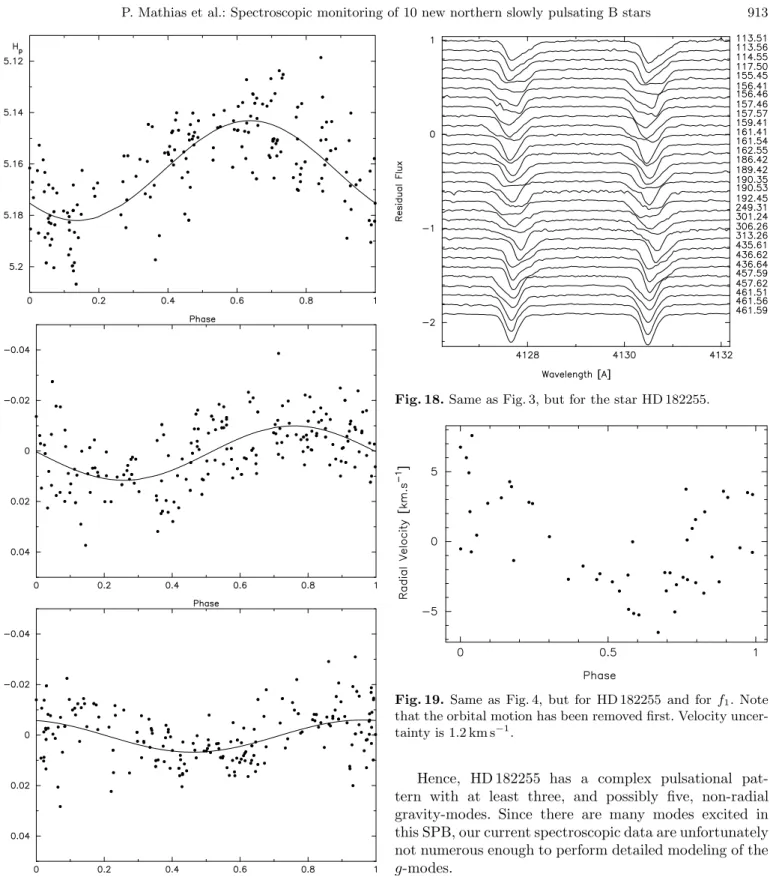
Fig. 17. Phase diagrams of the Hp-data of HD 182255. The different panels display the data after subsequent prewhiten-ing stages. From top to bottom: f1 = 0.79220 c d−1, f2 =
0.97191 c d−1, f3= 0.47233 c d−1.
around 2.1 km s−1. The other frequencies are not signif-icantly present in the spectroscopic data. The resulting phase diagram for f1, free of the binary motion, is
repre-sented in Fig. 19.
Fig. 18. Same as Fig. 3, but for the star HD 182255.
Fig. 19. Same as Fig. 4, but for HD 182255 and for f1. Note that the orbital motion has been removed first. Velocity uncer-tainty is 1.2 km s−1.
Hence, HD 182255 has a complex pulsational pat-tern with at least three, and possibly five, non-radial gravity-modes. Since there are many modes excited in this SPB, our current spectroscopic data are unfortunately not numerous enough to perform detailed modeling of the
g-modes.
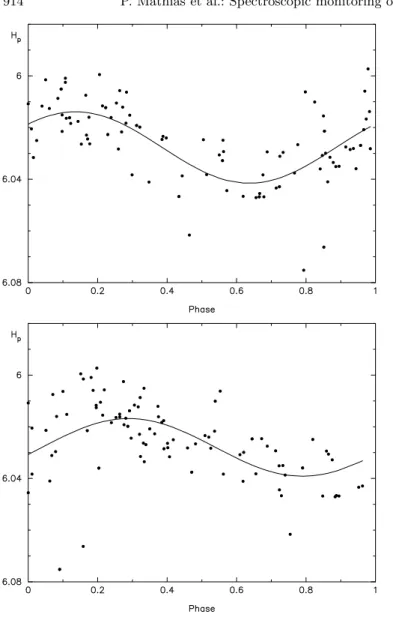
3.9. HD 206540
The standard deviation of the HIPPARCOS dataset of HD 206540 is 0.0132 mag. The search for a main fre-quency results in two competing candidates, who are each other’s aliases: f1 = 0.65359± 0.00004 c d−1 and
f10 = 0.76237± 0.00004 c d−1. We are not able to prefer
one above the other on the basis of the reduction in stan-dard deviation, amplitude, or phase diagram (see Fig. 20). The HIPPARCOS team reports a frequency of 0.69 c d−1,
Fig. 20. Phase diagrams of the Hp-data of HD 206540. Top: fit for 0.6536 c d−1; bottom: fit for 0.7624 c d−1.
which is close to the average of our two candidates. If we prewhiten with any of the two, we find clear evidence of additional frequencies, but the ones that are derived are all different for the different choices of the main and second frequencies. Therefore this star has a complex variability pattern in the space photometry, with at least three fre-quencies, but we are unable to derive one unique most likely triplet since several combinations of three periods lead to fits of the same quality.
Line-profile variations are well seen for this star (Fig. 21) with its low projected rotation velocity. The HIPPARCOS catalogue frequency 0.694 c d−1 is not present in our periodograms of the radial velocity dataset either. But our spectroscopic data are too limited to per-form an independent frequency search. A comparison be-tween sine-fits for f1and f10 leads us to conclude that f10 is
the dominant frequency in the radial-velocity variations. The corresponding phase diagram is shown in Fig. 22, from which we see that the total peak-to-peak variations can reach some 12 km s−1.
Fig. 21. Same as Fig. 3, but for the star HD 206540.
Fig. 22. Same as Fig. 4, but for HD 206540 and for f10. The
uncertainty on velocities is 1.5 km s−1.
3.10. HD 208057
The standard deviation in the Hp-data of the rapid
ro-tator HD 208057 amounts to 0.0114 mag. Two frequencies emerge clearly from the period search: f1 = 0.80172±
0.00004 c d−1 with an amplitude of 0.0097 mag, and f2=
0.89045± 0.00004 c d−1with an amplitude of 0.0079 mag. They lead to a standard deviation of 0.0058 mag (see Fig. 23). After subsequent prewhitening we find additional evidence of another frequency, but we cannot chose be-tween the three candidates around 0.5844, 0.9406, and 1.4403 c d−1.
This SPB has very broad lines due to the high pro-jected rotation velocity. Therefore, line-profile variations, although present, are not easily seen. A frequency search on the radial-velocity datasets reveals a long period around 25 days, which might point towards binarity. In the range of SPBs-like periods no clear peak is present.
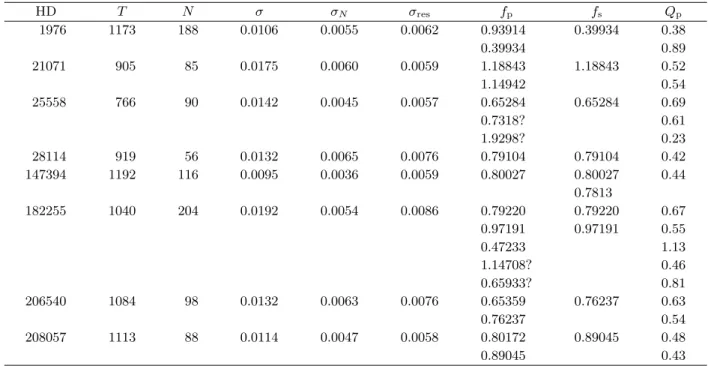
Table 4. Summary of the HIPPARCOS data used and of the results of the frequency analyses for 8 northern SPBs (for
the results on HD 138764 and HD 140873 we refer to De Cat 2001). T stands for the total time span in days and N for the number of data points. σ denotes the original standard deviation of the data, σN the standard deviation due to the errors of the measurements, and σres the standard deviation of the residuals after prewhitening with all the listed frequencies fp. All
standard deviations are expressed in magnitudes. Successively are then given the accepted frequencies in the photometry (fp)
and spectroscopy (fS) data [c d−1], and the pulsation constant Qp[d] computed from the photometric frequencies.
HD T N σ σN σres fp fs Qp 1976 1173 188 0.0106 0.0055 0.0062 0.93914 0.39934 0.38 0.39934 0.89 21071 905 85 0.0175 0.0060 0.0059 1.18843 1.18843 0.52 1.14942 0.54 25558 766 90 0.0142 0.0045 0.0057 0.65284 0.65284 0.69 0.7318? 0.61 1.9298? 0.23 28114 919 56 0.0132 0.0065 0.0076 0.79104 0.79104 0.42 147394 1192 116 0.0095 0.0036 0.0059 0.80027 0.80027 0.44 0.7813 182255 1040 204 0.0192 0.0054 0.0086 0.79220 0.79220 0.67 0.97191 0.97191 0.55 0.47233 1.13 1.14708? 0.46 0.65933? 0.81 206540 1084 98 0.0132 0.0063 0.0076 0.65359 0.76237 0.63 0.76237 0.54 208057 1113 88 0.0114 0.0047 0.0058 0.80172 0.89045 0.48 0.89045 0.43
Therefore we imposed the two frequencies found in the space photometry. Both are present in the variations, the “dominant” one being f2. The peak-to-peak amplitude is
around 13 km s−1 with an uncertainty of the velocity data of 2.6 km s−1. This, together with the observation that the average velocity changes from one observing season to an-other, makes us suspect that the variability in the radial velocity is not caused by pulsations alone. We, therefore, tentatively propose that HD 208057 is a long-period spec-troscopic binary, although this star has no known com-panion (Abt & Cardona 1984).
4. Summary
All 10 target stars show line-profile variability on a time-scale expected for non-radial g-mode pulsations in B-type stars. For all, but one, we find evidence of multiperiodic-ity in the HIPPARCOS data, although we are sometimes unable to derive the complete frequency sets.
HD 28114 is the only star found to be monoperiodic in the space photometry. However, while the photomet-ric frequency reduces the standard deviation to the level of the noise in the Hipparcos data, this is not the case for spectroscopic variations. It would be safer to conclude that, if other frequencies exist, photometry of higher preci-sion is needed to detect them. De Cat (2001) showed that some monoperiodic SPB candidates had to be reclassified as chemically peculiar stars, the variation being attributed to rotation. On the other hand, Adelman & Philip (1996) found the abundances of HD 28114 to be within the range
of values seen for superficially normal, main-sequence stars of similar temperature. Therefore, HD 28114 should be still considered as an SPB candidate only. We also remark that all of our other targets have never been mentioned as CP stars.
Table 4 summarizes the pulsation frequencies of the stars. The pulsation constant Q has been computed using the M/M and R/R values derived from the HIPPARCOS photometry provided in Table 3. Except for HD 1976 and HD 208057, the main photometric frequency is also the main spectroscopic frequency. This result shows that each star has a dominant non-radial low-degree
g-mode. Both exceptions are rapid rotators, leading to a
very bad determination of the velocity curve, and are a member or a suspected member of a binary system. The frequency found to be “dominant” in the spectra also ac-counts in both cases for less than 20% of the variation. Before concluding that for these two stars a low-degree non-radial g-mode is mainly responsible for the photomet-ric variability while the spectral variations are dominated by a higher-degree mode, additional spectroscopic obser-vations are necessary. Compatibility between the photo-metric and spectroscopic variations was in general also found by De Cat (2001) in his sample of southern SPBs.
For the pulsation constants Qp, we find a range of
0.23−1.13 d with an average of 0.58 d. Again this is com-patible with the results of De Cat (2001), who has treated a larger sample of SPBs with more extensive and higher quality data sets.
Fig. 23. Phase diagrams of the Hp-data of HD 208057. Top: fit for f1 = 0.80172 c d−1; bottom: fit on the residuals for
f2= 0.89045 c d−1.
Our study clearly shows that very long-term spectro-scopic monitoring is necessary to derive the frequencies and the character of the excited pulsation modes. Although our new spectroscopic data set has a time base of 1.5 years, we have sufficient spectra for only one star, HD 147394, to find multiperiodic signals in the line profiles
Abt, H. A., & Cardona, O. 1984, ApJ, 285, 190
Adelman, S. J., Caliskan, H., Kocer, D., et al. 2001, A&A, 371, 1078
Adelman, S. J., & Davis Philip, A. G. 1996, MNRAS, 282, 1181 Aerts, C., De Cat, P., Peeters, E., et al. 1999, A&A, 343, 872
(Paper II)
Aerts, C., De Pauw, M., & Waelkens, C. 1992, A&A, 266, 294 Chapellier, E., Sadsaoud, H., Valtier, J.-C., et al. 1998, A&A,
331, 1046
De Cat, P. 2001, Ph.D. Thesis, Katholieke Universiteit Leuven, Belgium
De Cat, P., Aerts, C., De Ridder, J., et al. 2000, A&A, 355, 1015 (Paper III)
ESA, 1997, The HIPPARCOS and Tycho Catalogues, ESA SP-1200 (Noordwijk: ESA)
Gillet, D., Burnage, R., Kohler, D., et al. 1994, A&A, 108, 181 Hube, D. P., & Aikman, G. C. L. 1991, PASP, 103, 49 Kovacs, G. 1981, Ap&SS, 78, 175
Masuda, S., & Hirata, R. 2000, A&A, 356, 209 North, P., & Nicolet, B. 1990, A&A, 228, 78
Roberts, D. H., Leh´ar, J., & Dreher, J. W. 1987, AJ, 93, 968 Schaller, G., Schaerer, D., Meynet, G., & Maeder, A. 1992,
A&AS, 96, 269 Smith, M. A. 1977, ApJ, 215, 574 Stellingwerf, R. F. 1978, ApJ, 224, 953 Tokovinin, A. A. 1997, A&AS, 124, 75 Vanicek, P. 1971, Ap&SS, 12, 10 Waelkens, C. 1991, A&A, 246, 453
Waelkens, C., Aerts, C., Kestens, E., Grenon, M., & Eyer, L. 1998, A&A, 330, 215, Paper I