Compositional boundary layers trigger liquid
unmixing in a basaltic crystal mush
Victoria C. Honour
1*, Marian B. Holness
1, Bernard Charlier
2, Sandra C. Piazolo
3, Olivier Namur
4,
Ty J. Prosa
5, Isabelle Martin
5, Rosalind T. Helz
6, John Maclennan
1& Marlon M. Jean
7,8The separation of immiscible liquids has significant implications for magma evolution and the formation of magmatic ore deposits. We combine high-resolution imaging and electron probe microanalysis with the first use of atom probe tomography on tholeiitic basaltic glass from Hawaii, the Snake River Plain, and Iceland, to investigate the onset of unmixing of basaltic liquids into Fe-rich and Si-rich conjugates. We examine the relationships between unmixing and crystal growth, and the evolution of a nanoemulsion in a crystal mush. We identify the previously unrecognised role played by compositional boundary layers in promoting unmixing around growing crystals at melt-crystal interfaces. Ourfindings have important implications for the formation of immiscible liquid in a crystal mush, the interpretations of compositional zoning in crystals, and the role of liquid immiscibility in controlling magma physical properties.
https://doi.org/10.1038/s41467-019-12694-5 OPEN
1Department of Earth Sciences, University of Cambridge, Cambridge CB2 3EQ, UK.2Department of Geology, University of Liege, 4000 Sart Tilman, Belgium.
3School of Earth and Environment, University of Leeds, Leeds, UK.4Department of Earth and Environmental Sciences, KU Leuven, 3001 Leuven, Belgium.
5CAMECA Instrument Inc., 5470 Nobel Drive, Madison, WI, USA 53711.6United States Geological Survey, MS 926A, Reston, VA 20192, USA.7Institut für
Mineralogie, Leibniz Universität Hannover, Callinstr. 3, 30167 Hannover, Germany.8Department of Geological Sciences, University of Alaska-Anchorage,
3211 Providence Drive, CPSB 101, Anchorage, AK 99508, USA. *email:[email protected]
123456789
T
he unmixing of mafic magmas into immiscible pairs of Fe-and Si-rich conjugates wasfirst identified in lunar samples1 and subsequently in terrestrial volcanic and plutonic rocks2–7. Given the preferential partitioning of elements of eco-nomic interest into the Fe-rich conjugate8, a detailed under-standing of the mechanisms by which significant differences in viscosity, density and wetting properties control the physical behaviour of the unmixed liquids in a crystal mush is essential, to better understand the origin of ore deposits hosted in mafic bodies9–11. Such an understanding is also vital to decode the processes responsible for the production of silicic melts by the differentiation of basalts.Since solidified rocks do not generally preserve a record of parental melts, our ability to track the onset and evolution of magma unmixing has relied on experiments12–14 and thermo-dynamic modelling15. In this study, we use microscale high-resolution imaging, electron probe microanalysis (EPMA) and nanoscale atom probe tomography (APT) to study a suite of samples from the 1959 Kīlauea Iki lava lake. The samples were drilled from the upper crust of the solidifying lava lake in 1976, 1979, 1981 and 1988, with each core reaching a different depth (Supplementary Note 1; Supplementary Fig. 1). These samples provide a unique opportunity to study the systematic evolution of unmixing during crystallisation in a natural system. The Kīlauea Iki sample suite is complemented by additional examples of glassy tholeiitic basalts from the Laki eruption, Iceland16,17and basalt flows from the Snake River Plain (SRP), USA18,19, which preserve similar microstructural evidence of immiscibility (see Supple-mentary Figs. 3 and 4; SuppleSupple-mentary Note 1).
Results
Principles of unmixing. The miscibility gap is defined by the binodal curve, which outlines a region on a phase diagram below which it is energetically favourable for a single-phase liquid to unmix. Below the binodal, the spinodal defines the temperature–composition space in which there are no thermo-dynamic barriers to unmixing and infinitesimally small fluctua-tions in composition and density grow spontaneously by uphill diffusion20, leading to phase separation. The interface between the two phases is characterised by low amplitude concentration differences that sharpen with time21. The two main mechanisms of unmixing of cooling liquids are therefore nucleation (either homogeneous or heterogeneous) below the binodal of droplets of the volumetrically minor phase or, if the liquid experiences a large, (near-) instantaneous undercooling, by spontaneous spi-nodal decomposition20. Crystal growth also occurs during cool-ing, with the possibility of the formation of compositional boundary layers (CBLs) in the immediately surrounding liquid, although the effect of this on unmixing has not previously been considered.
Occurrence of crystal CBLs. All samples studied contain mac-rocrysts (>0.5 mm) of clinopyroxene and olivine in a groundmass of plagioclase microcrysts (100–300 μm)16,17,22 and glass (com-positions are presented in Supplementary Table 1). The modal percentage of glass increases linearly with increasing depth in the upper crust of the Kīlauea Iki lava lake; in the 1976 drill core the modal glass percentage increases from 14.3% at 42.8 m depth to 44.4% at 45.5 m23. In some samples from all three localities, optimising the contrast-brightness in backscatter electron (BSE) images at high magnification reveals that plagioclase grains are surrounded by a continuous CBL24, which is enriched relative to the bulk melt with elements incompatible in plagioclase, chiefly Fe, with Mg, P, Mn and Ti. The Fe-rich CBLs are compositionally
similar to the Fe-rich immiscible liquid analysed in experimental and natural sample studies25(Supplementary Fig. 5).
We examined samples from the 1976 Kīlauea Iki drill core at progressively shallower depths (between 45.5 and 37.6 m) to trace the temporal evolution of the Fe-rich CBLs. Pre-quench temperatures range from 1112 °C to sub-solidus, based on glass thermometry, with absolute calibration uncertainties of ±8 °C26,27 (Supplementary Table 1; see‘Methods’). Plagioclase crystallisation commenced at 1163 °C28,29. As the Kīlauea Iki lava lake cooled, the isotherms moved downwards in the lava lake crust23,28and cooling rates decreased with time. Hence, the cooling rates experienced by specific core samples strongly depend on where (and when) they were collected. Samples studied from the 1976 Kīlauea Iki drill core cooled at 0.009–0.011 °C/h, whereas samples from the 1981 and 1979 drill cores cooled at a slower rate (0.0002–0.0003 °C/h)28.
The Kīlauea Iki plagioclase is typically well facetted (Fig. 1), indicating interface-controlled growth30. It is normally zoned (with a maximum compositional difference of ~10 mol. % An29), generally exhibiting a core and a well-defined relatively Na-rich rim (identifiable in energy-dispersive X-ray spectroscopy (EDS) and BSE images). The thickness of the Fe-rich CBL varies from 0.5 to 2.5 μm and is thickest on the fastest growing faces of the grain, which are those perpendicular to (010) (cartoon shown in Supplementary Fig. 7; Fig.1a, b). The aspect ratio of the Fe-rich CBL (defined as the ratio of the thickness of the CBL on the faces perpendicular to (010) and the thickness of the CBL on the (010) faces) positively correlates with the aspect ratio of the plagioclase Na-rich rim (defined as the ratio of the rim thickness on the faces perpendicular to (010) and the rim thickness on the (010) faces; Supplementary Fig. 6, Supplementary Table 2). Both these aspect ratios decrease upwards towards the lava lake surface.
The Fe-rich CBL is most distinct, being both continuous and homogeneous, in samples collected deeper than 44 m (>20% glass) in the Kīlauea 1976 drill core. At 43.7 m (1054 °C), the Fe-rich CBL is discontinuous, comprising sub-micron Fe-Fe-rich droplets surrounded by a continuous Si-rich phase (Fig. 1c). By 42.8 m (1017 °C), Fe-rich CBLs are absent and evidence of immiscibility is confined to apparently isolated pockets of glass (generally 1–3 mm2 in two-dimensions) in which 5–10 μm diameter Fe-rich droplets are attached to plagioclase with a high apparent wetting angle (>100°; Fig.1d), together with isolated Fe-rich droplets of comparable diameter dispersed within the Si-Fe-rich continuous phase. Locally, at 42.8 m (1017 °C), Fe-rich droplets adhere to pyroxene grains with a low apparent wetting angle (<40°; Fig. 1d).
In samples with thick, >1 μm, Fe-rich CBLs (i.e., the deeper 1976 drill core samples; Supplementary Fig. 8), the contact between the Fe-rich CBL and the interstitial glass appears gradational over 3–6 μm in BSE images, with the margin of the Fe-rich CBL comprising an emulsion of Fe-rich immiscible droplets dispersed in a Si-rich continuous phase: the Fe-rich droplets fine away from the Fe-rich CBL. Shallower drill core samples with thinner Fe-rich CBLs exhibit a sharp contact between the Fe-rich CBL and the surrounding interstitial glass (Fig. 1b). Plagioclase grains in the deepest sample studied (45.5 m) have prominent spines, <25 μm long, extending in the direction of fastest growth, and these indicate a period of diffusion-limited growth31(Fig.1a, b). The spines are rarer and shorter (<1 μm long) in shallower samples with thinner Fe-rich CBLs. Pyroxene is surrounded by a 1–2 μm-wide Si-rich CBL (Si-rich CBL) which, although less well developed than the Fe-rich CBL around plagioclase (Fig.1c), mirrors the attributes of the latter.
While each sample experienced the same rate of quenching, the character of the Fe-rich CBL systematically evolves through the
1976 and 1981 Kīlauea Iki drill cores. Hence, the formation of the CBL cannot be related to drilling-induced quenching. This interpretation is supported by a number of observations. First, plagioclase grains are surrounded by an Fe-rich CBL regardless of their position relative to the drill core edge (and therefore the rate of quenching). Second, the Na-rich plagioclase rim width correlates with Fe-rich CBL thickness (Supplementary Fig. 6; Supplementary Table 2). Third, the Na-rich rim aspect ratio is consistent with slower growth than that expected during a quench32. Fourth, locally, the Fe-rich CBL contains dendritic crystals of oxide partially embedded in the plagioclase substrate, consistent with simultaneous oxide and plagioclase growth (Fig.1e, f).
Similar Fe-rich CBL microstructural features are observed in the glass of the SRP tholeiites from the Sugar City drill core and in the Laki samples preserved by a natural quench as the lava flows cooled rapidly through the glass transition temperature (Supple-mentary Figs. 2 and 3). This occurred at temperatures between 1093 and 1096 °C for the SRP basalts and at 1114 °C for the Laki sample (based on glass thermometry26—see ‘Methods’) compar-able to the drill-related quenching of the 1981 Kīlauea Iki drill core samples at 1114–1140 °C27. In the 1981 Kīlauea Iki drill core, the Fe-rich CBL is thin yet well defined, thinning with decreasing drill core depth over 8.2 m, from an average of 0.8–0.5 μm for the Fe-rich rim perpendicular to the (001) plagioclase face
(Supplementary Fig. 4). The SRP Fe-rich CBL is well defined, thinning with decreasing drill core depth over 5 m, from 2.0 to 1.5 μm for the Fe-rich rim perpendicular to the (001) plagioclase face (Supplementary Fig. 2), while the Laki sample has more diffuse, thinner Fe-rich CBLs (~0.7 μm) (Supplementary Fig. 3).
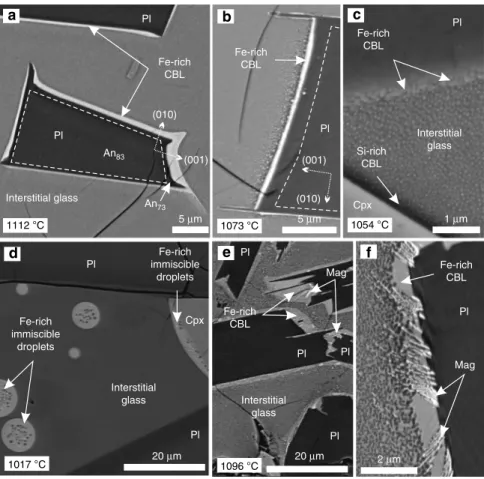
Kīlauea Iki glass compositions. With decreasing depth in the 1976 drill core relative to the lake surface (from 45.5 to 42.8 m depth; with corresponding quench temperatures of 1112 and 1017 °C, respectively), SiO2 concentrations of the apparently homogeneous bulk liquid (see ‘Nanoemulsion formation’) increase from 50 to 65 wt.%, while FeOtotal concentrations decrease from 12 to 5 wt.% (Supplementary Fig. 9, Supplementary Table 1; see‘Methods’). Correspondingly, the FeO concentration of the Fe-rich droplets increases with decreasing depth: at 45.5 m (1112 °C) the average FeO concentration is 21 wt.%, increasing to 27 wt.% at 42.8 m depth (1017 °C), consistent with published compositions for immiscible liquids12 (Supplementary Fig. 5). There is no change in the crystal assemblage associated with these variations in glass composition. Furthermore, because the Kīlauea Iki lava lake system was open with respect to H2O and had a confining pressure typically <6 bars28, the observed compositional variations cannot have resulted from variations in either H2O content or pressure. 5 µm 1 µm Cpx 20 µm b 5 µm Pl Pl 1112 °C Fe-rich CBL Interstitial glass a 1073 °C Pl Pl c 1054 °C 1017 °C Pl Cpx Pl Fe-rich immiscible droplets d (010) (001) (010) (001) Pl Mag 2 µm 20 µm f e Pl Pl Pl Pl Mag 1096 °C Fe-rich CBL Fe-rich CBL Fe-rich CBL Fe-rich CBL Si-rich CBL Interstitial glass Fe-rich immiscible droplets Interstitial glass Interstitial glass An83 An73
Fig. 1 Compositional boundary layer morphology in BSE images from samples of the 1976 Kīlauea Iki lava lake. a–d The changing morphology of immiscible
liquids in the 1976 drill core from the Kīlauea Iki lava lake, viewed in BSE images. a Plagioclase lath (Pl) surrounded by an Fe-rich compositional boundary
layer sampled at 45.4 m depth in the crust (quench temperature of 1112 °C).b A thinner compositional boundary layer surrounding plagioclase (quench
temperature of 1073 °C) and the nanoemulsion is coarser.c At 43.7 m depth (quench temperature of 1054 °C), the compositional boundary layer
surrounding plagioclase is discontinuous and sub-micrometre thick. Note the presence of darker (more Si-rich) glass immediately surrounding pyroxene
(Cpx) grains. The bulk of the glass comprises a nanoemulsion.d Isolated and attached Fe-rich droplets in interstitial glass at 42.8 m depth (quench
temperature 1017 °C). Note the Fe-rich liquid wets the pyroxene with a low wetting angle.e, f Compositional boundary layers surrounding plagioclase from
Snake River Plain tholeiites. The calculated natural quench temperature of this sample is 1096 °C. Note the oxide dendrites within the compositional boundary layer and partially embedded in the plagioclase
EPMA compositional profiles extending 50 μm outwards from the Fe-rich CBL show constant SiO2 concentrations, whereas oxides such as FeO, TiO2and MgO are depleted in a 10 μm wide zone adjacent to the Fe-rich CBL (Fig.2; Supplementary Table 3); these are oxides that preferentially partition into an Fe-rich immiscible liquid13. In the same 10 μm wide zone, there is a small increase in elements such as Al2O3 and Na2O; these are oxides that preferentially partition into a Si-rich immiscible liquid (Fig.2). This chemical concentration pattern is expected for the formation of a two-phase mixture by nucleation and growth33. Atomic-scale chemical and spatial characteristics. Three-dimensional APT reconstructions of compositional data (Supple-mentary Fig. 10; Supple(Supple-mentary Movie 1) of the Kīlauea Iki lava lake 1976 drill core sample from 44.8 m (1090 °C27) show that the
Fe-rich CBL surrounding plagioclase grains is internally homo-geneous (Supplementary Fig. 11), with a sharp contact against plagioclase (Supplementary Fig. 12) and a diffuse contact over 10 nm with the adjacent liquid (Fig. 3; Supplementary Table 4). There is no marginal Fe-enrichment of the plagioclase, even at the nanoscale (Fig. 3). The Fe-rich CBL is rich in those elements expected to preferentially partition into an Fe-rich immiscible liquid13. The APT compositional data show distinct jumps between the different components with no indication of diffusion-related elemental profiles (Fig.3), therefore we discount significant
post-solidification diffusion of elements between the two glasses. EPMA traverses across the interstitial liquid surrounding the Fe-rich CBLs (from the same sample) show a homogeneous composition (Supplementary Table 3). At the greater spatial resolution provided by the APT, it is evident that the interstitial liquid (up to 14 μm away from the Fe-rich CBL; Supplementary Fig. 10) is actually a nanoemulsion in which the Fe-rich immiscible liquid forms branch-like interconnected structures and isolated clusters within the continuous interstitial liquid. The Fe-rich immiscible liquid is separated from the interstitial liquid by sharp boundaries (glass tip 179377, shown in Fig.3), with no quantifiable
spatial variations in morphology, composition, size or spacing. Concentrations of Si increase within 2–4 nm of the nanoemulsion phase boundary on the Si-rich side; likewise, Fe concentrations increase on the Fe-rich side (Fig. 3). Importantly, these composi-tional features are present regardless of the size of the individual regions; they are consistent with spinodal decomposition33.
The Fe-rich CBL and the Fe-rich immiscible liquid of the nanoemulsion are largely similar in composition, but the Fe-rich CBL is depleted in Al and Na relative to the Fe-rich immiscible liquid of the nanoemulsion: the Al and Na concentration of the Fe-rich immiscible liquid of the nanoemulsion lies on a mixing line between plagioclase and the Fe-rich CBL (Supplementary Fig. 13; Supplementary Tables 1 and 4).
Nucleation and evolution of unmixing: triggers and relation-ships. The non-zero wetting angle34of Fe-rich liquid on a non-mafic mineral and the spatial correlation between Fe-rich CBL thickness and the growth rates of different plagioclase faces (Fig.1, Supplementary Fig. 6) both demonstrate that the Fe-rich
60 Interstitial glass SiO2 FeO CaO TiO2 MgO K2O AI2O3 Na2O P2O5 25 20 15 10 5 0 Plag CBL 50 40 30 Oxide wt. % (SiO 2 , AI 2 O3 ) Oxide wt. % 20 10 0 0 5 10
Distance from plagioclase (µm)
15 20
Fig. 2 Micron-scale compositional changes across an Fe-rich compositional boundary layer (CBL). A micron-scale compositional transect obtained using EMPA through Si-rich glass adjacent to an Fe-rich CBL. Sample from
the crust of the Kīlauea Iki lava lake (quench temperature of 1112 °C),
sampled by the 1976 drill core at 45.5 m. Note the two different scales depending on element
14
Compositional boundary layer (CBL)
PI Interstitial glass (forming a nanoemulsion)
12 10 F e concentr ation (at %) 8 6 4 2 0 0 0.22 µm 0.60 µm 10 µm Analysis direction 260 nm in length Analysis direction 100 nm in length Analysis direction 300 nm in length 260 nm distance Fe Si 80 nm distance 80 nm distance 40 35 30 25 20 15 10 5 0 Si concentr ation (at %)
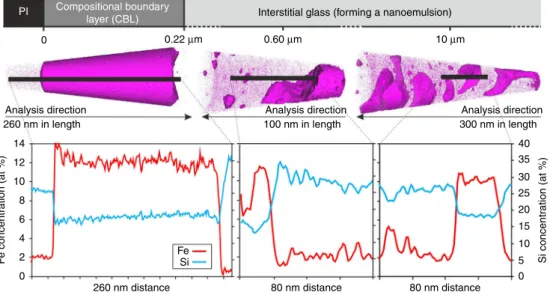
Fig. 3 Three-dimensional reconstruction of atom probe tomography (APT) data from compositional boundary layers around plagioclase. APT
reconstructed data from three representative APT tips including 1D element profiles across compositional boundaries; Kīlauea Iki lava lake sample from
44.8 m depth (quench temperature of 1090 °C). Each dot represents a single atom, but not all the atoms are shown. One-dimensional compositions from sub-volumes represented by black bars are plotted for Fe and Si concentrations (at. %) for each APT tip. A movie of an ATP tip is shown in Supplementary Movie 1
CBL surrounding plagioclase, and the weakly developed Si-rich CBL surrounding pyroxene, are disequilibrium features created during crystal growth. That the Fe-rich CBLs are continuous, with no evidence of separation into individual droplets required for textural equilibrium, must therefore be due to continuing plagioclase growth sustaining the Fe-rich CBL and preventing it from reaching textural equilibrium.
The creation and maintenance of a CBL around a growing crystal requires plagioclase growth rates to be commensurate with, or surpass, the diffusion rates of elements in the surrounding liquid. Different elements have different diffusion rates in different viscosity melts35; however, diffusion coefficients for the Makaopuhi and Alae lava lakes36range from 5 × 10⁻¹⁵to 5 × 10⁻¹⁴m2/s—these are lava lakes of similar composition to the Kīlauea Iki lava lake but smaller in size. The Makaopuhi and Alae lava lakes have plagioclase growth rates of ~5 × 10⁻¹¹to 10−12m/s36; we calculate slightly slower plagioclase growth rates of c. 10−12m/s, which is unsurprising given the samples are from a bigger lava lake and are sampled from deeper in the lake (see ‘Methods’; Supplementary Table 2). Over a distance of 20 μm, the plagioclase growth rate is comparable to that of the diffusion rate.
Previous studies suggest that cryptic crystal chemical zonation in plagioclase on the 1 μm scale may result from CBL development24. Our data showing the Na-rich rims on the same scale as the surrounding Fe-rich CBLs (Fig. 1a; Supplementary Table 2), and the relatively Na- and Al-poor composition of the Fe-rich CBL compared with the nanoemulsion Fe-rich liquids (Supplementary Table 4), are consistent with the plagioclase Na-rich rim forming at the same time as the Fe-Na-rich CBL. This may lead to a cyclic process of formation and destruction24, whereby the development of Fe-rich CBLs in a continuously evolving system facilitates the growth of Ca-poor plagioclase, which then reverts to relatively Ca-rich growth if the CBL is destroyed by magmaflow. The morphology of the plagioclase grains from the Kīlauea Iki lava lake (Fig. 1; along with the SRP data set, Supplementary Fig. 4) suggests that once the Fe-rich CBL has formed, crystal growth switches from interface-controlled to diffusion-limited, resulting in the growth of extended spines on the grain corners where the Fe-rich CBLs are less depleted in crystal-forming elements24,37.
The Fe-rich CBL surrounding plagioclase becomes thinner as solidification proceeds (Supplementary Fig. 8; Supplementary Table 2), and the Fe-rich CBL evolves during solidification into a series of attached Fe-rich immiscible droplets (at 42.8 m, 1017 °C, Fig. 1d) indicative of an approach to textural equilibrium. This suggests the rate of plagioclase growth, and hence the extent to which textural equilibration is prevented, decreases with progressive crystallisation and liquid evolution, perhaps due to a change in cooling rate. Isolated Fe-rich droplets in the shallowest (and most solidified) Kīlauea Iki lava lake sample provide further evidence of a temporal evolution in the unmixing process (the idealised evolution is illustrated in Fig. 4). This is consistent with unmixing later in the crystallisation history occurring by homogeneous nucleation in the bulk liquid, rather than being triggered by crystal growth, plausibly because only later in the crystallisation history is the undercooling sufficient to drive homogeneous nucleation.
The 1976 Kīlauea Iki lava lake transect covered by our sample suite cooled at 0.009–0.0011 °C/h28. If we assume a constant cooling rate, the temporal difference between the deepest (45.5 m) and the shallowest (42.8 m) samples containing immiscible microstructures is of the order of 11–14 months, suggesting that the differences we observe in the distribution and morphology of the unmixed Fe-rich liquids developed over a year. As the isotherms moved downwards with time and the slope of the
thermal gradient of the lava lake became shallower28, this estimate is likely to be a maximum.
Although compositional heterogeneities in liquid surrounding growing crystals are typically associated with diffusion-limited crystal growth31, our observations show that they may also result from growth under interface-controlled conditions (shown by the equant plagioclase morphology)24 (Fig. 4; t1a and t1b). Furthermore, the creation of an Fe-rich CBL enriched in components rejected by plagioclase promotes full unmixing in liquids close to the binodal, without the need to nucleate and grow droplets. The same is true for the Si-rich CBL developed around pyroxene (Fig. 1c). Our observations thus demonstrate that kinetic effects related to crystal growth strongly affect the location and nucleation of unmixing, particularly at temperatures >1020 °C. t 3 t 2 t 1b Pl Fe-rich CBL Interstitial glass (010) (001) Pl Pl Interstitial glass
Increasing crystal:liquid ratio
Decreasing temperature; increasing time of cooling
Pl Pl Pl Pl Pl Pl Pl Pl Pl Pl Interstitial glass Fe-rich CBL Fe-rich droplet Pl Pl Pl Pl Pl Pl
Pl spines due to diffusion limited Pl growth
Fe-rich CBL Pl spines
Pl
Internal Si-rich immiscibility Pl turret
Interface-controlled Pl growth promotes Fe-rich CBL Heterogeneous & homogeneous droplet growth
t 1a Pl Pl growth enriches surrounding liquid in Fe, Mg, P, Ti Interstitial glass (010) (001) Pl Pl
Interface-controlled Pl growth promotes Fe-rich CBL Ap t 4 Interstitial glass Na-rich Pl rim Pl growth slows
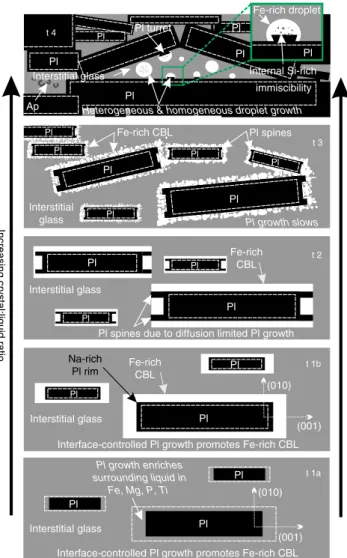
Fig. 4 Schematic evolution of unmixing features with progressive cooling at natural rates. Interface-controlled plagioclase growth promotes the formation of an Fe-rich compositional boundary layer, due to enrichment of the surrounding liquid in metalliferous elements. The Fe-rich CBL evolves temporally, coeval with the increasing crystal:liquid ratio, as a function of time and temperature, from panel t1 to t4, where t4 represents the lowest temperature and longest time of cooling. Overall, the creation of an Fe-rich CBL enriched in components rejected by plagioclase promotes full unmixing in liquids close to the binodal, without the need to nucleate and grow droplets. As plagioclase growth slows, an Fe-rich CBL can no longer be maintained and Fe-rich droplets nucleate both homogeneously and heterogeneously. Note that the processes illustrated in the cartoon are italicised
Nanoemulsion formation. The observed nanoemulsion in the Kīlauea Iki lava lake drill cores may have formed as the water used during drilling encountered each sample, undercooling sufficiently that the spinode was attained before homogeneous nucleation occurred. Alternatively, it could be a preserved feature of unmixing during the solidification of the Kīlauea Iki magma at natural rates, which has been hitherto missed as these nanoe-mulsions are only visible with the spatial resolution of APT. The natural cooling rates of the SRP and Laki samples (Supplementary Note 1) may have been sufficient to promote spinodal unmixing, and future work will need to focus on suchfine-scale unmixing in both natural and experimental samples, complementing work on nanoemulsions formed by quenching from high temperatures during meteorite impacts38.
Effect of crystal growth on the position of the binodal. An outstanding question is why Fe-rich CBLs, which are such a prominent feature of the samples from Laki, SRP, and Kīlauea Iki (Fig. 1; Supplementary Figs. 2–4), have not been commonly
observed in experimental studies of immiscibility in basaltic glass. Depending on the contrast-brightness optimisation for BSE imaging, such Fe-rich CBLs can easily be overlooked. In addition, we suggest that the generally high nucleation density in experi-mental charges results in a high crystal surface:liquid ratio, which prevents the development of steep compositional gradients in the surrounding liquid. We propose that, at slow cooling rates typical of natural basaltic magmas, a lower nucleation rate, larger crys-tals, and thus a low crystal surface:liquid ratio, mean that kinetic effects associated with crystal growth lead to earlier (higher temperature) unmixing of an Fe-rich immiscible liquid (in the form of an Fe-rich CBL), compared to experimental analogues. The spread in our compositional data for the rich CBL and Fe-rich immiscible droplets (Fig. 5; Supplementary Fig. 14) is attributed to limits on the spatial resolution of the EPMA (see Methods).
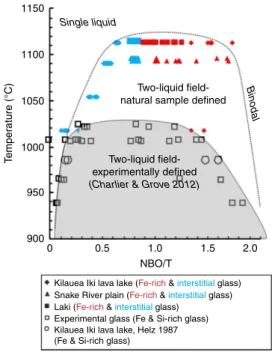
Our calculated liquid temperature estimates (see ‘Methods’) were used to constrain the position of the binodal, plotted with respect to the parameter NBO/T (Fig. 5; where NBO is the number of non-bridging oxygens and T is the concentration of the tetrahedrally coordinated network-forming cations Si, Al, P and Ti39). The highest temperatures at which Fe-rich CBLs are present in samples from Laki, SRP and Kīlauea Iki are 1114, 1096 and 1112 °C, respectively; this is significantly hotter than previous suggestions for the top of the binodal at 1020 °C12, although closer to the temperature of ~1060 °C suggested for the onset of immiscibility in the Upper Zone of the Bushveld Complex in South Africa40. Our calculated temperature at which homo-geneously nucleated Fe-rich immiscible droplets appear (around 1020 °C; Fig. 5) broadly correlates with the temperatures experimentally derived for the onset of immiscibility12, support-ing the hypothesis that the discrepancy between our observations and those of experimental studies is indeed caused by crystal growth in natural samples promoting Fe-rich CBL formation, and hence unmixing, at temperatures higher than required for homogeneous nucleation of droplets.
The timing and extent of Fe-rich CBL development in natural samples depends on magma composition and the kinetics of diffusion and crystal growth. Our work suggests that, if pre-existing phenocrysts act as nuclei, interface-controlled growth at high temperatures could result in immiscibility occurring at a higher temperature than previously recognised.
High-temperature unmixing: its importance for phase separation and chemical evolution. Our study provides direct evidence from natural samples of the morphological evolution of
an unmixing basaltic liquid with progressive cooling (Fig.4). Our data demonstrate the importance of crystal growth-induced spatial heterogeneities in liquid composition in triggering unmixing. Our application of APT on natural glass gives a unique insight into the three-dimensional (3D) nanoscale morphology of two unmixed liquids at a high spatial resolution (Fig. 3). In our slowly cooled natural samples, the development of an Fe-rich CBL illustrates unmixing at a considerably higher temperature (and lower corresponding undercooling) than observed in experimental charges (Fig. 1), with a progressive attainment of the expected equilibrium morphology of the emulsion. It is clearly not safe to assume that the onset of unmixing is controlled by thermodynamics alone: kinetic factors play an important role.
The calculated density difference between the Fe-rich immis-cible liquid (both Fe-rich CBL and Fe-rich immisimmis-cible droplets) and Si-rich conjugates examined here41is small (<0.3 g/m3), as they are in close proximity to the apex of the miscibility gap42 (Fig. 5; Supplementary Table 1). This similarity means that separation of the two conjugates is likely to be inefficient. However, as an immiscible Fe-rich end member evolves down-temperature from the apex of the binodal, the density difference will increase. Our study provides direct evidence of a continuous film (in textural disequilibrium) of Fe-rich liquid-coating plagioclase grains (Fig. 1). Conceivably, when the density of the Fe-rich liquid reaches a critical density threshold, the continuity of thisfilm could facilitate the downward movement of the dense, inviscid liquid. Consequently, the onset of unmixing at higher temperatures than previously thought increases the potential for the relative movement of the two immiscible liquids in a gabbroic crystal mush, as at higher temperatures there are lower crystal fractions, and hence mush permeability is higher.
Finally, we note that Iceland and the SRP are tholeiitic provinces with a dearth of intermediate compositions4. It is thought-provoking to consider whether the identification of a mechanism for higher temperature unmixing at lower crystal-linities has relevance to the formation of the Daly gap.
1150
Single liquid
Binodal
1100
Two-liquid field-natural sample defined
Two-liquid field-experimentally defined (Charlier & Grove 2012) 1050 1000 T emper ature (°C) 950 900 0 0.5
Kilauea Iki lava lake (Fe-rich & interstitial glass) Snake River plain (Fe-rich & interstitial glass) Laki (Fe-rich & interstitial glass)
Kilauea Iki lava lake, Helz 1987 (Fe & Si-rich glass)
Experimental glass (Fe & Si-richglass)
1.0 1.5
NBO/T
2.0
Fig. 5 The silicate liquid immiscibilityfield. Temperature as a function of the
degree of polymerisation (NBO/T: NBO non-bridging oxygens and T= Si +
Al+ P + Ti), calculated from EPMA data on the glasses. The shaded grey
region represents the experimentally defined two-liquid field12, the dotted
line represents the maximum compositional space where the natural examples show evidence of unmixing by a compositional boundary layer
Methods
Scanning electron microscopy (SEM). Samples were characterised using micro-scopy and a Quanta FEG 650F SEM for semi-quantitative mineral compositions, element EDS X-ray maps and BSE imagery, set to 10 kV at spot 3, with a working distance of 10 mm at the Department of Earth Sciences, University of Cambridge. The BSE imaging of the interstitial liquid (to identify whether it is comprised of a nanoemulsion) is at the spatial resolution limits of the SEM. Plagioclase aspect ratio, outer growth rim thickness and Fe-rich CBL thickness were measured using BSE images.
Electron probe microanalysis. Glass and plagioclase mineral compositions were
measured by EPMA using a Cameca SXFiveFE withfive WDS spectrometers at the
Department of Geology, Mineralogy and Geophysics, Ruhr-Universität Bochum
and a Cameca SX-100 withfive WDS spectrometers at the Department of Earth
Sciences, University of Cambridge, both using the PeakSight software with ZAF correction. The glass analytical routine was run at 15 kV and 8 nA with a 2 μm beam; the plagioclase analytical routine was run at 15 kV and 15 nA with a 2 μm beam. Appropriate glass and silicate mineral secondary standards were analysed. Analyses of Fe-rich immiscible droplets and Fe-rich CBLs were challenging due to the small area presented (<25 μm²) and the unknown 3D shape creating uncer-tainty about the electron beam interaction volume (this was modelled using the
Casino v2.48 software43; Supplementary Fig. 15). This means that the composition
of the two immiscible conjugates do not perfectly define the theoretical miscibility
gap; the Fe-rich conjugate analyses have a component of mixing with the Si-rich conjugate due to the minimum volume with which the probe beam interacts,
therefore we take the end-member compositions. In the Kīlauea Iki lava lake
sample from the 1976 drill core at 45.5 m depth below the lake surface, three continuous EPMA line profiles were taken across the glass, extending 50 μm from the Fe-rich CBL surrounding the plagioclase (Supplementary Table 3). In the sample from 44.8 m depth below the Kīlauea Iki lava lake surface, five continuous EPMA profiles were collected outwards from the Fe-rich CBL for comparison with the constant bulk APT composition across the 14 APT tips analysed from the
interstitial glass (Supplementary Fig. 10). The EPMA compositional profiles are
flat, consistent with the APT compositional analyses.
Glass thermometry. For consistency, liquid temperature estimates for the samples from Laki, SRP and Kīlauea Iki were recalculated using MgO glass compositions
from EPMA and the relationship T (°C)= 26.3MgOliq+ 994.4 °C26, and where
possible, checked against published values27,44. This equation was developed from
previous geothermometry work based on samples drilled from the Kīlauea Iki lava lake. All temperatures referred to are the pre-quench temperature of the liquid. Plagioclase growth rates. The rate of plagioclase growth in directions parallel to (010) is calculated from the slope of plots of the largest long axis plagioclase crystal
in each sample versus time36. Time is determined by assuming a constant cooling
rate for samples from the KI76 drill core (of 0.009–0.0011 °C/h28) from the onset of
plagioclase nucleation at 1163 °C29to the calculated temperature of the sample.
The growth rate is an estimate, as we assume that there is a progressive cooling of the Kīlauea Iki lava lake, where the downward movement of isotherms
progres-sively changed the slope of the geotherm23,28, resulting in a non-linear cooling rate.
The growth rate of plagioclase is anisotropic; the crystals in the lava lake are euhedral, growing in a melt-rich environment, so rapid growth in directions par-allel to (010) resulted in limited impingement on adjacent grains (Supplementary Fig. 7). To account for the crystal growth in two directions, the growth rate is
halved36. There are many sources of error, including those associated with
mea-suring the plagioclase long axis, determining the largest crystal and those con-verting temperature differences to time scales.
Sample preparation for APT. A dual-beam focussed-ion-beam (FIB)/scanning-electron-microscope (FEI Helios 660 with EasyLift™ micromanipulator) was used to fabricate APT specimens. A platinum-based gas injection system was used for specimen protection and attachment. Standard lift-out methodology was used to
transfer material wedges from the sample to a micro-tip-array carrier-coupon45.
Specimens were made sharp using standard annular milling methods46with an
additional low-energy milling step (5 kV clean-up)47. This process was sufficient to
remove any FIB-deposited Pt that was used during the lift-out process. APT measurements and analysis. Twenty APT tips were analysed at CAMECA Instruments Inc., Madison, Wisconsin, USA, from samples prepared from 44.8 m
depth in the 1976 drill core from the Kīlauea Iki lava lake (Fig.1e; 1090 °C27).
Fourteen samples examined the interstitial glass on a 14 μm long traverse away from a plagioclase grain (Supplementary Fig. 10). In addition, six APT samples analysed the plagioclase and the Fe-rich CBL (Supplementary Fig. 10).
The measurements were performed on a LEAP® 5000 XR in laser-pulse mode.
Typical analysis conditions were: specimen base temperature of 30 K, constant detection rates between 5 and 10 ions per 1000 pulses, laser pulse energy of 200 pJ,
and a pulse frequency set to achieve 2000 Dalton, time-of-flight range (typically
125–250 kHz); a typical voltage curve is shown in Supplementary Fig. 16. Standard
IVASIVASTMshank reconstruction was used for all the reported data48. Prepared
specimens typically resulted in needles with consistent taper angles (~10 degrees). For one of the analyses completed before specimen failure, the SEM-measured analysis depth was used to calibrate the APT tip reconstruction. Using default k-factor and image compression k-factor values, the 10 degree shank angle required ~26 V/nm to provide an initial reconstruction radius and reconstructed reconstruction depth that was consistent with SEM estimates. These reconstruction parameters were subsequently used for all reconstructions.
APT mass ranging for a representative sample is detailed in Supplementary Fig. 17. It is important to note that APT is most suitable for relative compositional data
rather than absolute compositional data due to issues with mass ranging, efficiency
of recovery and complexation during analysis49.
IVASTM3.8 was used to extract linear one-dimensional (1D) concentration
profiles from within sub-volumes of the 3D data sets (plotted in Fig.3). Profiles
were taken across the Fe- and Si-rich immiscible conjugate boundaries of the nanoemulsion parallel with the analysis direction (z-axis) of the glass tip, to ensure
maximum spatial resolution and prevent artificial features. To delineate these
immiscibility boundaries, a 6 at. % Fe atomic concentration isosurface was constructed to define the Fe-rich phase of the nanoemulsion, i.e. the shape/ morphology of the Fe-rich immiscible conjugate of the nanoemulsion. The data for
these linear 1D compositional profiles stem from an elongate bar with a square
profile of 10 nm by 10 nm and the length as shown on the profiles’ x-axis (see
Fig.3). This enabled us to choose a 1D profile that was perpendicular to the
interface of the Fe- and Si-rich immiscible conjugate boundaries and minimise any smearing artefacts in the compositional profile. These chemical profiles showed compositional depletion and enrichment characteristics typical of spinodal
decomposition33.
Data availability
The data supporting thefindings of this study, as shown in Figs.1,2,4, and5and Supplementary Figs. 1–15 are provided as Supplementary Data Tables 1–4 within the paper. The raw APT data that support thefindings shown in Fig.3and Supplementary Figs. 16 and 17 are available from the corresponding author upon reasonable request. Received: 28 November 2018; Accepted: 18 September 2019;
References
1. Roedder, E. & Weiblen, P. W. Silicate liquid immiscibility in lunar magmas,
evidenced by melt inclusions in lunar rocks. Science 167, 641–644 (1970).
2. Philpotts, A. R. Silicate liquid immiscibility in tholeiitic basalts. J. Petrol. 20,
99–118 (1979).
3. De, A. Silicate liquid immiscibility in the Deccan Traps and its petrogenetic
significance. Geol. Soc. Am. Bull. 85, 471–474 (1974).
4. Charlier, B., Namur, O. & Grove, T. L. Compositional and kinetic controls on
liquid immiscibility in ferrobasalt–rhyolite volcanic and plutonic series. Geochim. Cosmochim. Acta 113, 79–93 (2013).
5. Jakobsen, J. K., Veksler, I., Tegner, C. & Brooks, C. K. Immiscible iron-and
silica-rich melts in basalt petrogenesis documented in the Skaergaard
intrusion. Geology 33, 885–888 (2005).
6. Namur, O., Charlier, B. & Holness, M. B. Dual origin of Fe–Ti–P gabbros by
immiscibility and fractional crystallization of evolved tholeiitic basalts in the Sept Iles layered intrusion. Lithos 154, 100–114 (2012).
7. Dixon, S. & Rutherford, M. Plagiogranites as late-stage immiscible liquids in
ophiolite and mid-ocean ridge suites: an experimental study. Earth Planet. Sci. Lett. 45, 45–60 (1979).
8. Veksler, I. V., Dorfman, A. M., Danyushevsky, L. V., Jakobsen, J. K. &
Dingwell, D. B. Immiscible silicate liquid partition coefficients: implications for crystal-melt element partitioning and basalt petrogenesis. Contrib. Mineral. Petrol. 152, 685–702 (2006).
9. Kolker, A. Mineralogy and geochemistry of Fe-Ti oxide and apatite (nelsonite)
deposits and evaluation of the liquid immiscibility hypothesis. Econ. Geol. 77,
1146–1158 (1982).
10. Ripley, E. M., Severson, M. J. & Hauck, S. A. Evidence for sulfide and
Fe-Ti-P-rich liquid immiscibility in the Duluth Complex, Minnesota. Econ. Geol. 93, 1052–1062 (1998).
11. Nielsen, T. F. et al. TheSkaergaard PGE and gold deposit: the result of in situ fractionation, sulphide saturation, and magma chamber-scale precious metal redistribution by immiscible Fe-rich melt. J. Petrol. 56, 1643–1676 (2015). 12. Charlier, B. & Grove, T. L. Experiments on liquid immiscibility along tholeiitic
liquid lines of descent. Contrib. Mineral. Petrol. 164, 27–44 (2012). 13. Bogaerts, M. & Schmidt, M. Experiments on silicate melt immiscibility in the
system Fe2SiO4–KAlSi3O8–SiO2–CaO–MgO–TiO2–P2O5and implications for
natural magmas. Contrib. Mineral. Petrol. 152, 257–274 (2006).
14. Hou, T. et al. Immiscible hydrous Fe–Ca–P melt and the origin of iron
15. Ghiorso, M. & Carmichael, I. A regular solution model for metaluminous silicate liquids: Applications to geothermometry, immiscibility, and the source regions of basic magmas. Contrib. Mineral. Petrol. 71, 323–342 (1980). 16. Passmore, E., Maclennan, J., Fitton, G. & Thordarson, T. Mush disaggregation
in basaltic magma chambers: evidence from the AD 1783 Laki eruption. J.
Petrol. 53, 2593–2623 (2012).
17. Neave, D. A., Buisman, I. & Maclennan, J. Continuous mush disaggregation
during the long-lasting Lakifissure eruption, Iceland. Am. Mineral. 102,
2007–2021 (2017).
18. Embree, G. F., Lowell, M. D. & Doherty, D. J. Drilling data from Sugar City exploration well, Madison County, Idaho. Report No. 78-1095 (U.S. Geological Survey Publication, 1978).
19. Jean, M. M. et al. Caldera life-cycles of the Yellowstone hotspot track: death and rebirth of the Heise Caldera. J. Petrol. 59, 1643–1670 (2018). 20. Cahn, J. W. On spinodal decomposition. Acta Metall. 9, 795–801 (1961). 21. James, P. F. Liquid-phase separation in glass-forming systems. J. Mater. Sci.
10, 1802–1825 (1975).
22. Helz, R. Crystallization history of Kīlauea Iki lava lake as seen in drill core
recovered in 1967–1979. Bull. Volcanol. 43, 675–701 (1980).
23. Barth, G., Kleinrock, M. & Helz, R. The magma body at Kīlauea Iki lava lake:
potential insights into mid‐ocean ridge magma chambers. J. Geophys. Res.
Solid Earth 99, 7199–7217 (1994).
24. Zellmer, G. F. et al. Inferring the effects of compositional boundary layers on crystal nucleation, growth textures, and mineral chemistry in natural volcanic tephras through submicron-resolution imaging. Front. Earth Sci. 4, 88 (2016).
25. Morse, S. A. & Brady, J. B. Thermal history of the Upper Zone of the Kiglapait intrusion. J. Petrol. 58, 1319–1332 (2017).
26. Putirka, K. D. Thermometers and barometers for volcanic systems. Rev.
Mineral. Geochem. 69, 61–120 (2008).
27. Helz, R. T. & Thornber, C. R. Geothermometry of Kīlauea Iki lava lake,
Hawaii. Bull. Volcanol. 49, 651–668 (1987).
28. Helz, R. T., Clague, D. A., Sisson, T. W. & Thornber, C. R. in Characteristics of Hawaiian Volcanoes (eds Poland, M. P., Takahashi, T. J. & Landowski, C. M.) Ch. 6 (U.S. Dept. of the Interior, U.S. Geological Survey, 2014).
29. Helz, R. T. Differentiation behavior of Kīlauea Iki lava lake, Kīlauea Volcano, Hawaii: an overview of past and current work. Magmat. Process. Physicochem. Princ. 1, 241–258 (1987).
30. Kirkpatrick, R. J. Crystal growth from the melt: a review. Am. Minerol. 60, 798–814 (1975).
31. Cahn, J. W. In Crystal Growth (ed. Peiser, H. S.) (Pergamon Press, Oxford, 1967).
32. Holness, M. B. The effect of crystallization time on plagioclase grain shape in dolerites. Contrib. Mineral. Petrol. 168, 1076 (2014).
33. Findik, F. Improvements in spinodal alloys from past to present. Mater. Des.
42, 131–146 (2012).
34. Holness, M. B. Melt–solid dihedral angles of common minerals in natural
rocks. J. Petrol. 47, 791–800 (2006).
35. Zhang, Y., Ni, H. & Chen, Y. Diffusion data in silicate melts. Rev. Mineral. Geochem. 72, 311–408 (2010).
36. Kirkpatrick, R. J. Nucleation and growth of plagioclase, Makaopuhi and Alae lava lakes, Kīlauea Volcano, Hawaii. Geol. Soc. Am. Bull. 88, 78–84 (1977).
37. Hammer, J. E. & Rutherford, M. J. An experimental study of the kinetics of decompression-induced crystallization in silicic melt. J. Geophys. Res. Solid
Earth 107, ECV 8-1–ECV 8-24 (2002).
38. Hamann, C., Hecht, L., Ebert, M. & Wirth, R. Chemical projectile–target
interaction and liquid immiscibility in impact glass from the Wabar
craters, Saudi Arabia. Geochim. Cosmochim. Acta 121, 291–310 (2013).
39. Mysen, B. O. The structure of silicate melts. Annu. Rev. Earth Planet. Sci. 11,
75–97 (1983).
40. Fischer, L. A. et al. Immiscible iron- and silica-rich liquids in the Upper Zone of the Bushveld Complex. Earth Planet. Sci. Lett. 443, 108–117 (2016).
41. Bottinga, Y. & Weill, D. F. Densities of liquid silicate systems calculated from partial molar volumes of oxide components. Am. J. Sci. 269, 169–182 (1970).
42. Hou, T. et al. Experimental study of liquid immiscibility in the Kiruna-type Vergenoeg iron–fluorine deposit, South Africa. Geochim. Cosmochim. Acta
203, 303–322 (2017).
43. Drouin, D. et al. CASINO V2.42—a fast and easy‐to‐use modeling tool for
scanning electron microscopy and microanalysis users. Scanning 29, 92–101
(2007).
44. Guilbaud, M. N., Blake, S., Thordarson, T. & Self, S. Role of Syn-eruptive cooling and degassing on textures of lavas from the ad 1783–1784 Laki Eruption, South Iceland. J. Petrol. 48, 1265–1294 (2007).
45. Miller, M. K., Russell, K. F., Thompson, K., Alvis, R. & Larson, D. J. Review of atom probe FIB-based specimen preparation methods. Microsc. Microanal. 13,
428–436 (2007).
46. Larson, D. et al. Field-ion specimen preparation using focused ion-beam milling. Ultramicroscopy 79, 287–293 (1999).
47. Thompson, K., Gorman, B., Larson, D., van Leer, B. & Hong, L. Minimization of Ga induced FIB damage using low energy clean-up. Microsc. Microanal. 12, 1736–1737 (2006).
48. Larson, D. J., Prosa, T., Ulfig, R. M., Geiser, B. P. & Kelly, T. F. Local Electrode Atom Probe Tomography. (Springer Science, New York, US, 2013). 49. Exertier, F. et al. Atom probe tomography analysis of the reference zircon gj-1:
an interlaboratory study. Chem. Geol. 495, 27–35 (2018). Acknowledgements
V.C.H. is funded by an NERC DTP studentship project (Grant Ref: NE/L002507/1). B.C. is a Research Associate of the Belgian Fund for Scientific Research-FNRS. We are grateful to Iris Buisman and Giulio Lampronti at the University of Cambridge and Niels Jöns at the Ruhr-Universität Bochum for SEM and EPMA help and advice. M.M.J. thanks Linda Davis and Mary Hodges at Idaho National Laboratory for sampling of the Sugar City drill core and additional support was provided by the Alexander von Humboldt Research Fellowship for Postdoctoral Researchers to M.M.J. This manuscript was significantly improved following thorough and constructive reviews by Steve Parman, Malcolm J Rutherford and an anonymous reviewer.
Author contributions
V.C.H., M.B.H., B.C. and O.N. initiated the project. R.T.H., J.M. and M.M.J. provided samples, sample descriptions and discussions about the paper. V.C.H. carried out the image analyses of the samples, SEM and EPMA work, APT data analysis and wrote the majority of the paper. O.N. carried out EPMA analyses of the samples and assisted in discussions with B.C. interpreting the data. T.J.P. and I.M. performed data analysis and data reduction of APT data. S.C.P. assisted with APT data analysis, interpretation and extensive discussions revising the manuscript. M.B.H. supervised the project and edited the manuscript. All authors reviewed and approved this paper.
Competing interests
The authors declare no competing interests. Additional information
Supplementary informationis available for this paper at https://doi.org/10.1038/s41467-019-12694-5.
Correspondenceand requests for materials should be addressed to V.C.H. Peer review informationNature Communications thanks Stephen Parman, Mac Rutherford and other, anonymous, reviewer(s) for their contribution to the peer review of this work. Peer reviewer reports are available.
Reprints and permission informationis available athttp://www.nature.com/reprints
Publisher’s note Springer Nature remains neutral with regard to jurisdictional claims in published maps and institutional affiliations.
Open Access This article is licensed under a Creative Commons Attribution 4.0 International License, which permits use, sharing, adaptation, distribution and reproduction in any medium or format, as long as you give appropriate credit to the original author(s) and the source, provide a link to the Creative Commons license, and indicate if changes were made. The images or other third party material in this article are included in the article’s Creative Commons license, unless indicated otherwise in a credit line to the material. If material is not included in the article’s Creative Commons license and your intended use is not permitted by statutory regulation or exceeds the permitted use, you will need to obtain permission directly from the copyright holder. To view a copy of this license, visithttp://creativecommons.org/ licenses/by/4.0/.