J. Mater. Environ. Sci., 2018, Volume 9, Issue 4, Page 1140-1151 https://doi.org/10.26872/jmes.2018.9.4.25 http://www.jmaterenvironsci.com! Journal(of(Materials(and(( Environmental(Sciences( ISSN(:(2028;2508( CODEN(:(JMESCN( Copyright(©(2018,( University(of(Mohammed(Premier(((((( (Oujda(Morocco(
Technological behaviour of Cretaceous and Pliocene clays of northern
Morocco used in fired brick manufacturing
M. El Ouahabi
1*, L. Daoudi
2, N. Fagel
1,
1 UR Argile, Géochimie et Environnement Sédimentaires (AGEs), Département de Géologie B.18, Sart-Tilman, Université
de Liège, Liége, B-4000, Belgium
2* Département de géologie, faculté des Sciences et Techniques, University Cadi Ayyad, BP 549, Marrakech, Morocco
1. Introduction
Bricks are the best-known type of building materials [1, 2]. The customer is primarily interested in appearance, thickness, durability and few or no flaws. The suitability of a clay source material for the manufacture of a structural clay product depends principally on its behaviour during forming (shaping), drying and firing. This behaviour will determine the final properties of the brick, including its porosity and durability [3].
The brick manufacturing process requires the monitoring of three main steps: drying, firing and sintering process. Brick bodies must be dried before firing; the drying time can vary from 18 to 60 hours, depending on the nature and the moisture content of the green ware body. Distortion and cracking can occur if the drying process is too rapid or the internal thermal gradient is too high; therefore, the drying process must be carefully controlled [3, 4]. The specific surface area (SSA) has been used extensively to interpret physical characteristics such as shrink-swell potentials [5] as well as the Atterberg limits [6]. This information appears quite fundamental, because it relates to the thickness and arrangement of particles and, in consequence, the swelling behaviour resulting from the interaction of water with the particles surface [7]. The specific surface area of the clay raw material indicates the water quantity needed in the brick moulding process [8].
Firing is also a significant step during the brick manufacturing process where, under the influence of heat effect, sintering occurs to bind the clay particles. This improves durability and strength of clay bricks with respect to the unfired ones[1]. Bricks may then be expected to meet specific water absorption, fire resistance and thermal insulation criteria[3]. Transformations in the firing profile can be divided into two processes: carbonate decomposition and phase transformation. The decomposition and phase transformations influence the evolution and intensity of the sintering process [9]. These transformations are accompanied by shrinkage and weight loss
Abstract
Northern Morocco has an important local ceramic industry. Twenty-three Craterous and Pliocene clays from Tangier area (Northern Morocco) were studied to test their suitability as raw material for fired brick production. To assess their behaviour, the chemical composition, specific surface area (SSA), cation exchange capacity (CEC), and apparent density of clays were determined. The chemical composition consisted mainly of SiO2 (32 – 60%), Al2O3 (7 – 30%), and CaO (0.5 – 32%). SSA and CEC
values of all the samples were low. The apparent density, pore volume, and micropore values were almost similar. Clay bricks were prepared by forming and shaping, and then fired in the range of 800 – 1100°C. Firing shrinkage, loss on mass and water absorption capacity were done in order to characterize clays after firing.Most of the clay samples have the necessary properties for the manufacturing of brick products. However, some clay samples were above the norm of loss on weight, due mainly to their high amount of carbonates. Furthermore, some kaolinitic samples from Pliocene blue marls and Cretaceous marls are inappropriate for building-related brick fabrication, because of the development of portlandite in brick, when in contact with moisture of the air. However, it will be necessary to mix them with other clays with little or no carbonate to dilute their carbonates content and then enhance their workability.
Received 24 Oct 2016, Revised 26 Dec 2016, Accepted 24 Dec 2016 Keywords !!Morocco, !!Tangier, !!Industrialclays, !!Fired bricks properties,
!!Technological behaviour
!
[email protected] Tel: +32. (0)4. 366.2210
of the fired clay bodies. The firing shrinkage indicates the degree of densification during sintering, and is very important for the dimensional control of the finished ceramic products.
In Morocco, semi-industrial and traditional fired bricks production doesn’t take into account the chemical and mineralogical characteristics. Very limited studies on the quality and potential use of Moroccan clays have been done, although clayey material is a primary material for local ceramic manufacturers. In the northern east region of Morocco, traditional fired clay bricks are important construction materials, especially in Tangier region. The manufacturers use the nearby clays from Cretaceous and Pliocene outcrops located around the city of Tangier. Artisans reported improper brick production due to lack of knowledge of firing cycle and technological properties. The mineral composition of these clay materials was characterized in a previous study [10]. Tangier clays were diversified and consisted mostly of quartz, calcite, kaolinite, and illite. In addition, vermiculite and smectite were present in some of the studied samples. It is known that ball clays are the most suitable for structural ceramic production [3]. It was found that montmorillonite or illite confer high plasticity and high shrinkage and tend to be non-refractory, with a short vitrification range, while aluminum hydroxide or kaolinite confer refractory properties and have a long vitrification range[11].Clays rich in smectite and vermiculite are characterized by swelling behaviour due to high moisture retention ability than other clay minerals. In practice, clays with a high amount of smectite are used in tile and bricks making as additives to enhance plasticity of too lean clay bodies [12].
The aim of this work is to study the suitability of groups of clay raw materials having diverse clay mineralogical composition in building bricks production. The clay samples belong to different outcrops of different ages (Table 1)[10]. The clayey materials belonged mainly to Cretaceous and Pliocene clays. The behaviour for brick-making was studied according to their dominant clay mineral.
2. Material
Twenty-three clay samples were collected from the Tangier area, located in the Tangier Unit in the Rif domain of Morocco (Fig. 1). From the east of the town of Tangier, the samples were taken from marly limestone and clay facies, while in the western area, the samples were collected from Pliocene sandy marls and Upper Tortonian blue marls.
Figure 1: Location and geological map of the study area (modified after Saadi et la., 1980 [55]).!
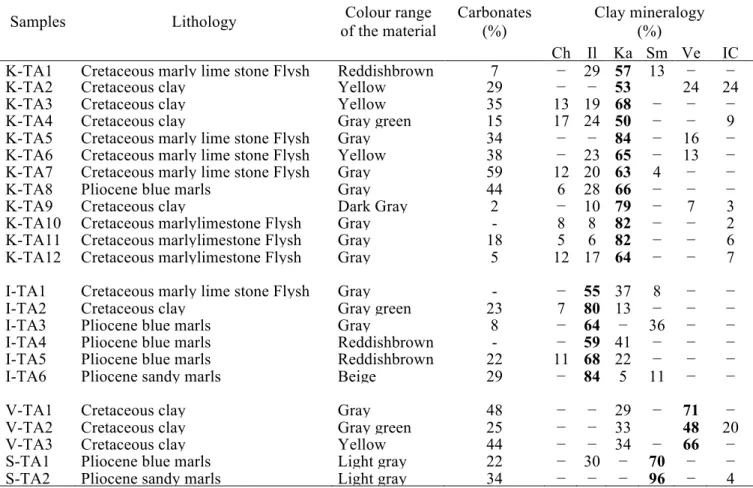
Based on the abundance of clay minerals, three groups of clay samples were distinguished: kaolinitic, illitic, and smectitic and vermicultic clays. The kaolinitic clays were divided into two sub-groups: kaolinitic clays-a, which were rich in carbonates and kaolinitic clays-b (Table 1). The samples were marked as follows: TA stands for Tangier region, K for kaolinite, I for illite, S for smectite and V corresponds to Vermiculite.
3. Experimental
Specific surface area was characterized by the analysis of nitrogen adsorption–desorption isotherms, performed at 77 K. The measurements were performed using a sorptomatic Carlo Erba 1900, controlled by a computer.
Table 1: Description of the studied samples: Ch: chlorite; Il: illite; Ka: kaolinite; Sm: smectite; Ve: vermiculite; IC: interstratified clay minerals [10].
Samples Lithology Colour range
of the material Carbonates (%) Clay mineralogy (%) Ch Il Ka Sm Ve IC
K-TA1 Cretaceous marly lime stone Flysh Reddishbrown 7 − 29 57 13 − −
K-TA2 Cretaceous clay Yellow 29 − − 53 24 24
K-TA3 Cretaceous clay Yellow 35 13 19 68 − − −
K-TA4 Cretaceous clay Gray green 15 17 24 50 − − 9
K-TA5 Cretaceous marly lime stone Flysh Gray 34 − − 84 − 16 −
K-TA6 Cretaceous marly lime stone Flysh Yellow 38 − 23 65 − 13 −
K-TA7 Cretaceous marly lime stone Flysh Gray 59 12 20 63 4 − −
K-TA8 Pliocene blue marls Gray 44 6 28 66 − − −
K-TA9 Cretaceous clay Dark Gray 2 − 10 79 − 7 3
K-TA10 Cretaceous marlylimestone Flysh Gray - 8 8 82 − − 2
K-TA11 Cretaceous marlylimestone Flysh Gray 18 5 6 82 − − 6
K-TA12 Cretaceous marlylimestone Flysh Gray 5 12 17 64 − − 7
I-TA1 Cretaceous marly lime stone Flysh Gray - − 55 37 8 − −
I-TA2 Cretaceous clay Gray green 23 7 80 13 − − −
I-TA3 Pliocene blue marls Gray 8 − 64 − 36 − −
I-TA4 Pliocene blue marls Reddishbrown - − 59 41 − − −
I-TA5 Pliocene blue marls Reddishbrown 22 11 68 22 − − −
I-TA6 Pliocene sandy marls Beige 29 − 84 5 11 − −
V-TA1 Cretaceous clay Gray 48 − − 29 − 71 −
V-TA2 Cretaceous clay Gray green 25 − − 33 48 20
V-TA3 Cretaceous clay Yellow 44 − − 34 − 66 −
S-TA1 Pliocene blue marls Light gray 22 − 30 − 70 − −
S-TA2 Pliocene sandy marls Light gray 34 − − − 96 − 4
The analysis of the isotherms was performed according to the methodology of Lecloux (1981)[13], which provides specific surface area (SBET), micropores volume calculated by the Dubinin–Radushkevich equation (VDUB) and total pore volume calculated from the adsorbed volume at saturation (Vp). Bulk density (ρs) was determined by helium pycnometry on the powdered sample, using Micromeritics Accupyc 1330. Textural analysis (SBET, VDUB and Vp) was done in the laboratory of Industrial Chemistry (Department of Chemistry, ULg)
Cation exchange capacity (CEC) was measured using the Schollenberger method [14]. The samples were first saturated with ammonium acetate (1N) and then the ammonium ions in the supernatant were deprotonated into ammonia with sodium hydroxide solution (0.1N). The ammonia content was determined by distillation into a known amount of acid and back-titrated by the Kjeldahl method [15].
The concentration of major elements (Si, Al, Fe, Ca, Mn, Mg, Na, K, Ti, P, and S) in the samples was measured on 2 g of dried and homogenized loose powder using a Bruker S8 Tiger wavelength-dispersive X-Ray Fluorescence (WD-XRF) spectrometer equipped with an Rh anticathode. Calibration was made using 35 commercially available certified reference materials of similar matrix (sedimentary rocks, river, lake and marine sediments, sands, and soils). The accuracy ranged from 3 to 7% except for S (25%) and P (20%). Reproducibility is above 99% except for S (89%) and P (97%). More details about the method and the calibration can be found in [16]. Later, the same powder samples were heated to 1000°C for 2h to determine the Loss on Ignition (LOI).
Differential scanning calorimetry (DSC) and thermogravimetry (TG) were conducted simultaneously using a NETZSCH STA 409 PC instrument (Industrial Chemistry, Department of Chemistry, ULg). Samples were heated from room temperature to 800°C at 10°C min-1 under atmospheric air[17].
Technological testing consisting of a simulation of the industrial process was performed on a laboratory scale. After drying, the samples were ground by crushing (<2 mm),and then each clay sample was wetted with distilled water to obtain homogeneous paste in order to achieve the proper plasticity for modelling. They were left to rest for 24 h in sealed nylon bags to obtain homogenous moist distribution. Then the paste was made by hand in a mold. The samples obtained with these shaping techniques were4cm long, 2cm wide and 2cm thick. These samples were then dried in a shaded and ventilated room. Their mass and dimensions (measured diagonally) were measured to calculate the drying shrinkage following different drying times.
The dried samples (48 h in a shaded room, and then during 12 h at 105°C in oven) were kiln-fired at different temperatures (800, 850, 900, 950, 1000, 1050, and 1100°C) over 1h.The linear contraction (LC) was calculated as LC (%) = (Li– Lf)/Li×100, where: LC - linear contraction (%); Li - initial length of the specimen; Lf- final length of the specimen. The water absorption capacity (WAC) was determined in fired clay pieces after each heating cycle, according to standard procedure UNE [18].After preliminary measurements at the end of firing and cooling, the bodies of each lot were kept dry in an oven until being subjected to water absorption. Each dry and cooled specimen was weighed (P1) and then immersed into clean water at 25°C for 24 h. The specimens were removed from the water, their surfaces were wiped off and the weight (P2) of each was measured immediately. The water absorption capacity (WAC) was calculated as WAC (%) =(P2−P1)/P1×100.
The analysis of mineralogical phases of the fired samples was carried out by X-ray diffraction (XRD, Bruker D8-Advance diffractometer with CuKα radiations) on powdered bulk. Diffraction patterns were recorded between 2 − 45° 2θ at a step size of 0.02° 2θ. The X-ray powder patterns were treated by the DIFFRACplus EVA software to remove the background noise and to calculate profile parameters such as line position and intensity peak.
4. Results and discussion
4.1.! Physico-chemical properties
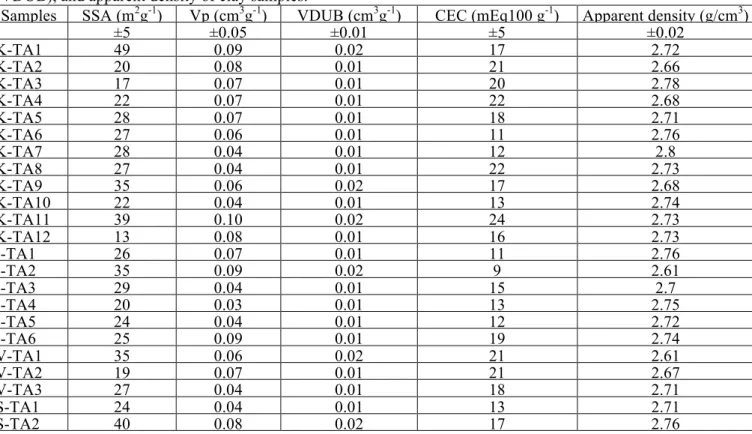
The physico-chemical properties of the ceramic materials to be produced depend highly on the raw clay composition [19] and the textural properties (SSA, CEC, pore volume, micropore values and apparent density). The specific surface area (SSA) of the clay samples analyzed here was quite variable, and ranged from 13 to 49 m2g-1 (Table 2).
Table 2: Cation exchange capacity (CEC), Specific surface area (SSA), pore volume (Vp), micropore values (VDUB), and apparent density of clay samples.
Samples SSA (m2g-1) Vp (cm3g-1) VDUB (cm3g-1) CEC (mEq100 g-1) Apparent density (g/cm3)
±5 ±0.05 ±0.01 ±5 ±0.02 K-TA1 49 0.09 0.02 17 2.72 K-TA2 20 0.08 0.01 21 2.66 K-TA3 17 0.07 0.01 20 2.78 K-TA4 22 0.07 0.01 22 2.68 K-TA5 28 0.07 0.01 18 2.71 K-TA6 27 0.06 0.01 11 2.76 K-TA7 28 0.04 0.01 12 2.8 K-TA8 27 0.04 0.01 22 2.73 K-TA9 35 0.06 0.02 17 2.68 K-TA10 22 0.04 0.01 13 2.74 K-TA11 39 0.10 0.02 24 2.73 K-TA12 13 0.08 0.01 16 2.73 I-TA1 26 0.07 0.01 11 2.76 I-TA2 35 0.09 0.02 9 2.61 I-TA3 29 0.04 0.01 15 2.7 I-TA4 20 0.03 0.01 13 2.75 I-TA5 24 0.04 0.01 12 2.72 I-TA6 25 0.09 0.01 19 2.74 V-TA1 35 0.06 0.02 21 2.61 V-TA2 19 0.07 0.01 21 2.67 V-TA3 27 0.04 0.01 18 2.71 S-TA1 24 0.04 0.01 13 2.71 S-TA2 40 0.08 0.02 17 2.76
The CEC values of the samples were low and within a similar range from 9 to 22 meq/100 g. Pore volume, micropore, and apparent density values were almost similar for all clays (Table 2). Generally, kaolinitic and some illitic and vermiculitic clay samples showed the lowest CEC and SSA values. According to the literature [20-23], kaolinite has a lower SSA value (10 – 20 m2g-1) than illite (65 – 100 m2g-1) and smectite (50 – 800 m2g -1).The variability of SSA and CEC between samples is due to variable argillaceous clay fractions, the clay mineralogy and the particle-size distribution [24, 25]. The higher specific surface area of some clays (S-TA2, K-TA11 and K-TA1) indicates the need for more water being used in the brick shaping process.
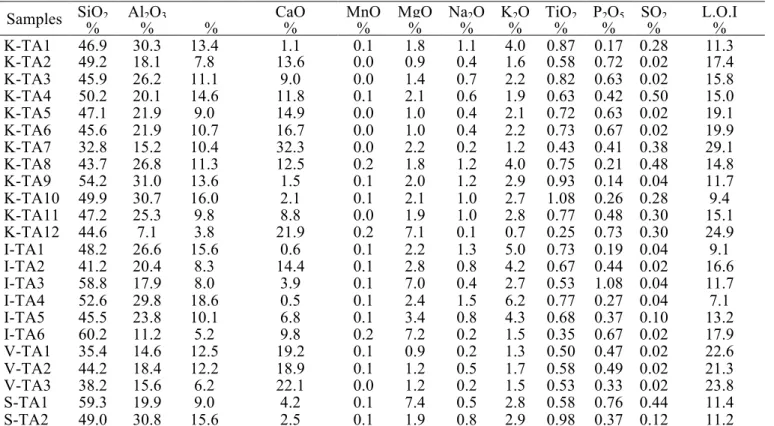
The chemical composition of the samples is presented in Table 3. In all of the samples SiO2 (32.8 – 60.2%) and Al2O3 (7.1 – 30.9%) are the major components, because of the presence of clay minerals and quartz [10]. Fe2O3 is also a main constituent, especially, in the smectitic (8.9 – 15.6%) and illitic clays (5.2 – 18.6%). CaO is
another major component, in the vermiculitic clays (18.9 – 22.1%) and kaolinitic clays (1.1 – 32.3%). Alkali oxides (K2O, Na2O) are mostly present in smaller amounts, varying between 0.7 – 6.2% and 0.08 – 1.46%, respectively, for K2O and Na2O. The most marked values of K2O (1.5 – 6.2%) are present in the illitic clays [26, 27]. A relatively high MgO (2.2 – 7.2%) content is also present in the illitic clays, S-TA1 and K-TA12. All clays show a significant LOI, especially for samples rich in CaO; this loss on ignition is associated to carbonate decomposition [28, 29], and clay dehydroxylation.
Table 3: Chemical analysis (wt. %). LOI: Loss On Ignition.
Samples SiO2 AlFe22OO33 CaO MnO MgO Na2O K2O TiO2 P2O5 SO2 L.O.I
% % % % % % % % % % % % K-TA1 46.9 30.3 13.4 1.1 0.1 1.8 1.1 4.0 0.87 0.17 0.28 11.3 K-TA2 49.2 18.1 7.8 13.6 0.0 0.9 0.4 1.6 0.58 0.72 0.02 17.4 K-TA3 45.9 26.2 11.1 9.0 0.0 1.4 0.7 2.2 0.82 0.63 0.02 15.8 K-TA4 50.2 20.1 14.6 11.8 0.1 2.1 0.6 1.9 0.63 0.42 0.50 15.0 K-TA5 47.1 21.9 9.0 14.9 0.0 1.0 0.4 2.1 0.72 0.63 0.02 19.1 K-TA6 45.6 21.9 10.7 16.7 0.0 1.0 0.4 2.2 0.73 0.67 0.02 19.9 K-TA7 32.8 15.2 10.4 32.3 0.0 2.2 0.2 1.2 0.43 0.41 0.38 29.1 K-TA8 43.7 26.8 11.3 12.5 0.2 1.8 1.2 4.0 0.75 0.21 0.48 14.8 K-TA9 54.2 31.0 13.6 1.5 0.1 2.0 1.2 2.9 0.93 0.14 0.04 11.7 K-TA10 49.9 30.7 16.0 2.1 0.1 2.1 1.0 2.7 1.08 0.26 0.28 9.4 K-TA11 47.2 25.3 9.8 8.8 0.0 1.9 1.0 2.8 0.77 0.48 0.30 15.1 K-TA12 44.6 7.1 3.8 21.9 0.2 7.1 0.1 0.7 0.25 0.73 0.30 24.9 I-TA1 48.2 26.6 15.6 0.6 0.1 2.2 1.3 5.0 0.73 0.19 0.04 9.1 I-TA2 41.2 20.4 8.3 14.4 0.1 2.8 0.8 4.2 0.67 0.44 0.02 16.6 I-TA3 58.8 17.9 8.0 3.9 0.1 7.0 0.4 2.7 0.53 1.08 0.04 11.7 I-TA4 52.6 29.8 18.6 0.5 0.1 2.4 1.5 6.2 0.77 0.27 0.04 7.1 I-TA5 45.5 23.8 10.1 6.8 0.1 3.4 0.8 4.3 0.68 0.37 0.10 13.2 I-TA6 60.2 11.2 5.2 9.8 0.2 7.2 0.2 1.5 0.35 0.67 0.02 17.9 V-TA1 35.4 14.6 12.5 19.2 0.1 0.9 0.2 1.3 0.50 0.47 0.02 22.6 V-TA2 44.2 18.4 12.2 18.9 0.1 1.2 0.5 1.7 0.58 0.49 0.02 21.3 V-TA3 38.2 15.6 6.2 22.1 0.0 1.2 0.2 1.5 0.53 0.33 0.02 23.8 S-TA1 59.3 19.9 9.0 4.2 0.1 7.4 0.5 2.8 0.58 0.76 0.44 11.4 S-TA2 49.0 30.8 15.6 2.5 0.1 1.9 0.8 2.9 0.98 0.37 0.12 11.2
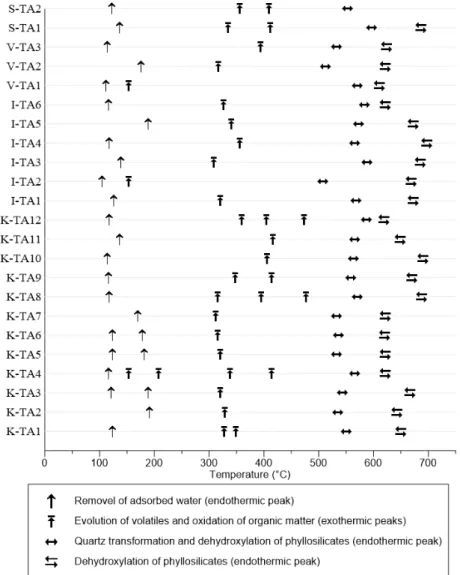
The amount of silica and aluminum have a decisive influence on the mechanical resistance of the final products [30]. The presence of silica prevents cracking, shrinking, and warping of raw bricks and also provides uniform shape to the bricks (Rajput, 2004). The relatively high amount of Fe2O3 gives a red colour after firing. However, Fe2O3 is not the only factor responsible for the coloration of ceramic wares. Similarly, TiO2 is also responsible for the dark colour. CaO, K2O and MgO are alkali and alkaline earth metals acting as flux in relation to clay minerals, they reaction with increasing temperature results in liquid phase at lower temperature than that of melting. The alkali and alkaline oxides can induce early vitrification, increase the firing shrinkage, and decrease the firing temperature, with a corresponding energy saving [31, 32]. The DTA results for the Tangier clay samples (Table 4 and Fig. 2) revealed that endothermic peak shown around 95 to 150°C was due to the release of adsorbed water [33]. The broad exothermic peak in the temperature region 243 − 450°C is due to the combustion of organic materials present in the clay samples [34], the organic matter content was ranging between 0.96 to 3.50%.
The endothermic peaks at 500 – 700°C, with a maximum at 540 and 650°C, are due to the dehydroxylation of clays, specifically kaolinite [35, 36]. The TG curves of Tangier clays (Table 4) show a slight mass loss below 150°C, associated with the loss of loosely adsorbed water. A small mass loss was observed between 243 − 450°C and a slight mass loss (2.74 − 7.78%) was observed between 500 and 550°C, followed by a major mass loss (3.16 − 7.73%) event between 600 − 700°C. The main mass loss for the non-calcareous clay resulted from dehydroxylation of clays [37]. In general, both kaolinite and illite are dehydroxylated at 450 – 550°C [38], while smectites are dehydroxylate in the range of 500 – 550ºC and 600 – 700ºC depending on its composition and the cis/trans vacancies [39].
4.2.! Drying behaviour
The drying capacities suggested by the Bigot curves [40] for the investigated clays were carried out by
drying results obtained in laboratory simulation by drying in air for 48 h. Bigot's curve is mainly used
as preliminary indicators in the choice of raw materials for ceramic industry [41-43]. Bigot’s curves
expressed by mass loss in terms of drying shrinkage variation and critical points (Kt) coordinates are
given in Fig. 3 [42, 44].
Figure 2: Schematic representation of clay samples transformation by thermogravimetric and differential thermal analysis (TG – DTA).
The drying process behaves differently for the three categories of clay. The Bigot's curves exhibit the two characteristic phases of the drying process: the first one is characterized by initial weight loss associated with shrinkage and the second successive phase is marked by weight loss with no further shrinkage (Fig.3). The kaolinitic clays show a larger variation in behaviour during the first phase of drying, where we can see two categories of behaviours. The first one (kaolinitic clays-a) has a mass loss between 5 and 10%; and shrinks 9%during the first phase of Bigot’s diagram (Fig.3). Kaolinitic clays-b) lose 4 to 13% of their mass, while showing between 4 and 12% of shrinkage. The illitic clays lose between 2 and 15% of weight and shrink by 15%.Vermiculitic and smectitic clays show a larger weight loss (5 - 15%), with a slight shrinkage ranging between 7 and 9%.All the clay bodies stabilized between 20 and 27% weight loss during the second drying phase. The highest drying shrinkage value occurred in K-TA7 (15%), which caused a crack on the body surface, is mainly due to fine grain size of the most Kaolinitic clays-b[9]. There were also small cracks in some smectitic and vermicultic clays (S-TA1 and V-TA2), due to the presence of swelling minerals. Drying shrinkage occurs when grains are approaching each other. In the first time of drying, each particle in the body is separated by water film. The water film becomes thinner until the “critical point”, at which the rate of drying and shrinkage sharply change, and the particles come into contact, occupying the open space left by the released water[43, 44].The samples having the high drying shrinkage need sand addition to decrease the drying shrinkage and to prevent cracks. In this way, the reduction in the drying shrinkage brings several advantages; these are: a faster drying process, a decrease in energy consumption, and a smaller risk of developing cracks and dimensional effects [30].
Table 4: The mass losses (%) registered on TG curves.
Figure 3: Bigot’s diagram of the examined clay samples,Kt: critical point
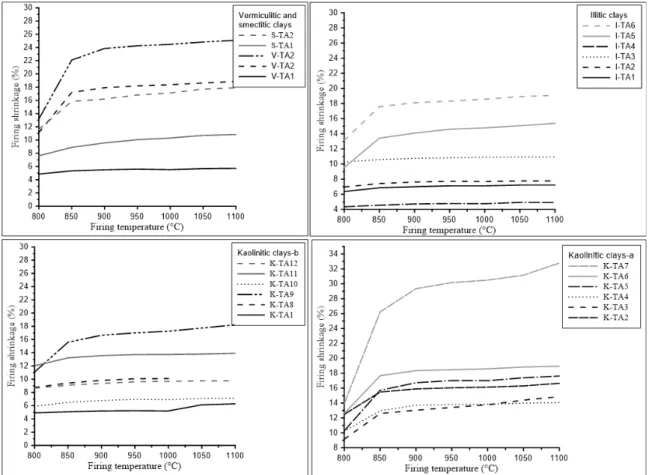
4.3.! Firing behaviour
The sintered specimens (Fig. 4) showed an increase in firing shrinkage with increasing firing temperature for all samples. However, the sintered clay samples showed a more significant increase in shrinkage at higher firing temperatures. The firing shrinkage behaves differently below and above 950°C. This is related to the distinct sintering mechanisms in these temperature ranges. Between800and950°C, there is a small firing shrinkage (0–
Samples Endothermic peak (95 − 150°C) Exothermic peak (243 − 450°C) Endothermic peak (500 − 550°C) Endothermic peak (600 − 700°C) K-TA1 0.87 2.57 5.52 7.61 K-TA2 1.26 1.99 4.04 5.85 K-TA3 1.35 2.14 5.09 7.29 K-TA4 0.35 1.23 3.31 4.45 K-TA5 0.71 2.45 4.62 6.50 K-TA6 1.59 2.52 3.34 6.04 K-TA7 0.67 1.68 2.80 4.61 K-TA8 0.98 1.75 4.68 6.42 K-TA9 0.93 2.16 4.34 6.00 K-TA10 0.81 1.76 4.17 5.67 K-TA11 0.83 2.20 4.41 6.02 K-TA12 0.32 0.96 2.51 4.05 I-TA1 0.25 1.34 5.97 5.76 I-TA2 0.71 1.31 3.06 3.85 I-TA3 0.72 1.44 3.81 4.47 I-TA4 0.64 1.31 3.65 5.20 I-TA5 0.78 1.07 2.74 3.98 I-TA6 0.89 1.95 3.89 5.52 V-TA1 0.95 3.49 5.23 7.73 V-TA2 0.78 1.53 2.41 4.48 V-TA3 0.67 1.99 3.12 5.08 S-TA1 0.30 1.14 3.07 3.16 S-TA2 0.75 1.90 7.78 −
3.3%).At this temperature the clay structures break down and the vitreous phases begin to form, and moreover, thermal decomposition of carbonates occurs. Above 1000°C, the curves of firing shrinkage show an increase in firing shrinkage. By comparing firing temperatures of 1000 and 1100°C, the firing shrinkages of illitic, smectitic and vermicultic, kaolinitic–a, and kaolinitic–b clays increased from 3.2 to 8.1%, 2.7 to 7%, 2.5 to 9.4% and 6.3 to 9.4%, respectively. This sudden change is associated with a more significant liquid phase formation.
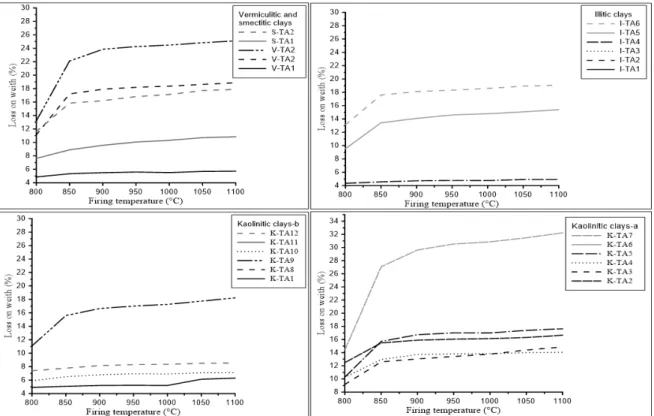
The presence of quartz in clay samples will decrease the firing shrinkage [45]. Related to the transition of alpha to beta-quartz involves a volume increase, on cooling when the reversible reaction back to alpha quartz takes place it leaves open space on the sintered clay. Shrinkage may increase in the presence of alkali, iron, and alkali earths [46], This is due to the formation of a liquid phase, which leads to the densification of the ceramic pieces. With regard to geochemistry (Table 3), illitic, smectitic, and some kaolinitic clays have high alkaline fluxes (K2O + Na2O), which stem from smectite, micaceous minerals, and feldspars contained in the kaolinitic clays.It can be seen that the shrinkage at 1100°C tends to be slightly lower for most of the clay samples, except for kaolinitic clay-b, vermiculitic clays, and I-TA2, due to their high FeO content, which resulted in the densification (Table 3). Normally, a good quality brick exhibits a total shrinkage below 8% [47], and most of the Tangier clays have shrinkage values from 2.7 to 7.7%, which are within the limits for industrial brick production. As an exception, K-TA11 and K-TA12 are slightly above the limit, with a firing shrinkage value of 9.4%. Increasing the firing temperature resulted in an increase in brick weight loss, related to the evolution of volatiles and the sintering of specimens, which are characterized by the transformation of the crystalline phases (Fig. 5).
Figure 4: Influence of firing temperature on the shrinkage.
While it is well known that brick weight loss depends on the inorganic substances in clay being burnt off during the firing process [8]. A significant weight loss is observed up to 850°C for most of the clay samples and thereafter we note a slight increase in loss in weight of the fired specimens. At 1100°C, there is a wide variation in loss on mass from 4.9 to 32.8%. This high loss on weight is observed particularly for K-TA6 (18.9%), K-TA9 (18.2%), I-TA6 (19.1%), V-TA3 (25.1%), and K-TA7 (32.8%), which is due to the high content of CaO (Table 3). The loss of weight criterion for clay brick is 15% [48], and most of the bricks made for this study meet the weight loss criterion, except for some kaolinitic clays (K-TA5, K-TA6, K-TA7, K-TA9, and K-TA12), vermiculitic clays (V-TA2 and V-TA3), S-TA2 and I-TA6 which are above the norm. However, it might be useful to mix these raw clays with other non-calcareous ones, or to add additives in order to dilute their carbonate content and subsequently reduce their weight loss. During the heatingat 1000°C, the TA8 and K-TA7 sintered sample (from Pliocene blue marls and Cretaceous marls, respectively) showed small white grains
(∼1 mm) that were discernable with the naked eye, and also a domed surface (Fig. 6). A white film of carbonate covered the upper surface of the K-TA8 and K-TA7 fired bricks at 1000°C and a small crack was observed. This surface deformation and cracks development can be explained by the reduction of the porosity, which is related to carbonate decomposition and the formation of CaO. Furthermore, the hydration of CaO can cause the expansion and the initiation of cracks.
Figure 5: Firing temperature in terms of the loss on weight variation.
Figure 6: Powder X-ray diffraction patterns of K-TA8 heated bricks.
If the gases do not have sufficient time to diffuse into or out of the brick during firing, the brick bloats[49].To explain the formation of small white grains at the surface of the fired brick, K-TA8 specimens sintered at different temperatures were analysed by XRD in powder form. The white grains were identified as hydrated calcium carbonates. The X-ray diffraction patterns of the fired K-TA8 also show greigite (Fe2+Fe3+2S4) formation from 950°Cwithhighpeakintensity at 1000°C(Fig. 6).The spinel phase is formed at 950°C, followed by cristobalite formation at 1000°C. Hematite is detected at 1100°C. Small white grains were identified as hydrated calcium carbonates (Ca(OH)2), which results from the combination of CaO and H2O at high temperature to form Ca(OH)2, where the Ca is present originally as calcium carbonate in the raw clays. The calcium carbonate CaCO3 is transformed to CaO at higher temperature. Carbonate decomposition triggers shrinkage of the brick[50]. In contact with the moisture of the air, burnt lime (CaO) easily transforms into portlandite according to the following reaction [51]:
CaO(s) + H2O (1) → Ca(OH)2(s)
This process generates crystallization pressure in confined spaces, because the brick pores are occupied by CaO, which leads to cracks development (Table 5).
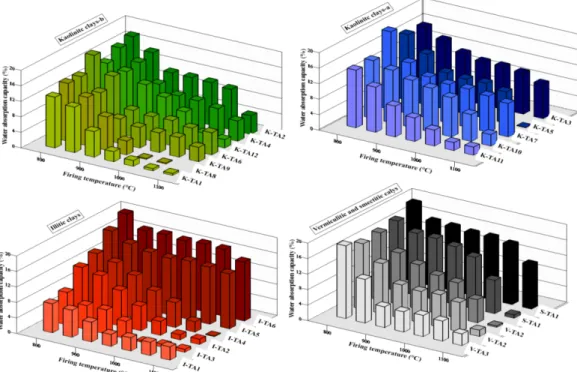
It can be assumed that Ca and H2O have combined to form portlandite during heating. CaO is slightly high in concentration in this raw clay, about 12.5 and 32.3wt%, respectively, for K-TA8 and K-TA7 (Table 3). To make the K-TA8 and K-TA7 clays suitable for brick manufacture, the carbonates content must be diluted by blending these two clays with little or no calcareous clays. Another solution can be to heat these clays at lower temperature (below 950°C) to avoid the formation of lime (CaO).Water absorption capacity is an important factor affecting the durability of bricks. The less water that infiltrates the brick affects their resistance and durability. Water absorption is measured to investigate the extent of densification in the fired body and also used as an expression for the open pores. The results indicated that water absorption is a function of firing temperature (Fig. 7). For all clays, the water absorption values decreased when the firing temperature increased, because of the vitrification of the clay. An increase in sintering temperature causes a decrease in total-pore space in the structure, and then decrease the permeability [52]. Water absorption is related to the open pores, and then is related to densification. The water absorption of the clays decreases sharply above the temperature of 1000°C (Fig. 7), due to the sintering and the formation of the glassy phase. At 1100°C, a remarkable decrease of water absorption is observed. Most of the clays have values from 0.1 to 8.9% at this firing temperature.
Figure 7: Variation in water absorption with firing temperature.
As exceptions, I-TA6, I-TA5, and S-TA2 have high water absorption capacities of 15.2%, 14.2%, and 11.4%, respectively. The variations observed in the water absorption capacity are partly due to the variation in chemical composition (Table 2). The high water absorption for I-TA6 is related to small amounts of flux (Na2O and K2O), which reflects high permeability associated with high porosity.Above 1100°C, the densification behaviour of the clay is influenced by the presence of flux materials such as K2O, Na2O, Fe2O3, and CaO in the raw clays, which may contribute to vitrification [53, 54].According to Milheiro et al., 2005 [9], the acceptable values of water absorption are lower than 25% for bricks and lower than 20% for roofing tiles, and all of the Tangier clays here show acceptable values for both bricks and tiles above 1100°C.
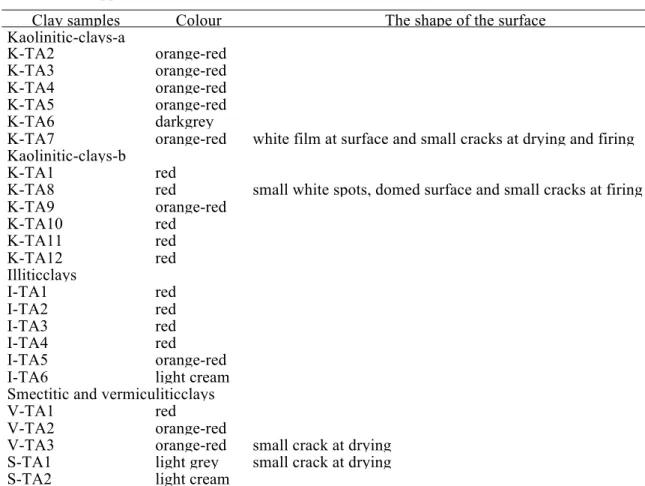
4.4.!The appearance of bricks bodies
The colour and appearance of the fired ceramic pieces were examined at 1000°C (Table 5). The colour of the bricks have not been compared to standards colour charts, they are made by our subjective observation. Most of the fired brick pieces were red or orange red due to the high amount of iron oxide in the clays (Table 3).A light cream or grey colour is observed in I-TA6, S-TA2, and S-TA1. The light colour is due to the presence of small amount of FeO and CaO, which give a buff/yellow colour. Most of the brick pieces do not show any aesthetic default, with the exception of the appearance of some white spots in K-TA8 and a fine film of carbonates on the surface of K-TA8 fired brick. It should also be noted the persistence of cracks formed during the drying process for V-TA3 and S-TA1.
Table 5: The appearance of the brick bodies at 1000°C.
Clay samples Colour The shape of the surface
Kaolinitic-clays-a K-TA2 orange-red K-TA3 orange-red K-TA4 orange-red K-TA5 orange-red K-TA6 darkgrey
K-TA7 orange-red white film at surface and small cracks at drying and firing Kaolinitic-clays-b
K-TA1 red
K-TA8 red small white spots, domed surface and small cracks at firing
K-TA9 orange-red K-TA10 red K-TA11 red K-TA12 red Illiticclays I-TA1 red I-TA2 red I-TA3 red I-TA4 red I-TA5 orange-red
I-TA6 light cream
Smectitic and vermiculiticclays
V-TA1 red
V-TA2 orange-red
V-TA3 orange-red small crack at drying
S-TA1 light grey small crack at drying
S-TA2 light cream
Conclusion
In this research, the suitability of groups of cays from northern Morocco (Tangier region), having a diverse mineralogical composition as the raw material for brick making was investigated. The clay materials belong to Cretaceous and Pliocene deposits. The clay fraction consists of kaolinite, illite, chlorite, smectite and vermiculite. Chemical analysis results of the clay fractions confirmed that Al2O3 and SiO2, accompanied by a significant amount of iron oxides are the major components. CaO is another major component in vermiculitic and kaolinitic clays. The alkali oxides (K2O, Na2O) are present in small amounts.
The present investigation can help to improve the Cretaceous and Pliocene clays used for bricks as well as contributing to correct exploration. The studied clays show mostly good drying properties. Furthermore, firing shrinkage and water absorption of the bricks were in compliance with the criteria for building brick (BIA, 2006). In accordance with the loss of weight criterion for a normal clay brick [48], some kaolinitic and vermiculitic clays are above the norm.
From the point of view of the industrial application for Cretaceous and Pliocene clays, it can be stated that according to their composition and behaviour, they are mostly suitable as raw material for fired bricks. The positive results obtained in this set of preliminary tests lead us to envisage new research focused on testing these on a semi-industrial scale, and assessing the effective possibility of using them as raw materials for brick manufacturing in local ceramic industry. But, the high linear shrinkage, high weight loss and cracks observed on some specimens indicated that degreasers are necessary, in order to reduce their plasticity and to dilute their carbonates content before using in brick production. Further applied tests on the clays studied have to be carried out to determine the best formulations for fired brick products.
References
1. S.E. Chidiac, L.M. Federico, Can. J. Civ. Eng. 34 (2007) 1458. 2. L. Mbumbia, A.M. De Wilmars, Constr. Build. Mater. 16 (2002) 101.
3. G.M. Reeves, I. Sims, J.C. Cripps, London Engineering Geology. (2006) 525. 4. P. Aungatichart, S. Wada, Appl. Clay. Sci. 43 (2009) 182.
5. G.S. Dasog, D.F. Acton, A.R. Mermut, E. DeJong, Can. J. Soil. Sci. 68 (1988) 251. 6. C.W. Smith, A. Hadas, J. Dan, H. Koyumdjisky, Geoderma. 35 (1985) 47.
7. R. Murray, J. Quirk, Soil. Sci. Soc. Am. J. 46 (1982) 865.
9. F.A.C. Milheiro, M.N. Freire, A.G.P. Silva, J.N.F. Holanda, Ceram. Int. 31 (2005) 757. 10. M. El Ouahabi, L. Daoudi, N. Fagel, Clay. Miner. 49 (2014) 1.
11. R.E. Grim, R.A. Rowland; J. Am. Ceram. Soc. 27 (1944) 65. 12. M. Dondi, M. Raimondo, C. Zanelli, Appl. Clay. Sci. 96 (2014) 91.
13. A.J. Lecloux, In Anderson (ed) Catalysis: Science and Technology Springer, (1981). 14. C.J. Schollenberger, R.H. Simon, Soil Sci. 59 (1945) 13.
15. R.C. Mackenzie, Clay. Miner. (1952) 203.
16. F. De Vleeschouwer, V. Renson, P. Claeys, K. Nys, R. Bindler, Geoarchaeology. 26 (2011) 440. 17. M. Abajo, Tejas y Ladrillos Ed. Beralmar S. A. (2000).
18. U67-027-84. AENOR. (1984).
19. V. Tudisca, C. Casieri, F. Demma, M. Diaz, L. Piñol, C. Terenzi, F. De Luca, J. Archaeol. Sci. 38 (2011) 352-359.
20. H.Y. Fang, CRC Press LLC, America. (1997) 105.
21. M.B. Rollins, D.L. Pool, Clays. Clay. Miner. 16 (1968) 165. 22. C. Ma, R.A. Eggleton, Clays. Clay. Miner. 47 (1999) 174. 23. P.T. Hang, G.W. Brindley, Clays. Clay. Miner. 18 (1970) 203. 24. U. Schwertmann, N. Kämpf, Soil. Sci. 139 (1985) 344.
25. O.K. Borggaard, J. Soil. Sc. 33 (1982) 443.
26. P. Ligas, I. Uras, M. Dondi, M. Marsigli, Appl. Clay. Sci. (1997) 145. 27. P.H. Nadeau, D.C. Bain, Clays. Clay. Miner. 34 (1986) 455.
28. H. Baccour, M. Medhioub, F. Jamoussi, T. Mhiri, A. Daoud, Mater. Charact. 59 (2008) 1613. 29. C.M.F. Vieira, R. Sánchez, S.N. Monteiro, Constr. Build. Mater. 22 (2008) 781.
30. H. Baccour Zghala, M. Medhioub, T. Mhiri, J. Ceram. Process. 13 (2012) 202. 31. W. Bender, F. Händle, Bauverlag GmbH, Wiesbaden und Berlin (1982).
32. M. Romero, A. Andrés, R. Alonso, J. Viguri, J.M. Rincón, Ceram. Int. 34 (2008) 1917.
33. G. Clark, B.F. Leach, S. O’Conner, Terra Australia, Australian National university press. (2008) 435. 34. S. Sousa, J. Holanda, J. Therm. Anal. Calorim. 87 (2007) 423.
35. A. Njoya, C. Nkoumbou, C. Grosbois, D. Njopwouo, D. Njoya, A. Courtin-Nomade, J. Yvon, F. Martin,
Appl. Clay. Sci. 32 (2006) 125.
36. M. Gábor, M. Tóth, J. Kristóf, G. Komáromi-Hiller, Clays. Clay. Miner. 43 (1995) 223.
37. M.J. Trindade, M.I. Dias, F. Rocha, M.I. Prudêncio, J. Coroado, Appl. Clay. Sci. 53 (2011) 489. 38. E. Murad, U. Wagner, Hyperfine Interactions. 117 (1998) 337.
39. F. Wolters, K. Emmerich, Thermochim. Acta. 462 (2007) 80. 40. H. Ratzemberger, Ziegelindustrie International. 43 (1990) 348.
41. S. Meseguer, F. Pardo, M.M. Jordan, T. Sanfeliu, I. González, Appl. Clay. Sci. 47 (2010) 372. 42. M.V. Arsenović, L.L. Pezo, Z.M. Radojević, S.M. Stanković, Hemijskaindustrija. 67 (2013) 811. 43. M. Dondi, G. Guarini, M. Raimondo, I. Venturi, J. Eur. Ceram. 22 (2002) 1737.
44. K. Jeridi, M. Hachani, W. Hajjaji, B. Moussi, M. Medhioub, A. Lopez-Galindo, F. Kooli, F. Zargouni, J. Labrincha, F. Jamoussi, Clay. Miner. 43 (2008) 339.
45. S.L. Correia, D. Hotza, A.M. Segadães, Ceram. Int. 30 (2004) 917.
46. V.S. Ramachandran, R.M. Paroli, J.J. Beaudoin, A.H. Delgado, Handbook of Thermal Analysis of
Construction Materials (2008).
47. BIA. Manufacturing of Brick (2006). 48. TAASHTO. Part II, Washington (1982).
49. R. Toledo, D.R. Dos Santos, R.T. Faria, J.G. Carrió, L.T. Auler, H. Vargas, Appl. Clay. Sci. 27 (2004) 151. 50. G. Cultrone, C. Rodriguez-Navarro, E. Sebastian, O. Cazalla, M.J. De la Torre, Eur. J. Mineral. 13 (2001)
621.
51. R.S. Boynton, Chemistry and technology of lime and limestone. Wiley, New York (1980). 52. I. Demir, M. Orhan, Build Environ. 38 (2003) 1451.
53. Y. Iqbal, W.E. Lee, J. Am. Ceram. Soc. 83 (2000) 3121.
54. N. Bilgin, H.A. Yeprem, S. Arslan, A. Bilgin, E. Günay, M. Marşoglu, Constr. Build. Mater. 29 (2012) 449.
55. M. Saadi, E.A. Hilali, A. Boudda, Ministère de l’Energie et des Mines DdG, Service de Géologie du Maroc
(ed) Notes et Mémoires, Maroc (1980).
![Figure 1: Location and geological map of the study area (modified after Saadi et la., 1980 [55]).!](https://thumb-eu.123doks.com/thumbv2/123doknet/5937346.146167/2.892.190.726.591.969/figure-location-geological-map-study-area-modified-saadi.webp)