Valuing Attractive Landscapes in the Urban Economy
Final Report
Action 1.2
Baseline Analysis of Existing Economic Valuation Tools for
Application to Green Infrastructure Investments
–
January 2010
Edited by Simone Allin and John Henneberry
Department of Town and Regional Planning, University of Sheffield, Western Bank, Sheffield, S10 2TN, UK.
Table of Contents
0. Foreword and Overall Report Structure...3
1. Introduction ...5
1.1 Main Objectives of Action 1.2 and Linkage to other Work Packages ...5
1.2 Involved Partners’ Institutions...6
1.3 Transnational Added Value and Beneficiaries...8
1.4 Geographic Scope and Timeframe...8
2. Review of Existing Evaluation Techniques at the Site Scale and the City/Region Scale...9
2.1 Evaluation Techniques at the Site Scale...9
2.2 Evaluation Techniques at the City/Region Scale ... 25
2.3 Conclusions... 34
3. Overview on VALUE Investments: Main Objectives and Expected Benefits at the Site Scale and the City/Region Scale... 36
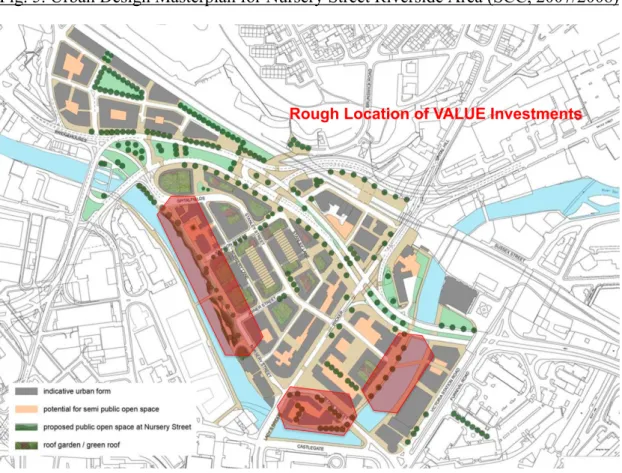
3.1 Sheffield – The ‘Wicker’/Nursery Street ... 36
3.2 Manchester – ‘Oxford Road Corridor’ ... 39
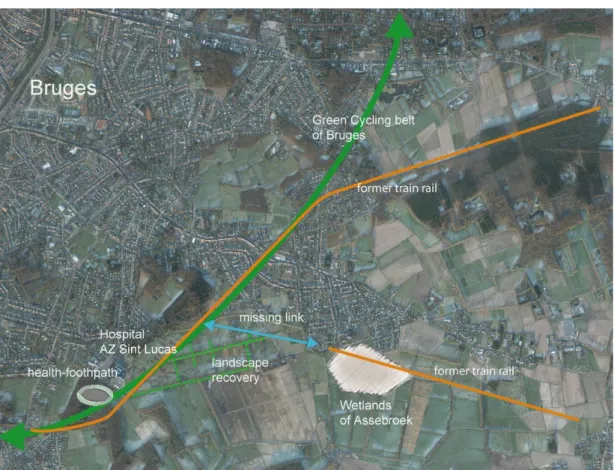
3.3 Bruges – ‘Green Cycle Belt’ ... 43
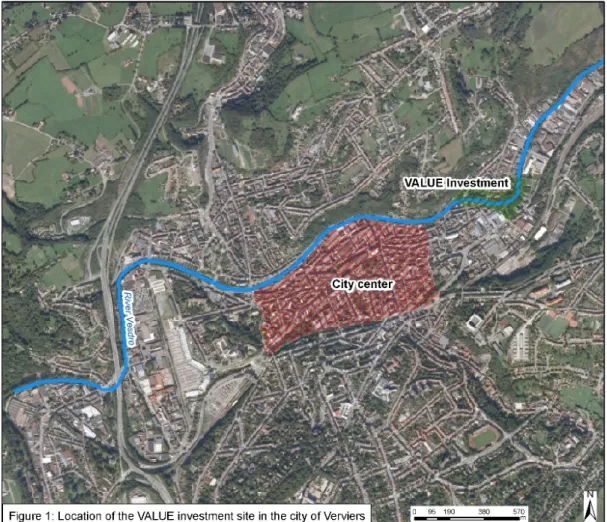
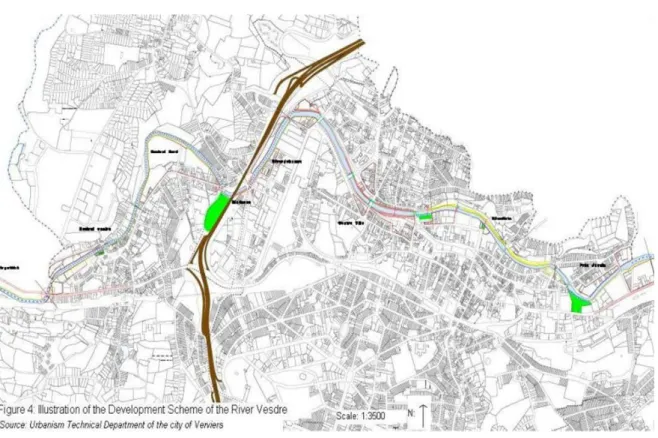
3.4 Verviers – ‘Vesdre River Greenway’... 46
3.5 Stuttgart – (‘Online Route Planner’ &) ‘Greenway Enhancements’ ... 48
3.6 Amersfoort – ‘Euterpeplein’ and ‘Randerbroek’... 51
3.7 Conclusions... 55
4. Development of an Evaluation Framework – Identification of Optimum Evaluation Techniques at the Site Scale and the City/Region Scale... 57
4.1 General and Particular Economic Benefits of Urban Green Infrastructure.... 57
4.2 Matching of Evaluation Techniques to the Characteristics of the VALUE Investments at the Site Scale... 59
4.3 Description of Evaluation Approach Matching the Characteristics of the VALUE Green Infrastructure Strategies at the City/Region Scale... 68
4.4 Conclusions... 75
5. Conclusions ... 78
6. Acknowledgements... 80
0. Foreword and Overall Report Structure
(Simone Allin and John Henneberry)
The overall aim of this report is to describe and to discuss the main outcomes of a baseline analysis of existing economic valuation tools for application to green infrastructure investments (see VALUE Action 1.2). In this regard, it covers approaches to evaluation both at the site scale and the city/region scale.
In addition, it outlines an evaluation framework for the particular VALUE investments in the six partners’ cities and regions. This framework was presented and discussed at the VALUE partners’ meeting in Stuttgart in November 2009. At this venue, specific evaluation approaches matching the characteristics of selected VALUE investments in each of the six participating cities were jointly discussed and agreed by all the partners. The subsequent research on VALUE Work Package 4 (‘Economic Valuation of Green Infrastructure Networks’) will be developed and pursued within this framework.
The literature and practice reviews related to this report were mainly undertaken in the period between January 2009 and September 2009. The interim results of this work were incorporated in a series of working papers and other written outputs (see p. 7). These were presented and discussed variously at the VALUE partners’ meetings in Liege in January 2009 and in Manchester in June 2009. A technical workshop focusing on the core themes and specific methodological issues of VALUE Action 1.2 took place on 18 September 2009 in Brussels. The joint agreements and initial decisions that resulted were important milestones in the successful completion of the present report.
The report incorporates the work of many members of the VALUE team. The authors are assigned to the particular chapters and sections of this report that they produced. Colleagues’ contributions took three main forms, as follows:
- Coordination and management, substantial research contributions by Prof. John Henneberry and Dr Simone Allin (University of Sheffield, Department of Town and Regional Planning).
- Substantial research contributions by Dr Karsten Rusche (Institut für Landes- und Stadtentwicklungsforschung gGmbH), Prof. Jean-Marie Halleux and Pierre Guilliams (Université de Liège, SEGEFA – Service d'Étude en Géographie Économique Fondamentale et Appliquée), Nel Ghyselinck and Frank Stubbe (Vlaamse Landmaatschappij) in cooperation with Dr Bert Vermeire (Universiteit Gent), and Arno Goossens (Gemeente Amersfoort) in cooperation with Derk-Jan Stobbelaar and Wim Timmermans (Wageningen University and Research Centre).
- Substantial information and data provision, comments on interim drafts of the report and the authorship of particular parts of this report by Betty Anyika, Krys Craik and Maria Wilding (Sheffield City Council/South Yorkshire Forest Partnership), Pete Stringer (Manchester City Council/Community Forest Northwest/Red Rose Forest Partnership), Julie Moreau (City of Verviers/Agence de développement économique en province de Liège), and Stefanie Clauß and Suzan Ünver (Verband Region Stuttgart).
The overall structure of the Action 1.2 report and its contents can be described as follows: Chapter 1 (‘Introduction’) focuses on the main objectives of Action 1.2, its linkages to other VALUE work packages and the transnational added value and beneficiaries of related research and investigations. Chapter 2 represents the core part of the theoretical and practical analyses. It concentrates on the main outcomes of a review of existing evaluation techniques for economic appraisal of green infrastructure investments at the site scale and the city/region scale. Chapter 3 provides an overview of the current state of selected VALUE investments in the six European project partners’ cities. It highlights their main characteristics at the site scale and the city/region scale. In addition, it identifies the anticipated/expected economic benefits of each green infrastructure investment at the site scale and of each green infrastructure strategy at the city/region scale. Chapter 4 develops the evaluation framework. Thus, it identifies and matches optimum evaluation techniques to each of the VALUE partners’ cities and regions and their particular green infrastructure investments. Chapter 5 summarises the main conclusions of the report and presents the framework within which the valuation of green infrastructures will be undertaken (in Work Package 4).
1. Introduction
(Simone Allin and John Henneberry)
This report describes the outcomes of Action 1.2, within the overall framework of the VALUE project. To contextualise the discussion, this Chapter outlines the main objectives of Action 1.2 and describes its linkages to the other work packages and actions of VALUE. The chapter also introduces the partners’ institutions and highlights individuals’ contributions to this report. In addition, the chapter describes the transnational added value and the beneficiaries of the related research. It finally outlines the geographic scope of research as well as some general issues concerning the timeframe of the research work and of particular actions.
1.1 Main Objectives of Action 1.2 and Linkage to other Work Packages
(Simone Allin and John Henneberry)
Action 1.2 is the core part of Work Package (WP) 1. It is designed to build strategic alliances across the involved NWE partners and key actors, using the resulting working relationships to bring wide-ranging expertise and valuable knowledge into the project. Consequently, WP 1 prepares the ground for all other work packages by engaging key stakeholders. Furthermore, it produces a platform for informing further partnership decisions and developing common and complementary planning and evaluation approaches (see Figure 1).
In this regard, the main objectives of Action 1.2 are as follows:
- to scope existing economic valuation tools for application to green infrastructure investments,
- to audit and contrast different approaches, and
- to identify optimum evaluation techniques at the city/region scale and the site scale.
Thus, the present report, which is the main output of Action 1.2, demonstrates how cities and regions can select appropriate appraisal techniques in order to integrate the particular values and individual needs of different stakeholders. It refers to the strengths and weaknesses, opportunities and threats of existing and novel approaches. Furthermore, it describes the valuation tools to be applied in each of the VALUE cities at both the city/region scale (I) and the site or neighbourhood scale (II). The Action 1.2 report provides the basis for the evaluation of impacts in Work Package 4 (‘Economic Valuation of Green Infrastructure Networks’). Beyond this, the baseline analysis of valuation tools is considered to be of wide interest to related professional and scientific audiences. Thus, the outcomes have been and will be presented through publications and at events.
Fig. 1. Linkages and relationships between the VALUE work packages and outcomes
1.2 Involved Partners’ Institutions
(Simone Allin and John Henneberry)
VALUE Action 1.2 is coordinated by the University of Sheffield (SU), Department of Town and Regional Planning, through Prof. John Henneberry and Dr Simone Allin. Thus, SU has been responsible for initiating an intensive and constructive dialogue with colleagues in the partners’ institutions and for managing the work on the related research and analyses. SU’s contribution to Action 1.2 also includes a series of working papers, the editing and writing of an executive summary produced for the VALUE partners’ meeting in Manchester in June 2009, and – last but not least – the editing of and various substantial contributions to the present final report.
The other VALUE partners’ institutions involved in the work on Action 1.2 and, thus, in the writing of associated working papers, literature reviews and this report are as follows (see also Foreword, Chapter 0):
- Institut für Landes- und Stadtentwicklungsforschung gGmbH (ILS), Dr Karsten Rusche,
- Université de Liège (ULg), Service d'Étude en Géographie Économique Fondamentale et Appliquée (SEGEFA), Prof. Jean-Marie Halleux and Pierre Guilliams,
- Vlaamse Landmaatschappij (VLM), Nel Ghyselinck and Frank Stubbe in cooperation with Universiteit Gent (GU), Dr Bert Vermeire,
- Gemeente Amersfoort (GA), Arno Goossens in cooperation with Wageningen University and Research Center (WUR), Dr Derk-Jan Stobbelaar and Drs Wim Timmermans.
A detailed list of written outputs of VALUE Action 1.2 to date reads as follows: - Allin, S. & Henneberry, J.: Overview of Existing Economic Valuation
Techniques – Summary Report, Working Paper 1.2.1, Sheffield/UK, February 2009.
- Allin, S. & Henneberry, J.: Stated Preferences Techniques in Combination with Visualisations – An Initial Literature and Practice Review, Working Paper 1.2.2, Sheffield/UK, March 2009.
- Allin, S. & Henneberry, J.: Stated Preferences Techniques in Combination with Virtual Reality Technologies and Visualisations – A Literature and Practice Review, Working Paper 1.2.3, Sheffield/UK, April 2009.
- Rusche, K.: Revealed Preferences on the Regional Scale – Quality of Life and Quality of Business Environment – An Initial Review, Working Paper 1.2.4, Dortmund/Germany, April 2009.
- Guilliams, P. & Halleux, J.-M. (under the supervision of Merenne-Schoumaker, B.): Revealed (expressed) Preferences Techniques – Focus on the Hedonic Price Method and its Implementation – State of the Art, Working Paper 1.2.5, Liege/Belgium, April 2009.
- Allin, S. & Henneberry, J.: Stated Preferences Techniques in Combination with Virtual Reality Technologies and Visualisations – A Review of International Case Studies, Working Paper 1.2.6, Sheffield/UK, June 2009. - Vermeire, B., Verspecht, A., Gellynck, X., Ghyselinck, N., Gellinck, L. &
Stubbe, F.: Development of an Economic Valuation Model for Green Infrastructure on the Basis of a Literature Review, Ghent/Bruges/Belgium, January 2009.
- Allin, S. & Henneberry, J. (eds.): Executive Summary – Work Package 1/Action 1.2: Baseline Analysis of Existing Economic Valuation Tools for Application to Green Infrastructure Investments – Working papers/Literature Review January – June 2009, Sheffield/UK, June 2009.
The above-mentioned partners have been widely supported by the provision of further information and data, on-site knowledge and helpful comments delivered by:
- Sheffield City Council/South Yorkshire Forest Partnership (Lead Partner), Betty Anyika, Krys Craik, and Maria Wilding,
- Manchester City Council/Community Forest Northwest/Red Rose Forest Partnership, Pete Stringer,
- City of Verviers/Agence de développement économique en province de Liège (SPI+), Julie Moreau,
1.3 Transnational Added Value and Beneficiaries
(Simone Allin and John Henneberry)
In WP 1, all involved VALUE partners work together to establish how to tackle the shared transnational challenge of stimulating balanced economic growth by targeting landscape improvements at the city/region scale and the site scale. This requires an accordant effort across the NWE regions as well as a critical mass of experience. The latter is mainly generated by means of the compilation of this report. In order to write the Action 1.2 report, the involved partners’ institutions have been working jointly to identify the best ways to establish the economic value of green infrastructure and to promote the efficiency of related investments coordinated across the private and the public sector.
Consequently, all VALUE partners benefit from the shared know-how developed in WP 1 in general and within the Action 1.2 research in particular. Furthermore, they are all involved in the implementation of this know-how. This means that all participating partners’ institutions and cities/regions will enjoy improved conditions and infrastructure for economic growth.
1.4 Geographic Scope and Timeframe
(Simone Allin and John Henneberry)
The VALUE project mainly addresses green infrastructure at the city/region scale and the site scale in the following European regions:
- UKE32 (NUTS 3): Sheffield,
- UKD31 (NUTS 3): Greater Manchester South, Manchester, - BE251 (NUTS 3): Arrondissement. de Bruges, Bruges, - BE332 (NUTS 3): Arrondissement de Liège, Liège,
- DE111: Stuttgart (Stadtkreis), DE112: Böblingen, DE113: Esslingen, DE115: Ludwigsburg, DE116: Rems-Murr-Kreis (all NUTS 3), and
- NL310 (NUTS 3): Utrecht, Amersfoort.
The official start of WP1 was scheduled for June 2008. However, administrative and contractual issues delayed the start of significant work on WP1 in general and Action 1.2 in particular until January 2009. So far, this slippage of about six months has not been caught up completely. A draft version of the Action 1.2 report was discussed and approved by all partners at the VALUE partners’ meeting in Stuttgart in November 2009. Following the discussions, minor amendments and clarifications were incorporated in the present and final report.
2. Review of Existing Evaluation Techniques at the Site Scale and the City/Region Scale
(Simone Allin and John Henneberry)
This chapter represents the core part of the theoretical and practical analyses within the present report. It focuses on the main outcomes of a review of existing evaluation techniques for economic appraisal of green infrastructure investments at the site scale and the city/region scale.
The chapter outlines the main evaluation techniques that may be applied at the site scale (II) and describes their particular aims and objectives and strengths and weaknesses (see Section 2.1). It also considers the current focus of related theoretical debates (including, for example, specific methodological shortcomings) and the issues raised by the practical applications of individual techniques (especially referring to restrictions and pitfalls). A similar approach is applied to the review of evaluation techniques at the city/region scale (I), which is covered by Section 2.2.
2.1 Evaluation Techniques at the Site Scale 2.1.1 Cost-Benefit-Analysis
(Nel Ghyselinck, Frank Stubbe and Bert Vermeire)
Cost-Benefit-Analysis (CBA) is an economic valuation method used to assess the economic return of a project to an investor. In CBA, the total economic value of a project is determined by analysing the project in terms of costs and benefits. In order to qualify on cost-benefit principles, a project’s benefits must exceed its costs. The main criterion for evaluation is economic efficiency. Therefore monetary values are attributed to all costs and benefits.
In general, CBA can be applied to any resource allocation in the economy. It is most commonly used at company level (to underpin investment decisions) or at society level (through social cost-benefit analysis).
CBA displays several weaknesses. The first one is linked with the fact that costs and benefits might be unequally distributed. The ideal situation is that, when a project is cost-benefit positive, all stakeholders obtain benefits and no stakeholders suffer costs. In reality this is not the case. A second problem relates to uncertainty. The uncertainty is caused by simplifications, which have to be made in the valuation procedure because in the real world prices are often distorted. Consequently, the quality of CBA is strongly dependent upon the approximations that are made. Therefore, CBA conclusions give no definite answer on whether or not to undertake an investment; rather, they will give an overview on how efficient the investment is in terms of costs and benefits.
Description of the overall CBA framework
Traditionally, CBA is undertaken in six stages as illustrated by Figure 2 (Layard/Glaister, 1994; Brent, 1997; Pearce et al., 2006).
1. Project definition
This includes the objectives and scope of the green investment, particularly the reallocation of resources being proposed and the population of gainers and losers to be considered. This identification process should be based on a clear understanding of the level of detail of the CBA, both in geographical terms and in relation to the group of stakeholders. The scope of the project can be neither too broad nor too narrow. If it is too broad, the risk exists that the project actually encompasses several contradicting sets of benefits and costs. If it is too narrow, the project may actually be a component of a larger project rather than a discrete investment.
2. Identification of project options
If there exist different project options for examination, these should be definedat this stage. The range of options will depend on the political context in which the green investment is made. Within the context of VALUE, this is relevant in the ex-ante evaluation, where the aim is to evaluate the value added of the chosen measures against other measures. Because VALUE aims to demonstrate that green infrastructure is valuable, it might be interesting to select alternative options that are preferred by opponents of the green investment.
3. Identify relevant value impacts and select indicators
In the third stage, all relevant value impacts resulting from the project’s implementation are identified. Only the impacts that affect the members of the population identified in the first stage are subject to further analysis. In combination with the identification of the impacts, indicators are selected to quantify their value. The selection is motivated by the nature of the value, the measurement tool to be used and data availability.
4. Monetising costs and benefits
This stage involves determining the amount of costs and benefits of the project, and their temporal incidence. They must be predicted relative to a well-defined ‘base case’: what would have happened without the green investment. In most cases, this will be the situation as it was (is) before the development of the green investment. However, it is also possible that the green infrastructure replaces another development vision for the area.
All calculations will take varying levels of uncertainty into account, as the changing environment influences future costs and benefits. These uncertainty levels will be used in the sensitivity analysis in stage 6. Monetisation is often the most difficult step in CBA, especially in the context of ecological and environmental projects. It is most
appropriate to use market prices; however, these are often not available. In this case a range of quantification tools can be applied, as described in ‘the toolkit’.
Fig. 2. CBA procedure
5. Discounting future costs and benefits
Discounting is required because the monetary value of a future cost or benefit and is not identical to its present value. Therefore, monetary values should be reduced to a common time dimension: the base year. The value, which is constructed in this way, is called Net Present Value (NPV). The changing monetary value of costs and benefits over a certain period of time can be explained by analysing inflation levels and the evolution of particular prices/costs (for example, labour, raw materials). Discounting starts with the identification of the base year, the selection of the evaluation discount rate and the definition of the evaluation period.
6. Describe the distribution of costs and benefits
The distribution of costs and benefits will be taken into account in the final investment decision. Consequently, it should be identified and quantified in NPV terms. The evaluation of these distributional aspects is a political one.
7. Sensitivity analysis
In order to deal with the uncertainty of the predictions made, the sensitivity of the NPV to variations in costs and benefits should be tested. Such sensitivity analysis assesses the overall robustness of the CBA result. This analysis is undertaken by formulating feasible variations to the assumptions made, relating to
- different discount rates (for example, expected inflation rates), Project definition Identification project options Identification impacts and indicators Monetization of costs and benefits Discounting Distribution of costs and benefits Sensitivity analysis Recommendations
- uncertain future costs or benefits (for example, evolution of tourist expenditure),
- uncertain assumptions motivating the choice for a cost or benefit (for example, the assumption that nearby farms are competitive may be underpin the prediction of their production losses), and,
- furthermore, sensitivity analysis might be used to measure the impact of specific risks, if relevant (for example, environmental disaster).
The interpretation of this variability leads to the formulation of a number of different scenarios, with a particular focus on the ‘worst case scenario’ and the likelihood that it may take place. If the green infrastructure is cost-benefit positive under various scenarios, than it can be classified as robust.
8. Recommendations
The recommendations following from CBA generally relate the NPV of the project or the option to the highest NPV and assess the sensitivity and distribution of the project’s/option’s NPV. This leads to the identification of a ‘preferred option’ from a cost-benefit perspective. However, an evaluation of whether the green infrastructure is acceptable or not has to be taken by the policy-maker.
The Toolkit – A range of particular techniques and methods
In order to conduct an economic valuation, monetary measurements are required. For several values, however, these measurements are not easy to obtain because empirical data are generally not collected or values are not expressed in monetary terms. Several techniques have been developed to deal with this problem (Berends et al., 2001). The use of each of these techniques is illustrated in Figure 3.
Ideally, valuation is based on market prices, if efficient prices are available. In situations where market prices are distorted, shadow prices are used. Oftentimes and particularly in the context of non-use values no market prices are available. Regarding goods or services with an existing consumer demand, demand curve approaches can be applied. In this regard, revealed preference approaches are based on observations of actual consumer behaviour while stated preference approaches are based on an expression of consumer’s willingness-to-pay. If no demand curve can be drawn, these values can be estimated through cost-based methods.
In most applications, only one or a limited number of valuation tools is applied. Ideally, the valuation will be based on observed market values. However, if these are not available, the researcher relies on non-market values and is confronted with the problem that there is no consensus in current guidance as to how these should be derived and used.
As each instrument has specific qualities to measure specific values, a combination of the different tools, applied in their specific areas, seems most promising. However, there are also some disadvantages:
- One must be aware that different methods may have different results. Consequently, the decision to use a particular technique will have a strong
impact on the outcomes. In a research context that is politically driven, the risk exists that these decisions are not made on the base of methodological arguments only.
- Some techniques require considerable budgets and if different techniques are combined the overall cost might be high.
Furthermore, the following recommendations from the HEATCO guidelines are important (Bickel et al., 2004):
- Non-market valuation studies should be undertaken where the impact to be valued is likely to be significant in determining the outcome of the CBA, and where the possibilities for robust value transfer are limited.
- Non-market valuation techniques should be selected on the basis of available expertise and previous experience in the EU relating to the specific impact. - The resulting non-market values should be validated through comparison with
the values from other studies.
In practice, the research context shaped by political orientations and time and/or budget constraints will influence these methodological choices.
Fig. 3. Taxonomy of economic valuation tools
Source: adapted from Merlo & Croitoru, 2008
Prices reflect the value of the good and are available. Some direct use values are marketable and therefore market prices can be used (> ‘efficient price’). Sometimes the prices are not entirely the result of supply-demand but are distorted because of, for example, policy interventions. In these cases, shadow prices should be used.
Market price
available No market price available
Distorted price Shadow price Efficient price Demand curve approaches Nondemand curve approaches Revealed preference approaches Stated preference
approaches Costbased methods
Revealed preferences approaches (see also Section 2.1.2)
Revealed preferences approaches are based on observations of actual consumer behaviour. Thereby, the value of a particular behaviour is revealed by their behaviour on other, related markets. By observing real choices within a market, the preferences for other goods and services can be deduced. The main advantage of these methods is that they are based on real market prices, which guarantee a certain level of objectivity. On the other hand, the relationship of the reference value with the revealed value is assumed and this assumption cannot be tested.
Stated preferences approaches (see also Section 2.1.3)
Stated preferences approaches measure people’s intended future behaviour in constructed markets. By means of a questionnaire, a hypothetical market is described where the good in question can be traded. This includes a definition of the good itself, the institutional context in which it would be provided, and the way it would be financed. A random sample of people is then directly asked to express their maximum willingness-to-pay for (or willingness-to-accept) a change in the level of provision of the good. Respondents are assumed to behave as if they were in a real market. One of the strengths of stated preferences methods lies in their flexibility. For example, the contingent valuation method, in general, is applicable to almost all non-market goods and to ex-ante and ex-post valuations. Furthermore, it is one of the few available methodologies able to capture all types of benefits from a non-market good or service, including those unrelated to current or future provision. The main drawbacks result from the fact that respondents are assumed to behave as if they were in a real market. As the individual faces hypothetical situations, we are not sure that the stated preferences are real because they may incorporate hypothetical bias.
Cost-based methods
If no market prices are available and these cannot be estimated by establishing a demand curve, value can be identified indirectly by non-demand curve approaches. The principal assumption of these methods is that if people incur costs to replace the services of green infrastructure or to avoid damages caused by a lack of green infrastructure, then these green goods or services are worth at least what people have paid to replace them. The most commonly used techniques are the replacement cost, the damage avoided cost, the substitute (or alternative) cost, and the productivity change cost (Damigos, 2006). All these techniques identify market prices, which are associated with absence of the valued aspect. Examples of areas where these methods might be applied include
- valuing improved water quality by measuring the cost of filtering and chemically treating water, and
- valuing walking (recreation) by measuring the cost of travelling further (to the next green infrastructure where inhabitants can walk).
Benefit transfer
This method is based on the application of the results obtained from a particular case to another area. This process is a time- and cost-effective way to estimate the value of
green infrastructure when original research is not possible because of budget constraints and/or time limitations. However, primary research is the ‘first-best’ strategy. A range of conditions will affect the effectiveness and efficiency of the benefit transfer approach. They include the quality of the original study, the different research methods that may have been used for data collection, the different statistical methods that may have been applied for estimating models, and the issue of temporality or stability of data over time, because the subject and comparator studies occurred at different times.
Conclusions and Further Investigations
(Simone Allin and John Henneberry)
The initial review of the toolkit of CBA (above) indicates that revealed and stated preferences approaches display substantial potential for application to the economic appraisal of green infrastructure investments. Consequently, they will be analysed in more detail in Subsections 2.1.2 and 2.1.3. As complementary theory and practice reviews have highlighted (see, for example, in Working Papers 1.2.3 and 1.2.5), they are the two most commonly and successfully applied approaches to the estimation of money values for non-market goods or services.
2.1.2 Revealed Preferences Techniques
(Pierre Guilliams and Jean-Marie Halleux)
Following a general literature review on revealed preference techniques, attention focused on the Hedonic Price Method (HPM). This method has been extensively explored in the current literature. It is very relevant to the economic valuation of urban green infrastructure, especially the estimation of its impact on real estate prices. This subsection is the outcome of a three-step approach. Firstly, the theoretical development of the method was studied (see Working Paper 1.2.5). Secondly, the literature on existing case studies was reviewed. Finally, the implementation of the HPM in the framework of the VALUE project was discussed and the strengths and weaknesses of the method were highlighted.
The aim here is to synthesise these steps and to consider the implementation of the HPM within the framework of the VALUE project in a pragmatic way. In order to achieve this goal, we start with an abstract of the main observations emerging from the theoretical and case studies review before presenting the main strengths and weaknesses of the method. Finally, we discuss its implementation in practice.
Observations emerging from the theoretical review
The Hedonic Price Method is well known and largely explored in the literature (Tyrväinen/Miettinen, 1999). The fundamental principle of the method, developed by Lancaster (1966), provides a powerful analytical tool. HPM is based on the hypothesis that value indicators – such as property prices – reflect the spatial variations of the effect of a public good’s attributes on different communities (Brookshire et al, 1982, p. 165). Thus, the HPM is able to estimate the individual
demand for environmental attributes of public goods and is extensively used for the analysis of physical components of the environment.
The literature review of the HPM attests to the flexibility of the method. However, the particular elements of a study reflect the author’s/researcher’s preferences and differ from one case to another - and can have a significant impact upon a study’s results. The first element of interest is the choice of attributes (variables). Real estate is made up of specific physical attributes (number of rooms, age and so on) but also of location-specific attributes, which are determined by the quality of the neighbourhood and its global accessibility. Open and green spaces are two of the elements influencing neighbourhood quality. The way that different authors consider green space attributes varies. Some use the size or the surface area of the green infrastructure, others make a distinction between its aesthetic and recreational functions or between private and public goods. As these attributes are used to justify the implicit price of the real estate, it is obvious that their choice will influence the results.
The different attributes can then be integrated and rated in different ways (binary, quantities and so on). The types of classifications again depend on the choices of the authors.
Another major difficulty is the availability of data. Data sources in different countries are very important for the further implementation of the method within the framework of the VALUE project. The availability of external data (relating to location and so on) also underpins the calibration of the hedonic model. Concerning the latter, current developments in the context of cartographic tools are very promising. The use of Geographical Information Systems (GIS) allows the determination of accessibility, for which numerous measures have been developed (such as the distance to the city-centres, market potential isochrones and so on). In the same way, remote sensing methods can be applied to measure the environmental quality of a neighbourhood (Geoghedan et al., 1998). Thus, documents and data availability, which permit these technologies to be exploited in the different countries and regions, are of fundamental importance.
In the HPM, the influence of the attributes’ (qualitative and quantitative) characteristics depends on the form of the hedonic function. The latter broadly influences the results and, thus, must be highlighted. The bibliographic review also identified the importance of market segmentation. It can be obtained through a judicious sample choice and the identification of homogenous segment and spatial entities, which are appropriately delimited. In addition to the functional form and the market segmentation, other difficulties and error terms will be encountered during the implementation of the HPM: these include the multi-collinearity between exogenous variables, the heteroscedasticity of the remainders and the spatial autocorrelation of the remainders.
Observations emerging from the case studies review
The case studies review showed that the flexibility of the method is influenced more by data availability than by the preferences of the authors. Consequently, the biggest practical challenge for any HPM study is gathering sufficient, appropriate, accurate data to support robust analysis. Two kinds of data are necessary: green infrastructure data and real estate data.
In terms of property types, the literature review revealed a large number of case studies applying HPM to residential properties. Several studies successfully make the link between house prices and green infrastructure. In contrast, studies of the determinants of shopping centre and retail rents generally treat green infrastructure as a marginal variable (Des Rosiers et al., 2004; Sirmans/Guidry, 1992; Mejia/Benjamin, 2002; Benjamin et al., 1990; Mérenne-Schoumaker, 2004). This is mainly because certain variables are highly significant to the commercial sector, notably those relating to location (such as visibility, closeness to competitors, high levels of foot-fall and so on). Between these two extremes, the office sector offers the opportunity – regarding scientific relevance and feasibility –to implement the HPM in a relatively novel way within the framework of the VALUE project.
Strengths and Weaknesses
Considering the implementation of the HPM within the framework of the VALUE project, a number of strengths and weaknesses can be identified.
Strengths
The HPM is a very powerful analytical method. It can provide strong statistical evidence of the economic impact of green infrastructure through the analysis of real estate values. However, the impact of green infrastructure investments on the office sector still needs further investigation. The Commission for Architecture and the Built Environment (CABE, 2005) maintains that the quality of the environment is an important influence on the location decisions of building occupiers (office occupiers). This claim needs to be substantiated. And, with regard to the question “Is HPM able to elicit the impact of green infrastructure on economic development?”, the answer, in theory, is “Yes, it is”.
The HPM is also applicable at different scales. If the market is well defined, it is a powerful tool to study a city as a whole, to compare different neighbourhoods, and to work at the neighbourhood scale itself. Thus, HPM can achieve results at the site scale by carrying out assessments plot by plot.
A third strength of the method is that the precise data about green infrastructure and real estate that are used are also valuable for other techniques and can help to support their assumptions. For example, a general comparison of the green infrastructure investments with real estate prices can be obtained immediately. The use of modern cartographic tools and geographical information systems can then support the generation of a broad range of further results.
Weaknesses
However, the method also displays many weaknesses. Firstly, the HPM is data-intensive. The data gathered, their accuracy and the period of time depend on the case study location, on the authors’ investigations and on public administration patterns. Thus, the search for data is very time consuming because the authors often depend on the cooperation of public administrations to obtain them and, consequently, the time required for this may be considerable.
Secondly, researchers have to deal with important econometric problems. The management of these problems depend on data availability and the specifics of the urban context. For each case study, researchers need to have a very strong general knowledge of their city and its different neighbourhoods (for example, in terms of architecture, history, clusters, hubs, centre of attraction etc.). This knowledge normally also has to be supported and confirmed by studying references, documents, and interviewing local actors.
Finally, the implementation of the HPM in the office sector (the most relevant from a scientific point of view) needs a metropolitan context with a significant dynamic regarding economic development (for example, substantial office transactions flows, a CBD and so on). Consequently, a consistent statistical approach that compares green infrastructure attributes with real estate prices (application of mathematical regression) needs a significant number of relevant transactions.
Conclusions
The implementation of the HPM within the framework of the VALUE project may be feasible and may potentially provide very robust results if sufficient data of appropriate character are available. The method allows for eliciting the impact of green infrastructure on economic development through the study of real estate values. In addition, this method offers the opportunity to work at a very small scale (plot by plot) and combines strong statistical and GIS tools with very precise data.
However, in order successfully to apply this powerful method, many difficulties have to be addressed. Firstly, this method cannot be used to compare different case studies. The hazards concerning the accuracy of the available data, the time required to collect them and the econometric problems faced prevent the standardisation of the methodology in the different case studies. In addition, these problems also prevent any relevant comparison of the results. Due to data property issues in the context of public administration, even for a single case study, some data will never be exploitable within the framework of scientific research. Consequently, data availability is the essential element, which leads to the success or failure of the HPM. Secondly, the literature suggests that the application of HPM to the valuation of the impact of green infrastructure on offices’ values may be scientifically attractive and may verify the impact of green infrastructure on economic development. However, the metropolitan context needed in terms of office transactions and green infrastructure developments limits the potential case studies in the partner regions of the VALUE project. In the former industrial regions of the VALUE partners, and more particularly referring to the investment sites themselves, the possibilities to find such a context are very few.
Nevertheless, even if it would be less innovative from a scientific point of view, the application of HPM to residential real estate is more easily conceivable within the framework of the VALUE project. Data gathered and preliminary interviews conducted as part of the HPM implementation might be exploited by other valuation methods. This multiple approach, implementing different methods in the context of one case study, could make it possible to reinforce the experiment and to confirm or to contradict the results.
Summarising, the author of a HPM case study needs to have three principal skills: - the ability to get sufficient, accurate data relating to real estate transactions
and green infrastructures,
- an extensive knowledge of the case study city and neighbourhood, and - strong statistical competencies.
2.1.3 Stated Preferences Techniques
(Simone Allin and John Henneberry)
Stated Preferences Techniques (SPTs) are monetary economic valuation techniques that fall within the overall framework of CBA (see Allin/Henneberry, 2009 and Moons, 2003, p. 5). In general, SPTs rely on asking individuals how much they value a specific good or service in question. Potentially, SPTs can be applied in almost any valuation context. They are based on a hypothetical payment scenario, which is defined and presented in great detail by means of a (mainly textual) questionnaire (DTLR, 2002, Introduction). SPTs can be contrasted with Revealed (or ‘Expressed’) Preferences Techniques (RPTs) which aim to deduce people’s willingness to pay for a good or service from observed market evidence (DTLR, 2002, Introduction; see also Allin/Henneberry, 2009 and Moug, 2008, p. 5).
In current practice, one of the limitations of SPT is related to cognition. This means that people may have difficulties in understanding the complexity of the (hypothetical) question(s) they are asked in the survey (DTLR, 2002, p. 28). Against this background, visual representations of the good or service in question play an increasingly important role in the context of SP studies (see further below). Furthermore, SPTs are complex and time consuming (for example, regarding the creation of primary data (Moug, 2008, pp. 5f)). Finally, the use of a sound methodology is crucial for the credibility of their results (DTLR, 2002, Introduction). Consequently, after choosing the SP approach as a means of economic valuation, a number of important decisions need to be taken. These relate to the survey method (for example, face-to-face interviews, telephone interviews, mail surveys or combinations of these), the sampling (including the definition of the target population, the sample structure and sample size), and the questionnaire design (including piloting and revision) (DTLR, 2002, p. 9).
There are two basic types of SPT: the ‘Contingent Valuation Method’ (CVM) and ‘Choice Modelling’ (CM). They can be used together in one study in order to increase the robustness of results and to check the underlying components of values (DTLR, 2002, p. 32). However, if a study requires rankings or ratings for individual attributes (or alternatives) of a good or service, CM should be used. If the goal is to identify the value of a good or service in its entirety, CVM is the preferable approach (DTLR, 2002, pp. 30ff.).
The Contingent Valuation Method
CVM can estimate the value, both for users and for non-users, of the good or service in question. It is the most common approach adopted in SP research and is particularly used for the economic valuation of large-scale projects and investments
(Moons, 2003, p. 5). Conventional CVM studies concentrate on the investigation of the value of the (non-market) good or service in its entirety (DTLR, 2002, Background). They can generally be seen as a procedure to convert (qualitative or quantitative) changes in (environmental) goods or services into monetary terms (in particular ‘Willingness to Pay’ (WTP) or ’Willingness to Accept’ (WTA)) (Moons, 2003, p. 11, see also Allin/Henneberry, 2009).
So far, the hypothetical nature of the method has given it a rather controversial status in practice (Moons, 2003, p. 11). First mentioned in the 1940s and then used as an empirical base of study in the 1950s, CVM achieved worldwide attention when applied to the assessment of the non-use damages caused by the Exxon Valdez oil tanker disaster in 1989 (Moons, 2003, p. 11f). As a consequence of the disagreement on the validity of the method between the State of Alaska and the Exxon Company, a systematic investigation of CVM was carried out in 1993 (Arrow et al. 1993). It came to the conclusion that CVM can be used as a starting point in judicial processes, provided the study follows a set of explicit guidelines. These guidelines include, for example, a ‘conservative’ study design (anticipating the underestimation of WTP), the necessity to offer people the option not to participate, and the usage of the binary valuation question (Moons, 2003, p. 12, see also Arrow et al., 1993).
Survey method
The appropriate choice of survey method in CVM (and CM) studies depends on the availability of (project) resources. Generally, the quality and reliability of the survey and its particular outcomes are determined by the time and money devoted to it (DTLR, 2002, p. 41). As CVM (and CM) studies exclusively rely on collected survey data (Moons, 2003, p. 12), both gains and losses of information and accuracy are strongly associated with the survey methods that are used.
So far, practitioners – in spite of the higher costs involved – generally recommend face-to-face surveys (DTLR, 2002, p. 41). Their crucial advantages relate to two main areas: firstly, the possibility of probing and clarification of the questions (Moons, 2003, p. 12) and, secondly, the use of visualisations and demonstrations to illustrate complex (and, thus, flexible) evaluation scenarios. Thanks to the use of visual aids, the particular research context in question and its complexity can be represented in a more adequate way. In addition to this, face-to-face surveys also provide a greater potential both for controlling the sample and for achieving higher response rates (DTLR, 2002, p. 41).
Sampling
After choosing the survey method, another crucial decision is needed on sampling. To this end, a sequence of critical steps has to be undertaken (DTLR, 2002, pp. 43f):
- Firstly, the target population needs to be defined. This can be the whole population of a country or region/city, or a defined group of people or sub-sample (for example, drivers of cars, pedestrians or public transport users, people of specified age groups, residents, visitors, and so on). The correct identification of the target population can be judged as the most critical task within the process of sampling. Getting it wrong can strongly bias subsequent valuation results. The definition of the relevant target population may require
the analysis of secondary sources (which indicate people who benefit from or pay for a good/service). It is affected by the good/service and its impact in question, as well as by the forms of value that are of interest. For example, assessments of non-use values (which are likely to be important in VALUE and the context of green infrastructure investments) generally require a wider geographic coverage. It is also possible to have more than one target population. This can provide a range of values in the final results of the study. - Secondly, a sample frame with a population that is as consistent as possible
with the target population has to be identified (e.g. all the dwelling units within a city, all the visitors to a particular park, beach etc.). Generally, the sample frame is an explicit list. Practical experience indicates that lists of specific, smaller populations are more easily accessible. Problems most commonly encountered with the sample frame relate to the omission of certain members of the target population, or to the multiple inclusion of members, or to the inclusion of people not of interest to the study.
- Thirdly, a sample of potential respondents is selected from the frame in order to apply the survey. Commonly, this is done by the use of randomised procedures/probability approaches (for example, a computer-generated list of random numbers). In practice, there exist various types of probability sampling methods that meet the particular requirements of different sample selection processes (for example, simple, systematic, stratified, clustered multi-stage random).
Finally, the sample size adequate for the particular purpose of study has to be chosen (DTLR, 2002, p. 45). In this regard, the relation between the budget and the precision of the estimate (> a larger sample size leads to a higher precision of estimates) plays a key role. Generally, the choice of sample size is determined by the following main factors (DTLR, 2002, p. 45):
- the variance in the underlying population (relative to the average; the bigger the variance, the bigger the required sample),
- the precision required in the estimates (benchmark = 95% confidence interval),
- the expected response rate,
- the need for any disaggregated information (the more sub-samples, the bigger the overall sample), and
- the resources available for the study.
Some reduction of sample size may be possible if more information per respondent is collected (e.g. in CM studies where multiple choices or valuations are elicited from each respondent) (see DTLR, 2002, p. 46 and below). However, it has to be pointed out that - both for statistical and survey research reasons - there is no automatism that allows a reduction of sample size by just increasing the amount of collected data per respondent (DTLR, 2002, p. 46).
In conclusion, the choice of sample size is a sophisticated statistical task, which usually requires professional advice from a statistician or survey specialist. However,
some rules of thumb are given in DTLR (2002, p. 45, Table 8.2). For further details and an introduction to statistical methods in general and the statistical basics of sampling in particular, see Norcliffe (1982).
Questionnaire design
The structure of a typical CVM questionnaire comprises the following components (DTLR, 2002, pp. 47ff. and Moons, 2003, pp. 12f):
- A statement on the purpose of the questionnaire including an introduction to the interviewing organisation(s) to ensure that respondents understand the context of research, are motivated to cooperate and thus are able to participate in an informed manner. In addition, the potential respondents should be assured that their answers will be treated confidentially.
- A set of attitudinal questions that aims to identify the respondent’s attitude to general issues related to the good or service in question.
- A set of questions that aims to determine the (non-)use of the good or service in question. The respondents are asked questions concerning their familiarity with the good/service in order to distinguish users from non-users.
- The (visual and text based) presentation of the hypothetical valuation scenario itself (including the description of the payment vehicle; for example, taxes, fees/charges, price increases and so on). This presentation is accompanied by a set of questions related to it, the most important of which is the value elicitation question (for example, open-ended elicitation, bidding game elicitation, payment card elicitation, single- or double-bounded dichotomous choice; concerning the particular question format see Moons, 2003, pp. 13f). In addition, a number of follow-up questions may be used to clarify the motives for and validity of the responses. A carefully designed valuation scenario is the central part of the survey as it defines the (nature of change in the provision of the) good or service in question and the institution that is responsible for providing it. Consequently, this forms the main basis for the respondents’ statements on preferences and values.
- A set of questions asking for the socio-economic characteristics (such as age, sex, interests, income, education and nationality) of the respondents. With the aid of this information, the statements given on the actual scenario can be tested against their conformity with theoretical expectations (for example, whether WTP varies with income).
Many economic valuation studies using SPTs (CVM and CM) can be criticised for devoting inadequate effort to the design and testing of the (draft) questionnaire (DTLR, 2002, p. 57). However, questionnaires need to be tested in terms of potential biases (for further details on types of biases see DTLR, 2002, p. 59, Table 11.1 and Garrod/Willis, 1999, pp. 153ff.). This, for example, is achieved through the use of focus groups (discussion conducted by a moderator among a small group of respondents) and/or a pilot survey (using 25-100 questionnaires) which normally lead to a revision and perhaps retest of the questionnaire as many times as necessary (DTLR, 2002, p. 57).
Finally, the use of questionnaires within CVM studies generally faces one specific problem: the risk of ‘embedding’. However, this risk can be reduced by designing questionnaires and scenarios carefully and thereby defining the change in the provision of the good or service in question as precisely as possible (DTLR, 2002, p. 53).
Choice Modelling
The application of CM within the context of economic valuation aims to measure the value of the individual characteristics/attributes of a specific good or service (Garrod/Willis, 1999, p. 9). Individuals participating in such experiments have to choose between different combinations of characteristics of a good or service over other combinations at various prices (Garrod/Willis, 1999, p. 9). Over recent years, the use of CM has become increasingly common (Moug, 2008, p. 7).
The main types of CM techniques are ‘Choice Experiments’ (choice between (usually) two alternatives, versus the status quo), ‘Contingent Ranking’ (ranking a series of alternatives), ‘Contingent Rating’ (scoring alternative scenarios) and ‘Paired Comparisons’ (scoring pairs of scenarios) (DTLR, 2002, p. 54).
Amongst these, the only technique that can be judged as consistent with the underlying theory of welfare economics is ‘Choice Experiments’ (DTLR, 2002, pp. 54f). These experiments aim to present respondents with a baseline scenario (the status quo) and several alternative options in which attributes are changed in quantity and quality. The set of attributes may also be determined by focus groups. Chosen attributes should include a money value representing a payment vehicle and, because of the potential limits to the cognitive abilities of the participating respondents, the number of attributes should be limited (DTLR, 2002, p. 55).
Thus, recent research on the operational pitfalls of CM focuses on the exploration of significant ‘interviewer effects’ (for example, physical appearance) and ‘information effects’ (e.g. level/type of information) on people’s responses in SP studies (see, for example, Bateman/Mawby, 2004; for more details on the outcomes of research on advantages and pitfalls within CM in particular or SP studies in general see also Moug, 2008, pp. 7ff.).
With regard to the details of the practical implementation of CM studies, the main methodological issues highlighted in relation to CVM studies (see above)are similarly applicable. However, some major differences occur in the design of questionnaires (DTLR, 2002, pp. 54ff.). Whereas CM questionnaires have more or less the same structure as CVM questionnaires, they obviously differ in terms of the contents of the ‘valuation scenario’ (DTLR, 2002, p. 47). Accordingly, in CM studies the scenario describes a good or service in terms of its particular attributes/characteristics and their (qualitative/quantitative) change (DTLR, 2002, pp. 54f).
The common design stages in CM studies are as follows (DTLR, 2002, p. 55, Table 10.2 and Garrod/Willis, 1999, p. 205):
- Identification of the good or service to be investigated, the selection of key attributes and the determination of their levels. The number of attributes per good/service should be limited to 4 or 5, including a monetary cost to allow the estimation ofWTP. The selection of attributes is usually achieved through
literature reviews, the use of focus group discussions (> initial screening of attributes) or direct questioning.
- Assignment of levels: the attribute levels should be realistic and span the range over which respondents can be expected to have preferences. They may include policy targets, and should comprise the ‘do-nothing’ level and a range about the existing level in order to elicit a WTP for a gain or to avoid a loss. - Choice of experimental design: generally, statistical design theory is used to
combine the levels of attributes into a number of alternative (environmental) scenarios or profiles to be presented to the respondents.
- Construction of choice sets: the profiles identified by the experimental design are grouped into certain choice sets that are presented to the respondents. This presentation of profiles can be undertaken individually, in pairs or in groups. - Measurement of preferences: concerning the choice of survey procedure and
conduct of the survey itself, it can again be related to the specifications for the context of CVM studies (see above).
Choice Modelling (and CVM) in combination with Virtual Reality technologies (VR) and visualisations
The use of (interactive) ‘virtual’ environments, their modelling, generic simulation and visualisation has increased in importance within many recent CM (and also CVM) studies, particularly in the context of landscape planning and design (for further information see Lange/Bishop, 2005).
As already mentioned above, virtual environments and computer visualisations support the presentation of alternative and complex choice scenarios and provide a genuine advance in the delivery and perception of information within environmental economic studies (see also Working Paper 1.2.6). Thus, they make a particularly significant contribution to the quality of participatory planning and design processes (Garrod et al., undated, p. 9 and Greenspace, 2005, p. 57).
So far, some of the key issues regarding the current and future use (and, thus, the further development) of VR and visualisation techniques in CM studies are the provision of real-time and interactive simulations/virtual environments/visualisations, maximised realism and (3 and/or 4D-) immersion scenarios, as well as the discussion of the constraints arising from the respondents’ (visual) cognition/perception and its role in complex mental processes such as reasoning or decision-making.
Summarising, VR and visualisation techniques represent an appropriate means of promoting the perception of the issue(s) in question and offer a valid foundation for the articulation of choices/preferences by the respondents (Greenspace, 2005, p. 57). However, at the moment visualisation techniques appear mainly to be limited to the representation of the visual attributes of a given decision or choice context (neglecting other attributes of urban environments such as noise, smell, safety, social issues and so on).
2.2 Evaluation Techniques at the City/Region Scale 2.2.1 General Overview of Existing Approaches
(Simone Allin, John Henneberry and Karsten Rusche)
Two broad approaches to modelling the impact of green investments on urban and regional economies may be highlighted. The first is based on the determination of regional income and employment. A central feature of regional economic models is that they build on input-output linkages between economic agents such as firms (that sell goods and services, including to other firms) and households (who sell their labour services and buy goods and services). These linkages, which include direct as well as indirect or induced effects on income and employment, occur both within and between regions (Armstrong/Taylor, 2000, p. 7). Furthermore, a new production activity (for example, the building of a new plant) has impacts on a local economy as a result of feedback effects (multiplier processes). Consequently, an initial injection of capital is followed by (complex) consecutive rounds of expenditure, until the multiplier effect has worked its way through the economic system (Armstrong/Taylor, 2000, pp. 7f). Against this background, a regional version of the Keynesian model can be used to estimate the effects of expenditure injections on (total) local and regional economies. In particular, this implies the usage of regional multiplier analysis (Armstrong/Taylor, 2000, p. 33).
The input-output approach to modelling the regional economy is based on the simple notion that the production of output requires inputs (goods, services) and, consequently, it is possible to identify these input-output linkages within a region (Armstrong/Taylor, 2000, pp. 35f). Over recent decades, a large number of regional input-output models have been constructed. They are meant to provide a consistent and detailed industry-by-industry breakdown of the predicted effects of specific changes in demand in the longer term (Armstrong/Taylor, 2000, pp. 43, 50). Furthermore, output, income and employment multipliers can be obtained from the input-output model (Armstrong/Taylor, 2000, pp. 43ff.).
Alternative approaches to assessing the impact of green infrastructure investments at the city/region scale derive from the literature on competitiveness or competitive economic performance of city-regions in knowledge-driven economies. One main issue of concern in this context is the provision of socio-cultural facilities and assets. They strongly influence the ‘quality of life’ and thus the attractiveness of a city-region and are an important source of competitive advantage (DCLG, 2006, pp. 55f). Current definitions of ‘quality of life’ generally combine social, environmental and place characteristics (DCLG, 2006, p. 99).
The above approaches are considered in more detail in the following sub-sections of the report.
2.2.2 Input-Output Analysis in Combination with Multiplier Analysis
(Nel Ghyselinck, Frank Stubbe and Bert Vermeire)
Any economic activity has an impact on other economic activities and all connected through input-output relationships. Consequently, a green infrastructure investment will generate effects both on the demand and on the supply side. These will ripple through the economy, generating additional activity and supporting the economic competitiveness of the region as a whole. Multipliers measure the total change throughout the economy arising from one unit change in a given sector. For example, if the multiplier is 1.5, for every €1 invested in green infrastructure an additional value of €0.5 will be produced further downstream in the economy. The advantage of this technique is that it shows how sectors are interrelated. It also gives an overview of the indirect and induced effects of investments across sectors.
Generally, the input-output analyses described in the literature demonstrate the importance of an industry or sector to the regional economy in its entirety. The role of nature, forest, landscape and natural heritage within the local economy has been described by Courtney et al. (2006), Berends & Vreke (2002), Bos & Van Leeuwen (2001) and others. The small scale of the impact of a green investment requires very local input-output tables, which oftentimes are not available (Bogaert et al. 2004). Berends & Vreke (2002) and Bos & Van Leeuwen (2001) provide a possible solution, which is to ‘localise’ national input-output tables. An important bottleneck for this multiplier analysis is the general lack of adequate and compatible data. This applies in particular where data is needed across ‘traditional’ borders of different economic ‘sectors’ (Knickel/Renting 2000).
Description of overall input/output framework
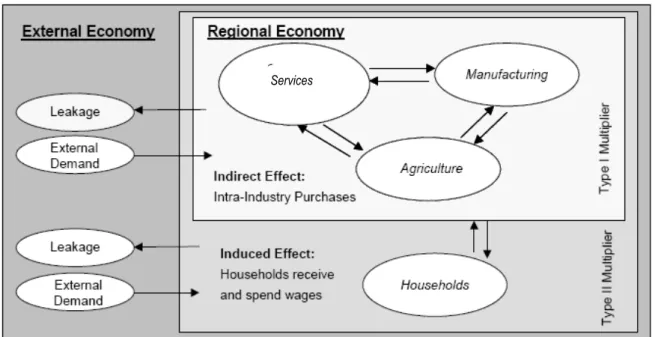
The term multiplier effect relates to effects that are indirect either in spatial terms or in terms of the actors and activities involved. From a conceptual point of view, multiplier effects are related to other segments of the rural economy and not to the specific enterprises which have been the focus of analysis (Knickel/Renting, 2000). In general, multiplier effects are positive (that is, they produce additional benefits, income or employment). In this context, the development of green bicycle trails can serve as an example. A green investment (for example, the construction of a bike way) creates economic activity. This is a direct effect. Changes in final demand (for example, more tourists) infuse local industries with new funds, which increase overall output and employment (Ribeiro/Warner, 2004). Enterprises such as shops, restaurants and local tourist entrepreneurs may also benefit from the spending of these tourists. These are induced effects (see below).
Through input-output analysis, the multiplier can be calculated. It is a technique for tracing resources and products within an economy. The system of producers and consumers is divided into different branches, which are defined in terms of the resources they require (inputs) and their products (outputs). The quantities of input and output for a given period of time, usually expressed in monetary terms, are incorporated into an input-output matrix. Input-output analysis can be used for different analytical purposes (Berends et al., 2001; Dwyer et al., 2004). There are two types of linkage effects which can be measured by input-output analysis and which result in a multiplier: