INTRODUCTION
Meiofauna in marine sediments often includes an important number of harpacticoid copepods, usually only surpassed in abundance by nematodes (Hicks & Coull 1983). Harpacticoids transfer primary produc-tion to higher trophic levels, mainly to larval and juvenile demersal fish (Gee 1989, Schückel et al. 2013). Their main food sources, in turn, probably
consist of microalgae such as diatoms (Montagna et al. 1995, Buffan-Dubau & Carman 2000), but cyanobacteria, phytoflagellates, cyanobacteria, detritus and exo -polymeric mucus have also been reported as food (e.g. Hicks & Coull 1983, Dahms et al. 2007, Cara-mujo et al. 2008). Despite this broad dietary spec-trum, there is little evidence to suggest that harpacti-coids are indiscriminate feeders, and rather little is known about resource partitioning (Lee et al. 1976,
© Inter-Research 2015 · www.int-res.com *Corresponding author: [email protected]
Trophodynamics of estuarine intertidal harpacticoid
copepods based on stable isotope composition and
fatty acid profiles
Clio Cnudde
1, Tom Moens
1, Eva Werbrouck
1, Gilles Lepoint
2,
Dirk Van Gansbeke
1, Marleen De Troch
1,*
1Ghent University, Marine Biology, Krijgslaan 281/S8, 9000 Gent, Belgium
2University of Liège, MARE Centre, Laboratory of Oceanology, Allée du 6 août B6, 4000 Liège, Belgium
ABSTRACT: Trophic interactions at the basis of food webs, for instance between meiofauna, pri-mary producers and bacteria, are key drivers of benthic energy fluxes. Yet both qualitative and quantitative information about meiofaunal resource utilization under in situ conditions is scant. By means of natural stable isotope ratios of carbon and nitrogen and of fatty acid (FA) profiles, we examined the variability of in situ resource utilization of a range of harpacticoid copepod species from 5 stations in an estuarine intertidal area. These stations, located in different habitats, differed in sediment granulometry, resource availability, presence/absence of vegetation and other envi-ronmental variables, as well as in copepod species composition. Our goal was to describe inter-specific differences among harpacticoid species, as well as spatio-temporal variability within species. Despite differences in resource availability between habitats, δ13C data clearly point at
microphytobenthos (MPB) as the major carbon source to the harpacticoid assemblages at all 5 sta-tions. Small differences in carbon isotopic ratios between co-occurring species indicate some degree of resource differentiation, whereas both the δ15N and FA composition suggest that several
harpacticoid species obtain MPB carbon indirectly, perhaps through feeding on bacteria or ciliates. For a limited number of species, such as Paraleptastacus spinicauda, clear dietary contri-butions of suspended particulate matter and bacteria were found, and MPB appeared to have only a small or no contribution. Even in vegetated salt-marsh stations, Spartina anglica detritus did not appear to contribute to copepod diets. The δ13C of Cletodidae were highly depleted, reflecting a
contribution of methane-derived carbon.
KEY WORDS: Harpacticoid copepods · Intertidal · Fatty acids · Stable isotopes · Feeding ecology · Seasonal variability · Scheldt estuary
Pace & Carman 1996, Buffan-Dubau & Carman 2000). Furthermore, when feeding conditions are unfavor-able, harpacticoids can adjust their feeding rate (Montagna et al. 1995), may shift to alternative food sources as observed for planktonic copepods (Ger et al. 2011), or survive on their lipid reserves (Weiss et al. 1996). The copepod’s fatty acid (FA) profile, and in particular their high levels of the highly unsaturated FAs (PUFA) 20:5ω3 (eicosapentaenoic acid; EPA) and 22:6ω3 (docosahexaenoic acid; DHA) contribute to the nutritional value of copepods for fish (Nanton & Castell 1998, Bell et al. 2003). Therefore, variability in copepod FA content as a result of diet flexibility in response to spatial and temporal environmental vari-ability may have consequences for the copepod’s value as food for higher trophic levels (St. John et al. 2001). Much of the information on harpacticoid feed-ing selectivity and flexibility is derived from labora-tory experiments, whereas studies revealing the in
situ contribution of different food sources to the diet
of harpacticoids are few and have used natural stable isotope approaches (Carman & Fry 2002, Rzeznik-Orignac et al. 2008). Natural stable isotope abun-dances and FA profiles can provide complementary information on trophic interactions. Consumer FA composition may clarify ambiguities on resource consumption that remain as a consequence of over-lap of isotopic signatures between food sources (El-Sabaawi et al. 2009, Leduc et al. 2009).
In intertidal zones, small-scale habitat heterogene-ity and temporal variabilheterogene-ity in environmental factors result in high spatio-temporal variability of harpacti-coid assemblages (Azovsky et al. 2004, Cnudde et al. unpubl. data). Whether and how these
structural shifts are accompanied by shifts in resource utilization and partitioning has not been properly investigated yet, although this is crucial to understand the role of harpacticoids in benthic energy fluxes. Using both natural isotopic signa-tures and the FA composition of harpacti-coid copepods, this study focuses on the spatial and temporal diet variability of harpacticoid species in a temperate inter-tidal zone with a high habitat hetero-geneity. Harpacticoids were collected sea-sonally from 5 intertidal stations dif fering in tidal height, granulometry and vege -tation (salt marsh vs. bare tidal flat). The first aim of this study was to investi-gate variation in resource utilization by har pacticoids throughout the year. This can give an indication of the trophic
diversity of Harpacticoida in a spatially and tempo-rally heterogeneous ecosystem. The second aim was to examine dietary variability of species in space and time, which is an indication of their potential trophic plasticity.
MATERIALS AND METHODS Study area
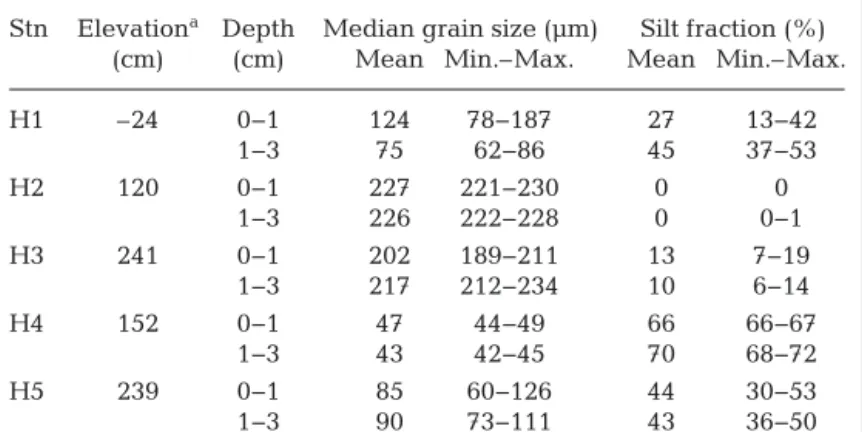
Harpacticoids were collected from 5 stations in the intertidal of the Paulina tidal flat and salt marsh, located along the southern shore of the polyhaline zone of the Westerschelde Estuary (SW Netherlands, 51° 20’ 55.4’’ N, 3° 43’ 20.4’’ E). The 5 stations differed in terms of intertidal position (tidal height), granu-lometry and vegetation and, therefore, also in re -source availability and diversity. The 5 stations were located over an east−west distance of approximately 670 m and a north−south distance of approximately 550 m. The first 2 stations (H1 and H2) were situated on the bare tidal flat. Stn H1 was located in the lower intertidal and exhibited a temporally variable granu-lometry in the upper centimeters of the sediment, while Stn H2 was located in the mid-intertidal and was characterized by fine sandy sediment with a negligible silt fraction throughout the year (Table 1). The Stns H3, H4 and H5 were situated in or at the edge of the marsh area. H3 was a small bare sedi-ment patch in the mid- to high intertidal surrounded by Spartina anglica. Samples were collected within 10 cm of the Spartina vegetation, in sediments
domi-Stn Elevationa Depth Median grain size (µm) Silt fraction (%) (cm) (cm) Mean Min.–Max. Mean Min.–Max.
H1 –24 0−1 124 78−187 27 13−42 1−3 75 62−86 45 37−53 H2 120 0−1 227 221−230 0 0 1−3 226 222−228 0 0−1 H3 241 0−1 202 189−211 13 7−19 1−3 217 212−234 10 6−14 H4 152 0−1 47 44−49 66 66−67 1−3 43 42−45 70 68−72 H5 239 0−1 85 60−126 44 30−53 1−3 90 73−111 43 36−50 aTidal height with reference to Normal Amsterdam Level, 2010 to 2011; source Rijkswaterstaat
Table 1. Sediment characteristics of sampling stations H1 to H5 for the top 1 cm and 1 to 3 cm. Tidal height and mean values of the median grain size and silt fraction are given. The range (Min.−Max.) represents temporal variation (n = 4, measurements from June, August, November and February)
nated by fine sand with a variable mud fraction (0 to 25%). Stn H4 was located in the high intertidal, near
Spartina vegetation, as well as a small area with
stones covered with Fucus vesiculosus. Samples were collected at about 1 m from the Fucus vegetation. Stn H5 was positioned in a major drainage gully of the marsh, surrounded by dense vegetation, dominated by a combination of S. anglica, Aster tripolium and
Atriplex portulacoides. Sediment grain composition at
this station varied considerably over time (Table 1). Samples were collected from the bed of the gully. Since Stns H3, H4 and H5 were in close proximity of salt-marsh vegetation, we refer to these as salt-marsh stations.
Sampling
Four sampling campaigns were performed in 2010 to 2011, covering the 4 calendar seasons: 2 to 3 June 2010, 31 August to 1 September 2010, 29 to 30 November 2010 and 7 to 8 February 2011. Sediments were sampled for analysis of harpacticoid and sedi-ment FAs and stable isotopes. Additionally, samples were taken for the analysis of harpacticoid assem-blages, and of biotic and abiotic sediment character-istics, including sediment granulometry, dissolved nutrients, total organic matter, phytopigment con-centrations, lipid and protein concon-centrations, and bacterial abundances and diversity (C. Cnudde & M. De Troch, unpubl. data).
Harpacticoid copepods for isotopic and FA ana -lyses were sampled non-quantitatively by scraping sur face sediment (top 1 cm) with a spoon during low tide. Copepods were extracted by rinsing the sedi-ment over a 250 µm sieve. The sieve residue was divided into 2 equal halves. Copepods from one half were collected alive for FA analysis, while the other half was stored at −20°C for stable isotope analyses. We also collected triplicate sediment samples for iso-tope and FA analysis of bulk sediment particulate organic matter (sediment OM) by means of 3.5 cm diameter Plexiglas cores. These sediment cores were sliced into 0−0.5 and 0.5−1 cm layers. Suspended particulate material (SPOM) was obtained through filtration of surface water collected near the low water level on a precombusted GF/F Whatman glass fibre filter. Fresh and decaying leaves or thalli of cordgrass, Spartina anglica, and of the macroalga
Fucus vesiculosus were collected, rinsed with MQ
water to remove adhering sediment particles, and their epigrowth was scraped off using a glass slide cover slip. This ‘biofilm’ material was collected in
MQ water and then concentrated through centrifu-gation. Epiphytic biofilm samples and (epiphyte-free) cordgrass/ macrophyte material were stored at −20°C prior to isotopic analysis, and so were sediment OM and SPOM samples for isotope analysis. Copepod and sediment samples for FA analysis were stored at −80°C.
Fatty acids
FA samples were prepared from living copepod specimens within 2 d after field sampling to minimize FA losses. Copepods were manually sorted at the species level, or at the family level when their abun-dance was low (Harpacticidae, Ectinosomatidae and Cletodidae). Copepod species were washed 3 times in 0.2 µm filtered and autoclaved artificial seawater (Instant Ocean, salinity of 28) (ASW) to remove cuti-cle-attached particles, and were stored overnight at 15°C to allow defecation. The following day, cope-pods were washed a last time by transferring them through sterile ASW, and collected on a precom-busted GF/F Whatman filter (diameter: 25 mm). Filters were stored in Eppendorf tubes at −80°C until FA extraction. The target sample size was 100 speci-mens per filter, but actual sample size and number of replicates depended on the abundance and biomass of the copepod taxa: down to 60 specimens per sam-ple for the largest taxa (e.g. Platychelipus littoralis and Harpacticidae), and up to 500 specimens for
Paraleptastacus spinicauda; 10 specimens of each
copepod taxon were preserved in ethanol for species identification. For fatty acid methyl ester (FAME) analysis of sediments, 1 to 1.5 g of lyophilized and homogenized sediment was used.
Lipid extraction, FA methylation and analysis of FAMEs were performed according to De Troch et al. (2012a). FAMEs were separated using a gas chro-matograph (HP 6890N) with a mass spectrometer (HP 5973) based on a splitless injection (i.e. 1 µl and 5 µl of extract for sediment and copepods, respectively) at a temperature of 250°C on an HP88 column (Agilent J&W). FAMEs were identified based on comparison of relative retention time and on mass spectral libraries by means of the software MSD ChemStation (Agilent). FAME concentrations (µg FA g−1sediment dry weight) were calculated based on the internal standard 19:0. The FA shorthand notation A:BωX was used, where A represents the number of carbon atoms, B gives the number of double bonds and X is the position of the double bond closest to the terminal methyl group (Guckert et al. 1985). Since copepods
from the 2 depth layers (0−0.5 cm and 0.5−1 cm) from a sediment core were eventually pooled, sediment FAs from the same 2 layers were combined by summing their raw FA data (i.e. surface areas of chromatogram peaks) and converting these to FA concentrations (µg FA g–1sediment dry weight). Abso
-lute FA concentrations of sediment and copepods were converted to proportions (%) of total sample FA content.
Several potential food sources of harpacticoid copepods have unique marker FAs or are character-ized by a specific combination of FA (indicator FA). Diatoms and dinoflagellates contain high levels of 16:1ω7 and 20:5ω3 (EPA) and of 22:6ω3 (DHA), respectively (Volkman et al. 1980, Viso & Marty 1993, Scholz & Liebezeit 2013). High ratios of DHA/EPA and 16:1ω7/16:0 are commonly used as indicators of preferential feeding on dinoflagellates or diatoms, respectively (Dunstan et al. 1993, Kharlamenko et al. 2001). Because diatoms often lack C18
polyunsatu-rated FA (C18-PUFA), the presence of these FAs in
consumers indicates other food sources, such as vas-cular plants for which 18:2ω6, 18:3ω3 and 24:0 are considered indicator FAs (Bergamino et al. 2014, Wang et al. 2014). Here, these FAs could, for instance, relate to the detritus of salt-marsh vegeta-tion or to allochtonous terrestrial matter. Marker FAs of bacteria are odd-chained FAs (15:0, 15:1ω1, 17:0 and 17:1ω1) and also 18:1ω7c (Volkman et al. 1980, Kaneda 1991, Van Gaever et al. 2009). Carnivory is often deduced from the ratio of PUFA/saturated FA (PUFA/SFA) and from the FA 20:1ω9 (Cripps & Atkinson 2000).
Stable isotopes
Harpacticoids for isotope analysis were obtained by handpicking and washing specimens thoroughly in ASW using an eyed needle. The copepod samples were processed within 2 to 3 d and kept cool during handling. Less copepod biomass is needed for car-bon isotope than for FA analysis, and we prepared triplicate samples of each harpacticoid taxon. Gen-erally, each sample was composed of at least 20 specimens in a precombusted (450°C, 3 h) alu-minium capsule (2.5 × 6 mm; Elemental Microa -nalysis). For smaller species (e.g. Paraleptastacus
spinicauda), considerably more individuals
(typi-cally 100) were collected. For the most abundant harpacticoid taxa, we prepared 1 or more sample(s) for dual (i.e. carbon and nitrogen) isotope analysis. Such samples usually contained 60 to 150
speci-mens, but up to 500 for P. spinicauda. Samples of plant material, epiphytes, SPOM and sediment OM were dried at 60°C and ground with mortar and pestle for homogenisation. Samples of 5 to 6 mg of plant material were prepared in tin capsules. Epiphyte (4−6 mg), SPOM (4−6 mg) and sediment samples (40−80 mg) were prepared in silver cap-sules and acidified in situ with dilute HCl (1% v/v) to remove carbonates (Nieuwenhuize et al. 1994). Capsules were dried overnight at 60°C, closed and stored dry until analysis. Stable carbon and nitrogen isotope ratios were analyzed using a C-N-S ele -mental analyzer coupled to an isotope ratio mass spectrometer (Sercon). Isotopic ratios were ex pressed as δ values (‰) with respect to Vienna PeeDee Belemnite and atmospheric N2 standards: δX =
[(Rsample/Rstandard) − 1] × 103, where X is 13C or 15N
and R is the isotope ratio (Post 2002). Sediment iso-topic data represent the top 1 cm, and have been obtained by averaging the signatures of the 0−0.5 and 0.5−1 cm layers from a sediment core.
Data analysis
Sediment resource availability and composition were analyzed based on the univariate data, includ-ing sediment δ13C, sediment δ15N and total FA
con-tent, as well as on the multivariate relative FA com-position data. After log-transformation, total FA content matched the assumptions of normality and homogeneity of variances (Shapiro-Wilk and Levene test, respectively). Two-way ANOVA was performed using stations (Stn) and months (Mo) as fixed factors. Tukey’s HSD (honestly significant difference)-test was used for a posteriori pairwise comparisons. As isotopic data did not match the requirements for parametric ANOVA, and in some cases also suffered from low replication, 2-way permutational ANOVA (PERMANOVA, main test and pairwise test) with Stn and Mo as fixed factors was applied. Variability in FA composition, as well as in the proportions of individ-ual FAs or in FA ratios, was also inspected using multivariate or univariate PERMANOVA based on a Euclidian distance or Bray-Curtis resemblance matrix, respectively. Homogeneity of dispersions was checked via the PERMDISP routine. When this homogeneity is not met, interpretation of significant factor effects should be done with caution. For pairwise tests with <10 unique permutations, Monte Carlo p-values were interpreted (Anderson & Robinson 2003).
Variation in copepod δ13C signatures was also
often indicated heterogeneity of dispersions, any sig-nificant differences between these copepod isotope data need to be interpreted with caution.
Variability in the relative FA composition of sedi-ment and copepods was visualized by non-metric multi dimensional scaling (nMDS) based on a Bray-Curtis resemblance matrix of untransformed relative FA profiles. Differences in the most abundant FAs in sediments, as well as the FAs contributing to the unique character of stations (% contribution to group similarity) or to differences among stations or sampling dates (% contribution to dissimilarity), were determined using a 2-way similarity percent-ages (SIMPER) ana lysis. Additionally, a 1-way SIM-PER (factor Mo) was performed for each station to denote temporal FA patterns. Variability in the pro-portions of individual FAs was inspected using uni-variate PERMANOVAs.
Parametric analyses were performed in R. All other analyses were conducted in Primer V6 (Clarke & Gorley 2006), using the PERMANOVA + add-on package (Anderson et al. 2008).
RESULTS Resources and sediment
Stable isotopes
Fresh Spartina and Spartina litter were enriched in 13C compared to other sources; Spartina litter
was slightly more depleted in 13C than fresh leaves,
and its δ13C value overlapped with that of micro-phytobenthos (MPB; Fig. 1a, Table S1 in the supple-ment at www. int-res.com/articles/suppl/m524 p225_ supp. pdf). MPB isotopic data were obtained from the study by Moens et al. (2005). Epiphytic bio-films had intermediate δ13C, whereas Fucus litter
and SPOM were more depleted in 13C. δ15N values
increased from SPOM and MPB to epiphytes, Spar
-tina and Fucus, spanning a total range of 10 ‰.
δ15N of Fucus even exceeded that of most copepods
(Fig. 1a).
Sediment OM showed spatial variability in δ13C
(Fig. 1a) spanning a range of > 4 ‰ (Table S1). δ13C
of sediment OM did not differ between sampling dates (main test: Stn: p < 0.001, Mo and Stn × Mo: p > 0.1) (Fig. 1b). In addition, nitrogen isotopic com-position also differed between stations (main test: Stn: p < 0.001, Mo: p > 0.8, Stn × Mo: p < 0.01), par-ticularly between Stns H4 and H5 and the other stations (p < 0.01).
Fatty acids
Total FA content of sediment OM varied consider-ably among replicates (main test: Stn: p < 0.01, Mo: p < 0.05, Stn × Mo: p < 0.001). As a result of small-scale patchiness, significant spatial differences were limited and time specific (Fig. S1 in the supplement at
www.int-res.com/articles/ suppl/ m524 p225_ supp. pdf). Temporal changes were only significant for Stn H1 (p < 0.05 for June to August, June to November and November to February), and the exact timing of max-imum and minmax-imum FA content was station specific (Fig. S1).
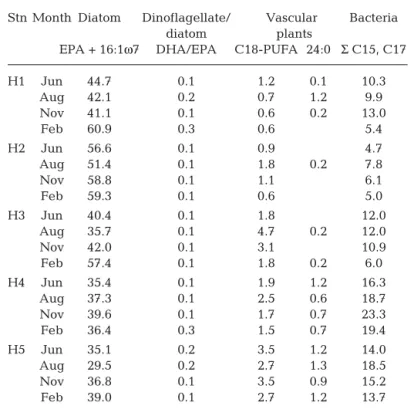
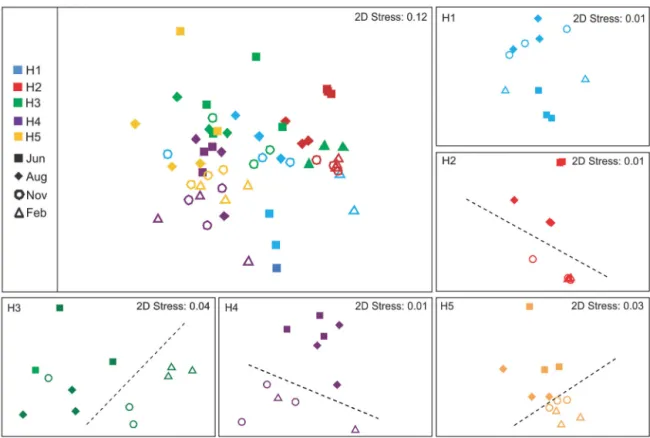
The FA composition of sediments also varied (main test: Stn, Mo and Stn × Mo: all p < 0.001; PERMDISP of Stn × Mo: p = 0.009), mainly between sediments of Stn H2 and of salt-marsh stations (most p < 0.05). Higher contributions of diatom FAs were found in sediments of Stn H2 compared to the saltmarsh sedi -ments, which in turn were characterized by higher levels of bacterial and vascular plant FAs. However, diatom FAs were prominently present in all sedi-ments, while the contribution of vascular plant FAs to sediment FAs was generally low (C24:0; Table 2). Station differentiation over time was not consistent. For instance, the sediment of Stn H1 had a very char-acteristic FA pattern in June (H1 vs. all other stations: all p < 0.05), and the usually quite similar salt-marsh stations exhibited significant differences in Novem-ber (Stns H3, H4 and H5, all p < 0.05). Vice versa, seasonal fluctuations in FA composition were station specific (main test: Stn × Mo: p < 0.001). Sediment of Stn H2 had the lowest temporal variability in FA composition, and there was a general trend of shift-ing FA composition between warmer and colder peri-ods (Fig. 2, for data see Table S2 in the Supplement at
www.int-res.com/articles/suppl/m524p225_supp. pdf), except for Stn H1.
Overall, the most characteristic sediment FAs were 16:1ω7 (diatom specific), 16:0 and EPA (20:5ω3) (≥10% contribution to similarity within stations and within months; 2-way and 1-way SIM-PER, respectively). These together constituted up to 78.0% of the FAs in Stn H2, considerably more than in Stns H4 and H5 (ca. 57.0%). The latter 2 stations had higher contributions of the bacterium-specific FAs 15:0, 15:1ω5, and, for Stn H5, also 18:1ω7c. Spatial and temporal variability in sedi-ment FA composition were often accounted for by the same characteristic FAs. EPA and DHA gen -erally increased in relative abundance in winter. Bacterium-specific FAs showed a reverse trend (e.g. Stns H3, H5).
Copepods Stable isotopes
Harpacticoid δ13C values ranged from −40.3 to
−12.1 ‰, with Cletodidae (a mixture of 3 species:
Enhydrosoma gariene, Enhydrosoma sp. and Cleto-camptus sp.) having by far the most depleted values.
Copepod carbon isotopic data differed among sta-tions and months (Stn, Mo: p < 0.001, Stn × Mo: p > 0.3, PERMDISP for Stn and Mo: p = 0.018, p = 0.0001). Highest δ13C values were found at Stn H2 (all p <
0.001), and lowest values, in Stns H3, H4 and espe-cially H5 (with H1 and H2, all p < 0.05; between H3−H4−H5, all p ≥ 0.05) (Fig. 3). The majority of har -pacticoid copepod species had average δ13C values
between −14 and −18 ‰ (Fig. 4). Aside from Cletodi-dae, the copepod taxa with lowest δ13C values were
Paronychocamptus nanus, Amphiascus sp. 1 and Microarthridion littorale. However, the δ13C of these
species was not consistently low over time and sta-tions. For instance, M. littorale, which was present at most stations and during most of the year, exhibited significant temporal variability in δ13C (Stn: p > 0.7,
Fig. 1. (a) δ13C and δ15N values (averaged over the 4 sampling moments, mean ± SD, n = 2–5, see Table S1 in the Supplement) of sediment particulate organic matter (OM), candidate food sources and copepods (cop) in the Paulina study area. (b) OM iso-topic composition of the top 1 cm of the sediment (mean ± SD, n = 2) (detail of Panel a). Note that SD of food sources represent primarily temporal variation (>1 ‰; Table S1) rather than variation among repli-cates (mostly <1 ‰; Table S1). In contrast, for sedi-ments, considerable variation among replicates was present (Panel b). SPOM: suspended particulate organic matter; Epiphytes: epiphytes from Fucus vesiculosus and Spartina anglica, associated with fresh and decaying tissue; MPB: microphytobenthos. *Data from Moens et al. (2005). Copepod data points represent individual taxa from a particular month and station (H1 to H5, with variable number of repli-cates, n = 1 to 3; see Table S4 in the Supplement)
Mo: p < 0.001 and Stn × Mo: p < 0.05), but only at Stns H4 (between June−August and August−November, both p < 0.05) and H5 (between August−November and February−November, both p < 0.05).
The copepod taxa with highest δ13C values were
Asellopsis intermedia and Paraleptastacus spini-cauda. The latter species did not exhibit significant
spatial or temporal variation in δ13C (Stn: p > 0.4, Mo:
p > 0.2, Stn × Mo: not tested due to limited dataset), while the former did (Stn, Mo: both p < 0.01, Stn × Mo: p > 0.2). In fact, a majority of copepod taxa showed significant spatial and/or temporal variation in δ13C values. The maximal temporal range of δ13C
values was up to 7.8 ‰ for P. nanus at Stn H5 (between November and February), identical to the maximal spatial range of δ13C (between Stns H1 and
H5 in November). Copepod taxa with no significant spatio-temporal variability were P. spinicauda and unidentified Harpacticidae. An overview of δ13C
val-ues per copepod taxon over all stations and sampling months is given in Table S3 in the Supplement. The carbon isotopic ratios of most copepod taxa closely resembled those of MPB and of Spartina anglica detritus (Fig. 1a).
δ15N values of copepods covered a range
of ca. 5.5 ‰, but note that this dataset is much more limited than the one on stable carbon isotopes (Fig. 1a, Table S4 in the Supplement).
Fatty acids
FA content of copepods varied over spe-cies and months (PERMANOVA; Spespe-cies, Mo: both p < 0.001, Species × Mo: p < 0.01), being 2 to 10 times lower in spring than in winter (for each Species, p < 0.05). The rela-tive FA profiles showed no clear grouping of copepod samples by station or sampling date (Fig. 5a, Table S5 in the Supplement), al though there was a tendency for samples from June to August to be separated from November to February samples (Fig. 5a), in line with the results of a 2-way PERM-ANOVA (Stn: not significant, Mo: p < 0.001, Stn × Mo: p < 0.01, PERMDISP: p = 0.0003). Levels of the highly ab undant PUFA, DHA and EPA groups strongly differed over time (factor Mo: p < 0.001 for both PUFAs). Cope-pods sampled in November and Feb ruary generally showed higher amounts of DHA (Table 2). Furthermore, copepods did not group by taxon, exceptions being Paraleptastacus
spinicauda and Nannopus palustris (Fig. 5b).
The FA composition of P. spinicauda was charac terized by (1) the near absence of conventional dia -tom markers (16:1ω7, EPA and DHA), (2) the high abundance of bacterial FAs (Σ C15, C17) and (3) considerable proportions of 14:0, an unspecific FA (Tables S5 & S6 in the Supplement). FA profiles of N.
palustris were dominated by PUFAs (> 50% of total
FA), with a predominance of EPA, and intermediate levels of 16:1ω7. C18-PUFAs were present in low
pro-portion (≤2.3%) in nearly all species and absent in P.
spinicauda, Cletodidae and Ectino somatidae. The FA
16:1ω7 was present in nearly all copepod taxa, except Cletodidae, P. spinicauda and Ectinosomatidae, albeit with high spatio-temporal variability for most species. The 16:1ω7/16:0 ratios generally did not exceed 1. P.
spinicauda, Delavalia palustris and Amphiascus sp. 1
contained considerably higher proportions of bacterial FAs [Σ (C15, C17), Table S6] than other copepods. The one sample of Cletodidae did not contain substantial levels of these bacterial FAs or of 18:1ω7c (Table S6). Dinoflagellate FA levels in copepods were lower than those of diatom markers, as shown by DHA/EPA ratios Stn Month Diatom Dinoflagellate/ Vascular Bacteria
diatom plants
EPA + 16:1ω7 DHA/EPA C18-PUFA 24:0 Σ C15, C17
H1 Jun 44.7 0.1 1.2 0.1 10.3 Aug 42.1 0.2 0.7 1.2 9.9 Nov 41.1 0.1 0.6 0.2 13.0 Feb 60.9 0.3 0.6 5.4 H2 Jun 56.6 0.1 0.9 4.7 Aug 51.4 0.1 1.8 0.2 7.8 Nov 58.8 0.1 1.1 6.1 Feb 59.3 0.1 0.6 5.0 H3 Jun 40.4 0.1 1.8 12.0 Aug 35.7 0.1 4.7 0.2 12.0 Nov 42.0 0.1 3.1 10.9 Feb 57.4 0.1 1.8 0.2 6.0 H4 Jun 35.4 0.1 1.9 1.2 16.3 Aug 37.3 0.1 2.5 0.6 18.7 Nov 39.6 0.1 1.7 0.7 23.3 Feb 36.4 0.3 1.5 0.7 19.4 H5 Jun 35.1 0.2 3.5 1.2 14.0 Aug 29.5 0.2 2.7 1.3 18.5 Nov 36.8 0.1 3.5 0.9 15.2 Feb 39.0 0.1 2.7 1.2 13.7
Table 2. Presence of candidate food sources in sediments as indicated by proportions of food source marker fatty acids (FA; %). C18-PUFA includes FAs 18:2ω6 and 18:3ω3; Σ C15, C17 includes FAs 15:0, 15:1 and 17:0. EPA: eicosapentaenoic acid; DHA: docosahexaenoic acid; PUFA:
Fig. 2. Top left: sediment fatty acid composition — non-metric multidimensional scaling (nMDS) of all stations (H1 to H5) and all months. Small panels: detail for each station (5 small nMDS panels). The dotted lines separate November−February
samples from June−August samples, but note 1 outlier November sample for Stn H3
Fig. 3. δ13C values of copepod communities as the weighted average of δ13C values of the copepod taxa (weighted by total taxon biomass) (mean ± SD, n = 3). Data are plotted with inclusion of all copepods (full circles) and after exclusion of
<1. Exceptions were Tachi dius discipes (DHA/EPA ra-tios frequently >1) and sporadically also M. littorale and A. intermedia.
DISCUSSION
Spatio-temporal variability in resource availability The greatest contrasts were found between the sandy station H2 and the muddy salt-marsh stations H4 and H5. Lack of other significant differences between stations was at least in part caused by sub-stantial small-scale patchiness of both resources and
their consumers. Stn H2 is subject to higher hydro -dynamic disturbance, which minimizes accumulation of silt and retention of 13C-depleted SPOM. Hence,
the δ13C signature of the surface sediment mainly
reflects autochthonous primary production by MPB. At most other stations, sediment OM δ13C closely
resembled that of SPOM. δ13C values of MPB partly
overlapped with decomposed Spartina anglica; its δ13C values and those of the other sources were all in
the range of published values from salt marshes and tidal flats (Currin et al. 1995, Riera et al. 1996, Dee-gan & Garritt 1997), and with earlier measurements from this part of the Schelde Estuary (Middelburg & Nieuwenhuize 1998, Moens et al. 2002). More than Fig. 4. Stable carbon isotope composition of harpacticoid taxa per station (mean ± SD averaged over 4 sampling dates)
other stations, H4 and H5 experience net sedimenta-tion. In such sediments, there is a positive feedback between MPB biofilms and silt deposition (Herman et al. 2001). Due to the low physical disturbance, and because the trapped silt lowers the availability of MPB to grazers due to the mixing of edible with ined-ible particles, stable MPB biofilms can develop. MPB is consistently dominated by diatoms, in line with the high proportions of diatom FAs in this study. Sandy sediments such as those at Stn H2 can also show episodic blooms of flagellates (Hamels et al. 1998) and chlorophytes (Moens un publ. data), but our phy-topigment data suggest little difference in the abun-dance of these groups among stations.
The comparatively high δ15N and high bacterial FA
levels of sediment particulate OM at Stns H4 and H5 suggest intense microbial nitrification−denitrification processes (Leh mann et al. 2002). S. anglica was the dominant vegetation in the immediate vicinity of Stns H3, H4 and H5, but our δ13C demonstrate that
its detritus input at these stations is limited.
Copepod species-specific resource utilization Considering the substantial habitat and temporal coverage in this study, the variation in natural stable carbon isotope composition of harpacticoid copepods was relatively small. With most copepod δ13C values
within the range of −18 to −12.5 ‰ and a high promi-nence of diatom-specific FAs, we conclude that the majority of copepod species rely to a significant extent on MPB. We have avoided the application of Bayesian mixing models to estimate the magnitudes of the dietary contributions of different food sources, mainly because of the large uncertainty (very large confidence intervals) on the estimated contributions, and because of potentially misleading conclusions when consumers have isotopic ratios which are inter-mediate between those of several candidate re -sources (Galván et al. 2011). In our study, a strong reliance on MPB rather than on Spartina detritus, which has partly overlapping δ13C, is supported by
complementary FA results. Their often high 16:1ω7 Fig. 5. Non-metric multidi-mensional scaling of cope-pods based on relative fatty acid profiles with (a) indica-tion of copepod origin (Stns H1 to H5 indicated by colors, sampling dates indicated by symbol) and (b) copepod taxa
and PUFA content and only trace C18-PUFA levels
are both consistent with a prominent role of diatoms and an absence of Spartina in the diets of a majority of harpacticoid species (Caramujo et al. 2008). The observed variability in δ13C among copepod species
could result from selective feeding on different microbenthic algal species, or from complementary feeding on other food sources. Harpacticoid species can select among diatoms by their size, age, or species (De Troch et al. 2006, 2012b, Wyckmans et al. 2007), and can consume a range of food sources including bacteria and flagellates (see ‘Introduc-tion’). Moreover, size-specific differences in stable isotope composition of intertidal diatoms have been demonstrated (Rzeznik-Orignac et al. 2008).
Our stable nitrogen isotope data showed a spread of 5.5 ‰ among different harpacticoid species, and a mean nitrogen isotopic fractionation of 6 ‰ between copepods and diatoms, which is twice or more the expected value for a single trophic step (Post 2002, McCutchan et al. 2003), particularly given the fact that trophic fractionation tends to be smaller at lower trophic levels (Vander Zanden & Rasmussen 2001, Galván et al. 2008). The offset in nitrogen isotopic ratios between copepods and MPB has to be inter-preted with due caution, because MPB isotopic data were not collected in the same sampling periods as the copepod data, and δ15N signatures of marine
sources can exhibit substantial spatio-temporal vari-ation (Riera et al. 1996, De Brabandere et al. 2002). Similarly, spatial variation may account for much of the spread among copepod species. Per location and time, the maximal spread between harpacticoid spe-cies was ca. 2 ‰, equivalent to the fractionation between 2 adjacent trophic levels (Galván et al. 2008). Hence, it is possible that some species obtain MPB carbon indirectly rather than by direct grazing on MPB. Therefore, in addition to spatio-temporal variation in producer nitrogen isotope ratios, the fol-lowing alternative scenarios may help to explain the spread in δ15N in harpacticoid copepods and the
dif-ference between copepod and MPB δ15N in our
study. First, some harpacticoid copepods may feed on bacteria (Rieper 1982), which in turn derive a consid-erable portion of their carbon from MPB (Middelburg et al. 2000). The low proportion of bacterium-specific FA, as well as low rates of bacterivory observed for
Microarthridion littorale, Platychelipus littoralis and Nannopus palustris from the same location (Cnudde
et al. 2013), invalidate this hypothesis for some harpacticoid taxa, but not for Delavalia palustris and
Paraleptastacus spinicauda. Interstitial copepods like Paraleptastacus sp. have reduced mouthparts poorly
adapted to diatom feeding; these harpacticoids have been considered browsers on sediment grains, scrap-ing off epipsammic bacteria (Feller 1980, Joint et al. 1982). D. palustris is a tube-dwelling species (Chan-dler & Fleeger 1984) and may feed on bacteria grow-ing on the mucus-covered inner walls of tubes. Sec-ond, some harpacticoid copepods may feed on heterotrophic ciliates and/or flagellates, which in turn consume primary production, bacteria associ-ated with primary producers, and/or their exopoly-mer secretions (Rieper 1985). DHA levels exceeding EPA levels, and the presence of only moderate 16:1ω7 proportions compared to other species, sug-gest that dinoflagellate feeding by M. littorale (H5 — November) and Tachidius discipes (H2 — June) is plausible (Volkman et al. 1980, Falk-Petersen et al. 2009). Third, some harpacticoids may be predators of other herbivores like nematodes or harpacticoid nau-plii (Lazzaretto & Salvato 1992, Kennedy 1994, Seifried & Dürbaum 2000). However, this is contra-dicted by the low PUFA/SFA ratios and a low relative abundance of 20:1ω9 in the copepods in our study. Fourth, harpacticoids may reutilize their own fecal pel -lets and associated microbes (e.g. De Troch et al. 2009). Although MPB was the predominant carbon source for harpacticoid assemblages, a substantial contribu-tion of SPOM was manifest in Paronychocamptus
nanus (particularly at Stn H5—February), Amphias-cus sp. 1 (Stn H5—November) and, to a lesser
degree, M. littorale (Stn H4—August). P. nanus and
Amphiascus were previously considered detritus and
diatom feeders, respectively (Hicks 1971, Heip 1979).
M. littorale was nearly omnipresent at the Paulina
intertidal area (exception being Stn H2). It can feed on benthic and planktonic microalgae (Decho 1986, Santos et al. 1995) and potentially on bacteria (De Troch et al. 2012a), although the latter is not sup-ported by our FA data.
Cletodidae had strongly depleted δ13C values
indicative of methane-derived carbon (Alperin & Hoehler 2009). One possibility is that the δ13C of
Cle-todidae in our study reflects feeding on methan-otrophs, even though this would typically yield even more depleted δ13C. Alternatively, sulphur-oxidizing
bacteria may utilize the 13C-depleted CO
2resulting
from methane oxidation (for instance by sulphate reducers), and may be grazed upon by cletodid cope-pods. Considering the ecological importance of sulfur cycling in salt-marsh sediments (Howarth 1984), this is a plausible explanation. In any case, our data strongly suggest that Cletodidae consume chemo-autotrophic bacteria, in line with a recent report on Cletodidae from seagrass-vegetated stations in the
Mira estuary, Portugal (Vafeiadou et al. 2014), and from unidentified harpacticoid copepods from estu-arine and coastal North Sea sediments (Franco et al. 2008, Moens et al. 2011). It is interesting to note that Cletodidae survive well in hypoxic conditions (Grego et al. 2014), an unusual feature for harpacticoids (Modig & Olafsson 1998). In addition, Van Gaever et al. (2006) found δ13C values of −51 ‰ for a
harpacti-coid species at a cold seep in the Barents Sea, demonstrating reliance on methanotrophic bacteria. These few published results on harpacticoid cope-pods are in accordance with similar records on par-ticular nematode species from the deep sea (e.g. Van Gaever et al. 2006, 2009, Pape et al. 2011) and coastal habitats (e.g. Bouillon et al. 2008, Vafeiadou et al. 2014), confirming that chemoautotrophic carbon may be an important energy source for several meiofau-nal taxa. Whether in Cletodidae this reflects a symbi-otic relationship or direct and selective grazing remains to be established. Unfortunately, we could only obtain a single FA profile of Cletodidae, yielding somewhat equivocal results: the lack of essential PUFAs such as EPA and DHA is in accordance with their independence of MPB. But at the same time, the abundances of bacterium-specific odd-chained FAs and of FAs specific for chemoautotrophic bacteria (Van Gaever et al. 2009) were comparable to those of other copepod species and lower than those in
D. palustris and P. spinicauda.
Spatio-temporal variability in copepod resource utilization
Based on our stable isotope data, the dependence of harpacticoids on diatom carbon was more pro-nounced at the sandy station H2 than at other, more accretory stations. However, the FA data of the most abundant sandy-sediment species, P. spinicauda, and also of T. discipes did not fully support this con-clusion: their low contributions of MPB-characteristic FAs and high DHA/EPA ratios pointed to at least a partial reliance on dinoflagellates (Kelly & Scheib-ling 2012).
For some species, δ13C variation in combination
with changes in relative FA composition illustrated shifts in diet. Spatial variation in δ13C values of
Asel-lopsis intermedia suggest a higher reliance on
benthic diatoms at bare tidal flat stations than at the salt-marsh station H5. For Amphiascus sp. 1, a lower abundance of diatom FAs at Stns H4 and H5 and a slightly elevated C18-PUFA level at H5 support the
idea of some contribution of SPOM or Spartina at the
muddy salt-marsh stations. Spatial variation in re -source use may also relate to species composition and inter actions such as competition for food, but study-ing the effect of species interactions on resource partitioning remains a challenge, especially since har -pacticoid assemblages exhibit pronounced dynamics even over a tidal cycle due to both passive and active redistribution (Armonies 1990, Sedlacek & Thistle 2006).
A temporal change in diet was observed for M.
lit-torale at Stn H5, where the δ13C difference between
November and February indicates a shift from con-sumption of flagellates (DHA > EPA), perhaps in combination with some assimilation of vascular plant detritus (C18-PUFA), to higher diatom grazing (EPA >
DHA, 16:1ω7, no C18-PUFA). Similarly, for P. nanus,
the strongly depleted δ13C was not consistent over
time and suggested a closer link with MPB in Febru-ary than in other months. DietFebru-ary shifts may be a con-sequence of variability in food availability, but also of seasonal variation in resource quality (Lee et al. 1976). Our biomarker data also indicated dietary shifts for several other harpacticoids, such as N.
palustris, P. littoralis and Robertsonia diademata.
However, their occurrences were too limited in space and time to allow firm conclusions on their tropho -dynamics.
In general, copepods showed a higher FA diversity in February, accompanied by the highest proportions and absolute concentrations of the PUFAs EPA and DHA. This may point at an early MPB bloom at the end of February, in accordance with the peak of rela-tive sediment OM PUFA content at this moment. At Stns H2 and H3, but not at the other stations, it is also consistent with peak chl a concentrations. For some copepods, essential FAs like EPA and DHA were not detected, while they should be present in living copepods. We suggest that PUFA levels below the detection limit may be the result of a temporal deple-tion in copepod PUFA reserves, e.g. after a reproduc-tion cycle (Falk-Petersen et al. 2009, Gonçalves et al. 2012) combined with a PUFA-poor diet.
Conclusions
MPB, composed mainly of diatoms, was of high dietary importance for the majority of intertidal harpacticoid taxa over the entire tidal flat−salt-marsh area. There was little evidence for a role of Spartina detritus as a resource for copepods. SPOM con-tributed significantly to the diets of only a limited number of species. Despite the general importance of
MPB as a carbon source for a majority of our copepod taxa, resource utilization patterns were diverse and species specific.
Acknowledgements. The first author acknowledges a PhD grant from the IWT (Institute for the Promotion of Innovation through Science and Technology in Flanders). M.D.T. is a postdoctoral researcher financed by the Special Research Fund at Ghent University (GOA Project 01GA1911W). Financial support was obtained from the Flemish Science Foundation through Project 3G019209W and from the research council of Ghent University through Project 0110600002.
LITERATURE CITED
Alperin MJ, Hoehler TM (2009) Anaerobic methane oxida-tion by archaea/sulfate-reducing bacteria aggregates. 2. Isotopic constraints. Am J Sci 309: 958−984
Anderson MJ, Robinson J (2003) Generalized discriminant analysis based on distances. Aust N Z J Stat 45: 301−318 Anderson M, Gorley R, Clarke K (2008) PERMANOVA+ for PRIMER: guide to software and statistical methods. PRIMER-E, Plymouth
Armonies W (1990) Short-term changes of meiofaunal abun-dance in intertidal sediments. Helgol Meersunters 44: 375−386
Azovsky AI, Chertoprud ES, Saburova MA, Polikarpov IG (2004) Spatio-temporal variability of micro- and meio-benthic communities in a White Sea intertidal sandflat. Estuar Coast Shelf Sci 60: 663−671
Bell JG, McEvoy LA, Estevez A, Shields RJ, Sargent JR (2003) Optimising lipid nutrition in first-feeding flatfish larvae. Aquaculture 227: 211−220
Bergamino L, Dalu T, Richoux NB (2014) Evidence of spatial and temporal changes in sources of organic matter in estuarine sediments: stable isotope and fatty acid analy-ses. Hydrobiologia 732: 133−145
Bouillon S, Connolly RM, Lee SY (2008) Organic matter exchange and cycling in mangrove ecosystems: recent insights from stable isotope studies. J Sea Res 59: 44−58 Buffan-Dubau E, Carman KR (2000) Diel feeding behavior of meiofauna and their relationships with microalgal resources. Limnol Oceanogr 45: 381−395
Caramujo MJ, Boschker HTS, Admiraal W (2008) Fatty acid profiles of algae mark the development and composition of harpacticoid copepods. Freshw Biol 53: 77−90
Carman KR, Fry B (2002) Small-sample methods for δ13C and δ15N analysis of the diets of marsh meiofaunal species using natural-abundance and tracer-addition isotope techniques. Mar Ecol Prog Ser 240: 85−92 Chandler GT, Fleeger JW (1984) Tube-building by a marine
meiobenthic harpacticoid copepod. Mar Biol 82: 15−19 Clarke K, Gorley R (2006) Primer v6: user manual/tutorial.
Primer-E, Plymouth
Cnudde C, Moens T, Willems A, De Troch M (2013) Sub-strate-dependent bacterivory by intertidal benthic cope-pods. Mar Biol 160: 327−341
Cripps GC, Atkinson A (2000) Fatty acid composition as an indicator of carnivory in Antarctic krill, Euphausia superba. Can J Fish Aquat Sci 57: 31−37
Currin CA, Newell SY, Paerl HW (1995) The role of standing
dead Spartina alterniflora and benthic microalgae in salt-marsh food webs: considerations based on multiple stable-isotope analysis. Mar Ecol Prog Ser 121: 99−116 Dahms HU, Harder T, Qian PY (2007) Selective attraction
and reproductive performance of a harpacticoid copepod in a response to biofilms. J Exp Mar Biol Ecol 341: 228−238
De Brabandere L, Dehairs F, Van Damme S, Brion N, Meire P, Daro N (2002) δ15N and δ13C dynamics of suspended organic matter in freshwater and brackish waters of the Scheldt estuary. J Sea Res 48: 1−15
De Troch M, Chepurnov V, Gheerardyn H, Vanreusel A, Olafsson E (2006) Is diatom size selection by harpacticoid copepods related to grazer body size? J Exp Mar Biol Ecol 332: 1−11
De Troch M, Cnudde C, Vyverman W, Vanreusel A (2009) Increased production of faecal pellets by the benthic harpacticoid Paramphiascella fulvofasciata: importance of the food source. Mar Biol 156: 469−477
De Troch M, Boeckx P, Cnudde C, Van Gansbeke D, Van-reusel A, Vincx M, Caramujo MJ (2012a) Bioconversion of fatty acids at the basis of marine food webs: insights from a compound-specific stable isotope analysis. Mar Ecol Prog Ser 465: 53−67
De Troch M, Vergaerde I, Cnudde C, Vanormelingen P, Vincx M (2012b) The taste of diatoms: the role of diatom growth phase characteristics and associated bacteria for grazing by the harpacticoid copepod Microarthridion lit-torale. Aquat Microb Ecol 67: 47−58
Decho AW (1986) Water cover influences on diatom inges-tion rates by meiobenthic copepods. Mar Ecol Prog Ser 33: 139−146
Deegan LA, Garritt RH (1997) Evidence for spatial variabil-ity in estuarine food webs. Mar Ecol Prog Ser 147: 31−47 Dunstan GA, Volkman JK, Barrett SM, Leroi JM, Jeffrey SW (1993) Essential polyunsaturated fatty acids from 14 spe-cies of diatom (Bacillariophyceae). Phytochemistry 35: 155−161
El-Sabaawi R, Dower JF, Kainz M, Mazumder A (2009) Characterizing dietary variability and trophic positions of coastal calanoid copepods: insight from stable isotopes and fatty acids. Mar Biol 156: 225−237
Falk-Petersen S, Mayzaud P, Kattner G, Sargent JR (2009) Lipids and life strategy of Arctic Calanus. Mar Biol Res 5: 18−39
Feller RJ (1980) Quantitative cohort analysis of a sand-dwelling meiobenthic harpacticoid copepod. Estuar Coast Mar Sci 11: 459−476
Franco MA, Soetaert K, Van Oevelen D, Van Gansbeke D, Costa MJ, Vincx M, Vanaverbeke J (2008) Density, verti-cal distribution and trophic responses of metazoan meio-benthos to phytoplankton deposition in contrasting sedi-ment types. Mar Ecol Prog Ser 358: 51−62
Galván K, Fleeger JW, Fry B (2008) Stable isotope addition reveals dietary importance of phytoplankton and micro-phytobenthos to saltmarsh infauna. Mar Ecol Prog Ser 359: 37−49
Galván K, Fleeger JW, Peterson B, Drake D, Deegan LA, Johnson DS (2011) Natural abundance stable isotopes and dual isotope tracer additions help to resolve resources supporting a saltmarsh food web. J Exp Mar Biol Ecol 410: 1−11
Gee JM (1989) An ecological and economic review of meio-fauna as food for fish. Zool J Linn Soc 96: 243−261 Ger KA, Panosso R, Luerling M (2011) Consequences of
➤
➤
➤
➤
➤
➤
➤
➤
➤
➤
➤
➤
➤
➤
➤
➤
➤
➤
➤
➤
➤
➤
➤
➤
➤
➤
➤
➤➤
acclimation to Microcystis on the selective feeding behavior of the calanoid copepod Eudiaptomus gracilis. Limnol Oceanogr 56: 2103−2114
Gonçalves AMM, Azeiteiro UM, Pardal MA, De Troch M (2012) Fatty acid profiling reveals seasonal and spatial shifts in zooplankton diet in a temperate estuary. Estuar Coast Shelf Sci 109: 70−80
Grego M, Riedel B, Stachowitsch M, De Troch M (2014) Meiofauna winners and losers of coastal hypoxia: case study harpacticoid copepods. Biogeosciences 11: 281−292 Guckert JB, Antworth CP, Nichols PD, White DC (1985) Phospholipid, ester-linked fatty-acid profiles as repro-ducible assays for changes in prokaryotic community structure of estuarine sediments. FEMS Microbiol Ecol 31: 147−158
Hamels I, Sabbe K, Muylaert K, Barranguet C, Lucas C, Her-man P, VyverHer-man W (1998) Organisation of microbenthic communities in intertidal estuarine flats, a case study from the Molenplaat (Westerschelde Estuary, The Netherlands). Eur J Protistol 34: 308−320
Heip C (1979) Density and diversity of meiobenthic cope-pods: the oscillatory behaviour of population and com-munity parameters. Pergamon Press, Oxford
Herman PMJ, Middelburg JJ, Heip CHR (2001) Benthic community structure and sediment processes on an intertidal flat: results from the ECOFLAT project. Cont Shelf Res 21: 2055−2071
Hicks GRF (1971) Checklist and ecological notes on the fauna associated with some littoral corallinacean algae. Bull Nat Sci 2: 47−58
Hicks GRF, Coull BC (1983) The ecology of marine meioben-thic harpacticoid copepods. Oceanogr Mar Biol Annu Rev 21: 67−175
Howarth RW (1984) The ecological significance of sulfur in the energy dynamics of salt marsh and coastal marine sediments. Biogeochemistry 1: 5−27
Joint LR, Gee JM, Warwick RM (1982) Determination of fine-scale vertical distribution of microbes and meio-fauna in an intertidal sediment. Mar Biol 72: 157−164 Kaneda T (1991) Iso-fatty and anteiso-fatty acids in bacteria:
biosynthesis, function and taxonomic significance. Microbiol Rev 55: 288−302
Kelly JR, Scheibling RE (2012) Fatty acids as dietary tracers in benthic food webs. Mar Ecol Prog Ser 446: 1−22 Kennedy AD (1994) Predation within meiofaunal
communi-ties: description and results of a rapid-freezing method of investigation. Mar Ecol Prog Ser 114: 71−79
Kharlamenko VI, Kiyashko SI, Imbs AB, Vyshkvartzev DI (2001) Identification of food sources of invertebrates from the seagrass Zostera marina community using carbon and sulfur stable isotope ratio and fatty acid analyses. Mar Ecol Prog Ser 220: 103−117
Lazzaretto I, Salvato B (1992) Cannibalistic behavior in the harpacticoid copepod Tigriopus fulvus. Mar Biol 113: 579−582
Leduc D, Probert PK, Duncan A (2009) A multi-method approach for identifying meiofaunal trophic connections. Mar Ecol Prog Ser 383: 95−111
Lee JJ, Tietjen JH, Garrison JR (1976) Seasonal switching in nutritional requirements of Nitocra typica, a harpacticoid copepod from salt-marsh aufwuchs communities. Trans Am Microsc Soc 95: 628−637
Lehmann MF, Bernasconi SM, Barbieri A, McKenzie JA (2002) Preservation of organic matter and alteration of its carbon and nitrogen isotope composition during
simu-lated and in situ early sedimentary diagenesis. Geochim Cosmochim Acta 66: 3573−3584
McCutchan JH, Lewis WM, Kendall C, McGrath CC (2003) Variation in trophic shift for stable isotope ratios of car-bon, nitrogen, and sulfur. Oikos 102: 378−390
Middelburg JJ, Nieuwenhuize J (1998) Carbon and nitrogen stable isotopes in suspended matter and sediments from the Schelde Estuary. Mar Chem 60: 217−225
Middelburg JJ, Barranguet C, Boschker HTS, Herman PMJ, Moens T, Heip CHR (2000) The fate of intertidal micro-phytobenthos carbon: an in situ13C-labeling study. Lim-nol Oceanogr 45: 1224−1234
Modig H, Olafsson E (1998) Responses of Baltic benthic invertebrates to hypoxic events. J Exp Mar Biol Ecol 229: 133−148
Moens T, Luyten C, Middelburg JJ, Herman PMJ, Vincx M (2002) Tracing organic matter sources of estuarine tidal flat nematodes with stable carbon isotopes. Mar Ecol Prog Ser 234: 127−137
Moens T, Bouillon S, Gallucci F (2005) Dual stable isotope abundances unravel trophic position of estuarine nema-todes. J Mar Biol Assoc UK 85: 1401−1407
Moens T, Moodley L, Steyaert M, Van Colen C and others (2011) The structure and functional roles of tidal flat meiobenthos. In: Heip C, Laane R (eds) Aspects of coastal research in contribution to LOICZ in the Nether-lands and Flanders (2002−2010), Book 38. Helmholtz-Zentrum Geesthacht, LOICZ International Project Office Geesthacht, Geesthacht
Montagna PA, Blanchard GF, Dinet A (1995) Effect of pro-duction and biomass of intertidal microphytobenthos on meiofaunal grazing rates. J Exp Mar Biol Ecol 185: 149−165
Nanton DA, Castell JD (1998) The effects of dietary fatty acids on the fatty acid composition of the harpacticoid copepod Tisbe sp. for use as a live food for marine fish larvae. Aquaculture 163: 251−261
Nieuwenhuize J, Erftemeijer PLA, Maas YEM, Verwaal M, Nienhuis PH (1994) Pretreatment artifacts associated with the removal of calcareous epiphytes from seagrass leaves. Aquat Bot 48: 355−361
Pace MC, Carman KR (1996) Interspecific differences among meiobenthic copepods in the use of microalgal food resources. Mar Ecol Prog Ser 143: 77−86
Pape E, Bezerra TN, Vanneste H, Heeschen K and others (2011) Community structure and feeding preference of nematodes associated with methane seepage at the Dar-win mud volcano (Gulf of Cadiz). Mar Ecol Prog Ser 438: 71−83
Post DM (2002) Using stable isotopes to estimate trophic position: models, methods, and assumptions. Ecology 83: 703–718
Rieper M (1982) Feeding preferences of marine harpacticoid copepods for various species of bacteria. Mar Ecol Prog Ser 7: 303−307
Rieper M (1985) Some lower food web organisms in the nutrition of marine harpacticoid copepods: an experi-mental study. Helgol Meersunters 39: 357−366
Riera P, Richard P, Gremare A, Blanchard G (1996) Food source of intertidal nematodes in the Bay of Marennes-Oleron (France), as determined by dual stable isotope analysis. Mar Ecol Prog Ser 142: 303−309
Rzeznik-Orignac J, Boucher G, Fichet D, Richard P (2008) Stable isotope analysis position of intertidal of food source and trophic nematodes and copepods. Mar Ecol
➤
➤
➤
➤
➤
➤
➤
➤
➤
➤
➤
➤
➤
➤
➤
➤
➤
➤
➤
➤
➤
➤
➤
➤
➤
➤
➤
➤
➤Prog Ser 359: 145−150
Santos PJP, Castel J, Souzasantos LP (1995) Microphytoben-thic patches and their influence meiofaunal distribution. Cah Biol Mar 36: 133−139
Scholz B, Liebezeit G (2013) Biochemical characterisation and fatty acid profiles of 25 benthic marine diatoms iso-lated from the Solthorn tidal flat (southern North Sea). J Appl Phycol 25: 453−465
Schückel S, Sell AF, Kihara TC, Koeppen A, Kroencke I, Reiss H (2013) Meiofauna as food source for small-sized demersal fish in the southern North Sea. Helgol Mar Res 67: 203−218
Sedlacek L, Thistle D (2006) Emergence on the continental shelf: differences among species and between microhab-itats. Mar Ecol Prog Ser 311: 29−36
Seifried S, Dürbaum J (2000) First clear case of carnivory in marine Copepoda Harpacticoida. J Nat Hist 34: 1595−1618 St. John MA, Clemmesen C, Lund T, Koster T (2001) Diatom production in the marine environment: implications for larval fish growth and condition. ICES J Mar Sci 58: 1106−1113
Vafeiadou AM, Materatski P, Adão H, De Troch M, Moens T (2014) Resource utilization and trophic position of nema-todes and harpacticoid copepods in and adjacent to Zostera noltii beds. Biogeosciences Discuss 11: 1277−1308 Van Gaever S, Moodley L, de Beer D, Vanreusel A (2006) Meiobenthos at the Arctic Hakon Mosby Mud Volcano,
with a parental-caring nematode thriving in sulphide-rich sediments. Mar Ecol Prog Ser 321: 143−155
Van Gaever S, Moodley L, Pasotti F, Houtekamer M, Mid-delburg JJ, Danovaro R, Vanreusel A (2009) Trophic spe-cialisation of metazoan meiofauna at the Håkon Mosby Mud Volcano: fatty acid biomarker isotope evidence. Mar Biol 156: 1289−1296
Vander Zanden MJ, Rasmussen JB (2001) Variation in δ15N and δ13C trophic fractionation: implications for aquatic food web studies. Limnol Oceanogr 46: 2061−2066 Viso AC, Marty JC (1993) Fatty acids from 28 marine
micro-algae. Phytochemistry 34: 1521−1533
Volkman JK, Johns RB, Gillan FT, Perry GJ, Bavor HJ (1980) Microbial lipids of an intertidal sediment. 1. Fatty acids and hydrocarbons. Geochim Cosmochim Acta 44: 1133−1143
Wang S, Chu T, Huang D, Li B, Wu J (2014) Incorporation of exotic Spartina alterniflora into diet of deposit-feeding snails in the Yangtze river estuary salt marsh: stable iso-tope and fatty acid analyses. Ecosystems 17: 567−577 Weiss GM, McManus GB, Harvey HR (1996) Development
and lipid composition of the harpacticoid copepod Nitocra spinipes reared on different diets. Mar Ecol Prog Ser 132: 57−61
Wyckmans M, Chepurnov VA, Vanreusel A, De Troch M (2007) Effects of food diversity on diatom selection by harpacticoid copepods. J Exp Mar Biol Ecol 345: 119−128
Editorial responsibility: Katherine Richardson, Copenhagen, Denmark
Submitted: February 5, 2014; Accepted: December 10, 2014 Proofs received from author(s): March 8, 2015