M//’
3V/’
Université de Montréal
L’étude du protéome et du phosphoprotéome durant la fécondation et le début de l’embryogenèse chezSotanum chacoenseBitt.
Par Kateryna Vyetrogon Département de Sciences biologiques
faculté des Arts et des Sciences
Mémoire présenté à la Faculté des études supérieures en vue de l’obtention du grade de
Maître ès sciences (M. Se.)
Avril, 2006
QK.
3
L)
LUniversité
11b
de Montréal
Direction des biblïothèques
AVIS
L’auteur a autorisé l’Université de Montréal à reproduire et diffuser, en totalité ou en partie, par quelque moyen que ce soit et sur quelque support que ce soit, et exclusivement à des fins non lucratives d’enseignement et de recherche, des copies de ce mémoire ou de cette thèse.
L’auteur et les coauteurs le cas échéant conservent la propriété du droit d’auteur et des droits moraux qui protègent ce document. Ni la thèse ou le mémoire, ni des extraits substantiels de ce document, ne doivent être imprimés ou autrement reproduits sans l’autorisation de l’auteur.
Afin de se conformer à la Loi canadienne sur la protection des renseignements personnels, quelques formulaires secondaires, coordonnées ou signatures intégrées au texte ont pu être enlevés de ce document. Bien que cela ait pu affecter la pagination, il n’y a aucun contenu manquant.
NOTICE
The authot of this thesis or dissertation has granted a nonexclusive license allowing Université de Montréal to reproduce and publish the document, in part or iii whole, and in any format, solely for noncommercial educational and research purposes.
The author and co-authors if applicable retain copyright ownership and moral rights in this document. Neither the whole thesis or dissertation, nor substantial extracts from it, may be printed or otherwise reproduced without the author’s permission.
In compliance with the Canadian Privacy Act some supporting forms, contact information or signatures may have been removed from the document. While this may affect the document page count. it does flot represent any loss of content from the document.
Université de Montréal faculté des études supérieures
Ce mémoire intitulé
L’étude du protéome et du phosphoprotéome durant la fécondation et le début de 1’ embryogenèse chez Solanum chacoei;se Bitt.
Présenté par Kateryna Vyetrogon
A été évalué par un jury composé des personnes suivantes:
Président-rapporteur: David Morse Membre du jury : Jean Rivoal Directeur de recherche : Daniel P. Matton
Résumé
La fécondation et le début de l’embryogenèse constituent des étapes importantes dans le développement des plantes. Pour identifier des gènes qui jouent un rôle durant cette étape cruciale j’entreprends ici une étude comparative du protéome des ovaires de Solanum chacoense à différents temps après la pollinisation. Dix-sept protéines différentes ont été identifiées et leur rôle possible lors de la fécondation et le début de l’embryogenèse est discuté ici. La seconde facette de mon projet porte sur la transduction de signaux lors de la fécondation. La phosphorylation protéique constitue un des types majeurs de modifications post-traductioimelles et est considérée comme un événement clé pour la transmission du signal chez les eucaryotes. Il est donc important d’identifier des phosphoprotéines impliquées dans la fécondation pour mieux comprendre la signalisation durant cet événement important. Pour pouvoir valider la nature phosphorylée des protéines identifiées nous comparons ici trois méthodes différentes de détection de phosphoprotéines. Les résultats de cette comparaison entre le marquage in vivo, l’immunodétection et la coloration avec un colorant spécifique aux phosphoprotéines sont présentés et discutés.
Les mots clés : fécondation, embryogenèse, pollinisation, phosphorylation, protéome, phosphoprotéome, phosphoprotéines.
Abstract
One of the most important developmental processes in plants is exemplified by the formation of the seed which starts from the double fertilization process. To identify genes that are important for this process we conducted a comparative proteome analysis for proteins expressed at different times afier pollination in the model plant $oÏanum chacoense. Seventeen different proteins were identified and their putative roles during fertilization are discussed. Another major aspect of my project is to better understand signal transduction events that occur during fertilization. Protein phosphorylation constitutes one of the most prominent types of post-translational modifications in the cell and is considered to be a key event for signal transduction in eukaryotes. To be able to understand the signaling processes during fertilization we must identify the phosphoproteins involved in this process. To validate the phosphorylation status of the proteins we identified in this study we compared different phosphoprotein detection methods: in vivo labeling, immunodetection, and staining with a specific fluorophore. The results of this comparison are discussed.
Key words : fertilization, pollination, embryogenesis, phosphorylation, proteome, phosphoproteome, phosphoproteins.
Table des matières
Résumé iii
Abstract iv
Table des matières y
Liste des tableaux vii
Liste des figures viii
Liste des sigles et des abréviations françaises x
List ofEnglish abbreviations xi
Introduction 1
1.1 La reproduction chez les plantes supérieures 2
1.1.1 Lastructuredelafleur 2
1.1.2 La formation des gamètes mâles 4
1.1.3 La formation des gamètes femelles 5
1.1.4 La fécondation 7
1.1.5 L’embryogenèse 9
1.2 La protéomique 9
1.2.1 La protéomique et la nouvelle biologie 9
1.2.2 Le protéome et le génome 11
1.2.3 La protéomique et les études de la formation de la graine chez les
plantes 11
1.2.4 La phosphorylation protéique 12
1.3 Leprojet 13
2 L’article 15
2.1 Introduction 17
2.2 Materials and Methods 19
2.2.1 Plant material and sampling procedure 19
2.2.2 In vivo labeling ofthe ovaries 19
2.2.3 Protein extraction 21
2.2.4 Second dimension electrophoresis 21
2.2.5 Gel staining 22
2.2.6 Western blotting and immunodetection 23
2.2.7 Image analysis 24
2.2.8 Protein identification by LC-M$/M$ 24
2.2.9 RNA extraction, probe preparation, cDNA anay hybridization and data
analysis 25
2.3 Resuits and Discussion 26
2.3.1 Comparison ofphosphoprotein detection methods 26
2.3.2 In vivo 32P labeling 27
2.3.3 Antibody detection 29
2.3.4 Phosphospecific protein dye 33
2.3.5 Comparison of the three phosphoprotein detection methods 35 2.3.6 Analysis ofproteins differentially expressed during fertilization 42
2.3.7 LC-MS/MS identification ofthe selected proteins 46
2.3.8 Proteome and transcriptome comparison 54
2.4 Concluding remarks 55
2.5 Acknowledgements 56
2.6 References 57
3 Discussion 60
3.1 La comparaison des différentes méthodes de détection des phosphoprotéines 60 3.2 Analyse de protéines exprimées de manière différentielle durant la
fécondation 63
3.3 Identification des protéines et des phosphoprotéines ayant démontrées une
variation dans leur abondance ou leur phosphorylation 64
4 Conclusion 70
5 References 71
Liste des tableaux
Table 1. Comparison of different phosphoprotein detection methods 39
Table 2. List of proteins that present a reproducible change in staining with Pro-Q
Liste des figures
Figures de l’introduction du memoire:
Figure 1: La structure de la fleur 3
Figure 2: Schéma illustrant la formation du gamétophyte femelle et mâle 6 Figure 3: Schéma illustrant la double fécondation chez les végétaux 8
Figures de l’article
Figure 1 : Schematic drawing of the method method used to radioactively label
ovary proteins with 32P in vivo 20
Figure 2: Comparison of the 2-DE patterns obtained from 32P-Iabelling and Sypro
Ruby (total protein) staining 28
Figure 3 : Comparison of the 2-DE patterns obtained with anti-phospho-Ser, anti
phospho-Thr, and anti-phospho-Tyr antibody detection 31
Figure 4: 2-DE patterns obtained with the Pro-Q Diamond phospho-specific stain
before and after alkaline phosphatase treatment 34
Figure 5 : Compilation map of the phosphoproteins detected with the three different
detection methods 37
Figure 6 : Venn diagram analysis of numbers of phosphoproteins detected with the
three different detection methods used and matched on the Sypro Ruby
Figure 7: Time-course analysis of protein expression during fertilization as
demonstrated by 2-DE 43
Figure 8: Time-course expression profiles of the proteins that were retained for
Liste des sigles et des abréviations françaises
% pourcentage °C degré Celcius microgramme rg nanogramme microlitre tM micromolaireADN acide désoxyribonucléique
ADNc ADN complémentaire
ARN acide ribonucléique
ATP Adenosine-Tri-Phosphate
électrophorèse 2D électrophorèse bidimensionnelle
EST Expressed sequence tag
GTP Guanosine-Tri-Phosphate
RAP heures après la pollinisation
LC-MS/MS chromatographie liquide suivie de
spectrométrie de masse en tandem
Ser serine
Thr threonine
List of English abbreviatïons
2-DE bi-dimensional electrophoresis
2-D electrophoresis bi-dimensional electrophoresis
Œ-NAC putative nascent polypeptide associated
complex alpha chain
Arm Armadillo
ATP Adenosine-Tri-Phosphate
capLC capillary liquid chromatography
CBB Coomassie Brilliant Blue
DTT dithiothreitol
DNA deoxyribonucleic acid
EST Expressed sequence tag
GTP Guanosine-Tri-Phosphate
h hour
RAP hours afier pollination
RPLC high performance/pressure Ïiquid
chromatography
HSP heat shock protein
TEF isoelectric focusing
IPG immobilized pH gradient
LC-MS/MS liquid chromatography followed by
tandem mass spectrometry
MAF 1 MfP1 attacbment factor 1
MFP1 Matrix attachnient region binding
Filament like Protein
PRJ( protein receptor kinases
Ran Ras-related nuclear small GTP-binding protein
RanBP 1 Ran binding prote in-1
RNA ribonucleic acid
mRNA ribonucleic acid messenger
ROS reactive oxygen species
Rpm revolution per minute
$DS sodium dodecyl sulfate
SDS-PAGE sodium dodecyl sulfate polyacrylamide
gel electrophoresis
5cr serine
TCA trichloroacetic acid
TfA trifluoroacetic acid
Thr threonine
Tyr tyrosine
U/jil units per microliter
V volt
V.h volt per hour
1. Introduction
Le cerveau humain est souvent attiré par les mystères de l’immensément grand et de l’immensément petit. Dans la biologie moléculaire, nous sommes dans l’univers de l’immensément petit. Ici on découvre tout un monde vivant et complexe à l’intérieur de chaque cellule, composé d’une multitude de molécules interagissant ensemble. Parmi ces molécules, il y a les acides nucléiques surtout reconnus comme responsables de la sauvegarde et de la transmission du code génétique, ainsi que les protéines codées par cette information et qui sont impliquées dans toutes les étapes du fonctionnement de la cellule. Les protéines sont une classe de molécules complexe et riche en mystères, dont on cherche à comprendre la structure, le fonctionnement, de même que l’immense réseau de leurs interactions. Essayer d’établir la relation entre l’immensément petit et le grand, entre les mondes des cellules et les différentes étapes de la vie d’un organisme qu’elles composent est particulièrement fascinant. La grande question toujours si passionnante «Comment toutes ces cellules qui vivent chacune pour elles composent en même temps des organismes capables d’autant de choses?! ». Les organismes auxquels je m’intéresse
dans cette étude sont les plantes, ces organismes qui ont permis l’évolution de la vie sur notre planète comme on la connaît aujourd’hui, qui nous permettent de respirer, manger et vivre. La question qui m’intéresse est de comprendre conirnent une étape cruciale de leur vie, la reproduction sexuée, est reflétée au niveau cellulaire. Plus particulièrement, mon intérêt se portera sur les événements de transduction de signaux impliquant la phosphorylation des protéines régulées par la fécondation chez les angiospermes. Ces plantes ont perfectionné une structure de reproduction spécialisée et unique, la fleur. La fleur est responsable de la production de gamètes mâles et femelles, et elle est aussi le siège de l’union des deux gamètes durant la fécondation et où la graine va se développer. Regardons ce processus plus en détail.
1.1 La reproduction chez les plantes supérieures
1.1.1 La structure de la fleur
On caractérise généralement comme une fleur la structure d’une tige raccourcie, avec quatre rangs ou verticilles de feuilles modifiées constituant les parties stériles et fertiles de la fleur. Les parties stériles du premier et second verticille sont les sépales et les pétales, respectivement (Figure 1). Les sépales, la plupart du temps vertes, protègent le reste de la fleur en l’entourant jusqu’à son ouverture. Les pétales, souvent colorées, ont pour fonction d’attirer les insectes et d’autres pollinisateurs comme les oiseaux.
À
l’intérieur de ces deux rangs sont situés les organes fertiles, responsables directement de la reproduction sexuée chez les angiospermes. Le premier rang fertile, le troisième verticille, est constitué des étamines qui représentent les unités mâles. Les étamines sont composées d’un filament qui porte à son extrémité distale quatre sporanges tenues ensemble dans une structure nommée anthère. Le deuxième rang fertile, le quatrième verticille, est celui au centre de la fleur, et il est constitué des carpelles (ou pistil composé de un ou plusieurs carpelles) représentant les unités femelles. Les parties principales des carpelles sont la partie basale élargie connue sous le nom d’ovaire et contenant les ovules; et à l’autre bout, la surface réceptive, connue sous le nom de stigmate. Ces deux parties sont souvent séparées par une partie robuste connue sous le nom de style. Ces quatre rangs de la fleur produits par le méristème floral sont déterminés de manière précise sous l’action de facteurs de trancription encodés par de multiples gènes homéotiques regroupés dans le modèle classique ABC (Bowman et al., 1991; Coen and Meyerowitz, 1991) et récemment modifié pour accommoder deux nouvelles classes de gènes homéotiques correspondants aux classes E et D (Pelaz et al., 2000; Theissen and $aedler, 2001; Ferrario et al., 2004).Pétale
Anhére
Fflament arpeHe
Figure 1: La structure de la fleur.
Cette image a été adaptée de http://www.partnersinair.org/fr/curricu1um_unit3_bkgd.htm1
1.1.2 La formation des gamètes mâles
La formation des gamètes males débute dans les boutons floraux très jeunes, où à l’intérieur des futures anthères une colonne de microsporocytes est formée. La division méiotique des ces microsporocytes diploïdes produit des microspores haploïdes (typiquement quatre par microsporocyte) qui se différencient en grains de pollen (Bedinger, 1992). Les microspores développent une paroi cellulaire complexe, absorbent des nutriments et se différencient. Le développement du pollen est supporté par le tapetum de l’anthère car son ablation interrompt la maturation du pollen (Mariani, 1990). Chaque cellule haploïde se divise asymétriquement en une grande cellule végétative et une plus petite cellule générative, les deux enfermées à l’intérieur de la paroi du grain de pollen ($outhworth, 2001). La cellule générative se divise, soit dans le grain de pollen, soit dans le tube pollinique pour donner naissance à deux gamètes mâles, les deux cellules spermatiques. Le grain de pollen mature enfermant les deux cellules spermatiques constitue le gamétophyte mâle. La figure 2 illustre la formation des gamètes mâles.
1.1.3 La formation des gamètes femelles
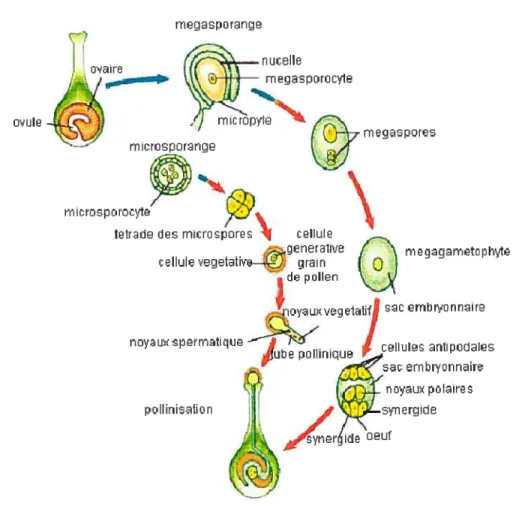
Pendant que le gamétophyte mâle se forme, un processus parallèle mène à la formation du gamétophyte femelle dans les ovules. Chaque ovule contient une masse de cellules non différenciées, appelée nucelle. La division d’une cellule du nucelle forme le mégasporocyte qui va ensuite entreprendre la méiose pour former quatre mégaspores haploïdes. Dans la majorité des espèces angiospermes (70%) trois des quatre mégaspores formées vont dégénérer. La mégaspore survivante croîtra pour donner le sac embryonnaire (Russel, 2001). Ce type de formation du sac embryonnaire est connu sous le nom de monosporique (Maheshwari, 1950; Davis, 1966). Dans le 30% restant des angiospermes, plusieurs mégaspores contribuent à la formation du mégagamétophyte (Davis, 1966). Le sac embryonnaire formé va ensuite subir des divisions mitotiques successives, suivies par la formation d’une paroi. Le sac embryonnaire mature contient six cellules haploïdes : l’oeuf, deux synergides, trois cellules antipodales. Il contient aussi deux noyaux libres qui vont fusionner pour donner un noyau polaire diploïde à l’intérieur de la partie restante du sac embryonnaire connue sous le nom de cellule centrale (Raghavan, 1997). Ce sac embryonnaire mature contenant sept cellules représente le gamétophyte femelle. La formation des gamètes femelles est illustrée par la figure 2.
OVule
Figure 2: Schéma illustrant la formation du gamétophyte femelle et mâle.
Les flèches bleues représentent les stades diploïdes; les flèches rouges représentent les stades haploïdes.
Cette image a été adaptée de
hftp://chsweb. lr.k I 2.nj .us/mstanley/outlines/plantae/angiosperms/angiosperms.htm
nc19rIoreriçe
ri u e eIle
mispcir’Jcte
tTiR’Qt
tetra’ie des rni’:ro spores
pc’IIiriiti e n
ijiosntipod&IIEis
000UX
rie
Iires1.1.4 La fécondation
La fécondation définit la phase de l’union de ces deux gamètes dont on vient de décrire la formation, donnant lieu à la formation d’un zygote. La fécondation de l’oeuf est précédée par le transfert des grains de pollen des anthères à la surface stigmatique et par la germination subséquente des grains de pollen. Pendant la germination, le grain de pollen développe un tube qui pousse à travers les tissus du style et de l’ovaire pour arriver à l’entrée des ovules, au niveau du micropyle, pour enfin atteindre le sac embryonnaire (Figure 3). Chez S. chacoense, comme pour plusieurs plantes sauvages, la réalisation de cette étape est seulement possible si le grain de pollen réussit à passer au travers des barrières d’incompatibilité, forts importantes pour promouvoir et sauvegarder la diversité génétique (De Nettancourt, 1997). Seul le grain de pollen avec un bagage génétique différent du gamétophyte femelle va réussir à atteindre le sac embryonnaire. A l’arrivée au sac embryonnaire le tube pollinique doit passer à travers les synergides pour arriver à la cellule oeuf. Il existe, dépendamment des espèces, deux manières par lesquelles le tube pollinique franchit les synergides. Dans la première, le tube pollinique perce les synergides de manière mécanique (van Went, 1984; Willernse, 1984; Russel, 1992; Higashiyarna et al., 2000), alors que dans la seconde, les synergides entreprennent un processus de mort cellulaire programmée juste avant l’arrivée du tube pollinique (Jensen, 1983; Huang, 1992; Christensen, 1997; Christensen, 2002). Cette deuxième manière implique l’existence des molécules de signalisation pour annoncer l’arrivée du tube pollinique. Pour le moment, seule l’existence de molécules de signalisation exprimées par les synergides et guidant le tube pollinique a été démontrée (Higashiyarna et al., 1998; Higashiyama et al., 2001; Higashiyama, 2002; Higashiyama et al.. 2003). Une fois le tube pollinique arrivé dans le sac embryonnaire, les cellules spermatiques sont déchargées du tube dans le sac. Une des cellules spermatiques fusionne avec la cellule oeuf pendant que la deuxième fusionne avec le noyau polaire de la cellule centrale. Ce processus, appelé double fécondation, produit le zygote diploïde et le noyau triploïde de l’albumen primaire (Nawaschin, 1898, 1900).
\J—
zv cite • ‘liploide -stigrn;te tube pollinique çjrain de flC’iau;< pi l;ires 2 rI’Jyd’JXsperrri;ti’:iues oiaire oule ‘:‘euf ri ovii trip ode de I lbuiiicriFigure 3: Schéma illustrant la double fécondation chez les végétaux
1.1.5 L’embryogenèse
La fusion des noyaux est suivie par une période de repos, ou plutôt de réorganisation qui peut être d’une durée variable (Wardlaw, 1955). Ensuite le noyau de l’albumen primaire et le zygote commencent leurs divisions, l’albumen un peu avant le zygote. Le zygote est la première cellule de la génération sporophytique. Elle entreprend une période d’activité mitotique élevée pour se développer en embryon. Le noyau de l’albumen primaire va se différencier en tissu nutritif connu sous le nom d’albumen. L’embryon entreprend des changements importants en formant des organes comme la racine, l’hypocotyle, les cotylédons et la tige. Au niveau cellulaire, l’embryon et l’albumen commencent à accumuler de grandes quantités de nutriments comme des hydrates de carbone ou glucides, des protéines de réserve et des lipides. L’ovule renfermant l’embryon et l’albumen se transforme en graine. L’ovaire autour de l’ovule se transforme enfruit protégeant la graine et aidant à sa dispersion.
1.2 La protéomique
1.2.1 La protéomique et la nouvelle biologie
La protéomique est l’étude du protéome qui est le complément de protéines encodées par le génome. Les termes «protéomique » et «protéome» ont été proposés par Wilkins et ses collègues au début des années 1990 pour les superposer aux termes «génomique» et «génome », qui décrivent la collection entière des gènes d’un
organisme (Wilkins, 1996). Cette terminologie «omique» symbolise la redéfinition de notre manière de penser la biologie, où l’on n’étudie plus les gènes et les protéines individuellement ou des petits groupes de composantes reliées des voies biochimiques spécifiques, mais plutôt des ensembles de systèmes. Chaque cellule a des milliers ou des dizaines de milliers de gènes qui peuvent être exprimés dans des combinaisons différentes. Chaque protéine a une fonction qui a de l’importance seulement dans le contexte de toutes les autres fonctions et activités exprimées dans la même cellule. C’est
pourquoi les biologistes d’aujourd’hui s’efforcent de penser large, pour comprendre les systèmes plutôt qu’uniquement les composantes et de démêler toute cette complexité.
L’ensemble de l’expression de gènes peut être suivi par la technique des biopuces
«microarray» d’ADN. Cette technique consiste à mettre des séries d’oligonucleotides spécifiques aux gènes ou des séquences des banques d’ADNc sur une lame de verre ou une petite puce. En y appliquant un mélange d’ARNm marqués de manière fluorescente on peut suivre l’expression de milliers de gènes en même temps. Malheureusement, il a été montré que les niveaux des ARNm ne prédisent pas nécessairement les niveaux des protéines correspondantes dans la cellule (Anderson and Seilhamer, 1997; Anderson and Anderson, 199$; Gygi et al., 1999; Ideker et al., 2001). Les différences de stabilité des ARNm et d’efficacité de leur traduction peuvent affecter la génération de nouvelles protéines. Une fois formées, les protéines n’ont pas toutes la même stabilité ou les mêmes taux de dégradation. Beaucoup de protéines impliquées dans la transmission de signaux, dans la régulation des facteurs de transcription et dans le contrôle du cycle de la cellule subissent rapidement un arrêt de fonction ou une dégradation pour réguler leur activité. De plus, les niveaux d’ARNm ne disent rien sur le statut de régulation des protéines correspondantes, l’activité et la fonction desquelles sont sujettes à des nombreuses modification post-traductionnelles endogènes ainsi que d’autres modifications par les agents environnementaux. D’où le besoin d’étudier l’ensemble des protéines elles-mêmes pour suivre leur expression.
La protéomique est l’étude des systèmes multiprotéiques dans laquelle l’emphase est mise sur l’interaction de plusieurs protéines différentes faisant partie d’un plus grand système. Le concept de protéomique est la biologie des systèmes plutôt que la biologie structurelle. En d’autres mots, le but de la protéomique est de caractériser le comportement du système plutôt que le comportement des composantes uniques de ce système (Liebler, 2002).
1.2.2 Le protéome et le génome
Chacune des cellules contient toute l’information nécessaire pour former un organisme complet. Cependant ce ne sont pas tous les gènes qui sont exprimés dans toutes les cellules. Les gènes qui codent pour des enzymes essentielles pour le fonctionnement de base de la cellule sont exprimés dans toutes les cellules alors que d’autres avec des fonctions très spécialisées sont exprimés seulement dans des types cellulaires spécifiques. Donc chaque organisme a un seul génome mais beaucoup de protéomes différents. Le protéome dans une cellule représente donc une sous-catégorie de tous les produits génétiques possibles. Cependant, cela ne veut pas dire que le protéome est plus simple que le génome. Dans la réalité, c’est l’opposé. N’importe quelle protéine, tout en étant le produit d’un seul gène, peut exister sous des formes multiples qui varient dépendamment du type cellulaire ainsi que des nombreuses modifications qu’elle peut subir. Ces modifications affectent la structure de la protéine, sa localisation, sa fonction, et sa durée de vie.
1.2.3 La protéomique et les études de la formation de la graine chez les plantes Comme nous venons de voir, la protéomique offre une opportunité intéressante d’examiner des changements simultanés en abondance des protéines pendant des processus développementaux complexes (Bove et al., 2002). Un des plus importants processus développemental chez les plantes est la formation de la graine qui, comme nous l’avons vu, commence avec la double fécondation pour mener à la formation d’un embryon double qui va donner naissance ensuite à la structure qu’on appelle la graine. Un certain nombre d’études protéomiques ont ciblé ce processus. Une importance particulière a été donnée à des plantes produisant des graines d’importance économique, étudiant le remplissage de la graine chez l’avoine, le soya, Medicago (Finnie et al., 2002); (Hajduch et al., 2005) (Gallardo et al., 2003), la formation de l’albumen chez le blé (Vensel et al., 2005), ou la germination chez l’avoine (Ostergaard et al., 2004). La germination des graines de la plante modèle Arabidopsis ihaliana a aussi été étudiée (Gallardo et al., 2002). Cependant, ces études ce sont concentrées sur des événements prenant place après la formation de l’embryon et, à notre connaissance, aucune étude protéomique n’a encore
été conduite sur les étapes prenant place au tout début de la formation de la graine, correspondant à la période juste avant la formation de l’embryon et de la graine, soit la fécondation. Une des grandes difficultés dans l’étude de la fécondation est qu’elle a lieu dans la cellule oeuf, l’oocyte, caché dans l’ovule, qui lui-même n’est qu’une partie minuscule de l’ovaire. A ce jour, il a été donc très difficile d’isoler et de travailler sur des protéines spécifiques de l’oocyte. Une étude a cependant réussi en utilisant des cellules isolées à caractériser des protéines abondantes dans des oocytes non-fécondés (Okamoto et al., 2004).
1.2.4 La phosphorylation protéique
Les modifications post-traductionnelles des protéines permettent une grande plasticité à la machinerie cellulaire nécessaire pour la régulation des fonctions cellulaires. Parmi les différents types de modifications, la phosphorylation protéique occupe une place prépondérante, mobilisant un grand nombre de gènes, surtout chez les plantes (Laugesen et al., 2004). Il est maintenant reconnu que la phosphorylation réversible est une composante essentielle de presque toutes les voies de signalisation dans une cellule vivante. Les changements de l’état de phosphorylation d’une protéine se font par deux activités enzymatiques distinctes: celle des protéines kinases qui catalysent l’attachement covalent d’un groupe phosphate à un acide aminée; et celle des protéines phosphatases qui renversent ce processus (Luan, 2000). Il a été estimé que le génome humain encode à peu près 500 protéines kinases et 100 protéines phosphatases, ce qui représente 2% de son génome, alors que celui d’ Arabidopsis encode 1100 protéines kinases et entre 100 et 200 protéines phosphatases, représentant 5% de son génome (Initiative, 2000; ZoÏnierowicz and Bollen, 2000; Venter et al., 2001; Kerk et al., 2002). La phosphorylation protéique chez les plantes régule non seulement les voies universelles mais aussi des processus uniques comme la photosynthèse et la photomorphogénèse (Allen, 1992). La caractérisation des kinases impliquées dans la reconnaissance pollenlstigmate (Walker and Zhang, 1990; Walker, 1993), dans le développement floral (Roe et al., 1993), ainsi que la caractérisation récente d’un groupe de kinases impliquées
dans la fécondation et l’embryogenèse (Germain et al., 2005) démontre le rôle crucial que la phosphorylation joue dans la reproduction sexuée des plantes.
1.3 Le projet
Le projet de recherche que j’ai réalisé durant ma maîtrise portait sur l’identification de protéines importantes lors de la fécondation et au début de l’embryogenèse chez les plantes supérieures, ainsi que sur la signalisation cellulaire qui a lieu durant cette période. Pour la réalisation de ce projet j’ai utilisé la méthode de l’électrophorèse bidimensionnelle qui est une technique basée sur le principe de la séparation de protéines totales selon leur point isoélectrique et leur poids, permettant d’étudier directement les profils d’expressions de plusieurs centaines de protéines simultanément.
La première étape de mon projet portait sur l’étude comparative de trois méthodes différentes de détection des phosphoprotéines : le marquage in vivo, l’immunodétection et la coloration avec un colorant fluorescent spécifique aux phosphoprotéines, le ProQ Diamond Stain.
Pour la deuxième étape j’ai utilisé ces techniques pour comparer les protéomes et les phosphoprotéomes des ovaires à des stades différents lors de la fécondation et le début de l’embryogenèse. Le séquençage par LC-MS-MS m’a permis d’identifier des protéines intéressantes et d’élaborer sur leurs possibles rôles durant cette période importante du développement végétal. Comme modèle d’étude
j
‘ai choisi la plante Solanum chacoense, un excellent système pour l’étude de la fécondation et de l’embryogenèse grâce à son système d’auto-incompatibilité permettant de contrôler précisément le temps de la fécondation. De plus, cette plante possède de nombreuses fleurs d’assez grandes tailles permettant une collecte facile des ovaires. Sa parenté étroite avec d’autres solanacées d’importance économique comme la tomate (Solanum lycopersicum) et la pomme de terre (SoÏanum tuberosum) a aussi permis l’utilisation de banques de données d’EST (Expressed sequence tag) considérables pour la détermination de l’identité des protéines séquencées.Ce projet a mené à la rédaction d’un article scientifique dont je suis le premier auteur. Le projet a été réalisé sous la direction du Professeur Daniel P. Matton. L’article sera soumis au journal Proteomics.
2
L’article
A comparative proteome and phosphoproteome analysis of differentially regulated proteins during fertilization in the self-incompatible species Solanum chacoense Bitt.
Kateryna Vyetrogon and Daniel P. Matton*.
Institut de Recherche en Biologie Végétale (IRBV). Département de sciences
biologiques, Université de Montréal, 4101 $herbrooke Est, Montréal, QC, Canada, H1X 2B2.
*Author for conespondence: Tel: 1-514-$72-3967 Fax: 1-514-$72-9406
Abstract
We have used two-dimensional gel electrophoresis for a time-course study of the changes in proteins and phosphoproteins that occur imrnediately afier fertilization in $oÏanum chacoense Bitt. The phosphorylation status of ah the detected proteins was determined with three different methods: in vivo labeling, immunodetection, and phosphoprotein specific staining. Using a pi range from 4 to 7, 262 phosphorylated proteins could be mapped to the 619 proteins detected by Sypro Ruby staining, representing 42% of the total proteins. Among these 262 phosphoproteins, antibodies detected 184 proteins from which 7$ were also detected with either of other two methods (42%). Pro-Q Diamond phosphoprotein stain detected 111 proteins from which 76 were also detected with either of the other two methods (68%). The 32P in vivo labeling method detected 90 spots from which 78 were also detected with either of other two methods (87%). When comparing before and afier fertilization profiles. 38 proteins and phosphoproteins presented a reproducible change in their accumulation profiles. 0f these, 24 spots were selected and analyzed by LC-ESI-Q/TOF-M$/MS. Peptide data were searched against pubhicly available protein and EST databases. The putative roles of some of the identified proteins in early fertilization events are discussed.
Keywords:
Fertilization / Embryogenesis / SoÏanum chacoense / Proteome / Phoshoproteome / Two-dimensional gel electrophoresis / Protein identification / Mass spectrometry.2.1 Introduction
Over the last decade numerous DNA sequencing projects have harvested a large amount of genomic and expressed sequence data. Although several high-throughput RNA expression measurement tools have been developed, with microanay analysis being at the forefront of global gene expression, these powerful techniques only look at the transcriptional regulation of a set of genes. One of the biggest hurdle in relating modulations observed at the gene expression level and their actual effects at the protein level is the fact that mRNA levels are not aiways a consistent indication of a protein’s abundance, and several studies have already revealed poor correlations between changes in the abundance of specific mRNAs and their corresponding proteins [1-4J. This is probably due in part to large differences in mRNA and protein stability and turnover. In addition, many proteins undergo extensive post-translational modifications that can significantly affect their activity and subcellular localization. Therefore, only the study of the proteins themselves provides information on their real amount and/or activity at a given time in a given tissue, or in response to a given stimulus or treatment [5]. Proteomic analyses also offer the opportunity to examine simultaneous changes in protein accumulation occurring in complex developmental processes, and to determine informative temporal expression patterns [6]. One of the most important developmental processes in plants is exemplified by the formation of the seed. Seed formation starts from the double fertilization process that takes place in the embryo sac of the ovule where the two male gametes delivered by the pollen tube fertilize the two female gametes, the haploid egg cell and the diploid central cell. This event then leads to the development of the diploid embryo from the egg celi, that will eventually give rise to the new sporophytic generation, and of the triploid endosperm from the central celi, an ephemeral tissue primarily involved in the nutrition of the developing embryo [7].
Although a number of proteomic studies have targeted later events during seed development, including germination [8-14], to our knowledge no proteomic or phosphoproteomic studies have yet focused on the very early stages of seed development corresponding to the period directly preceding embryo and eventually seed formation, namely the fertilization event itself One major hurdie comes from the fact that the egg
and the central celi are encased in the embryo sac, a small part only of the entire ovule, that itself is only a small part of the whole ovary. One promising approach involves the use of isolated celis, but low sensitivity due to the difficulty of harvesting the celis combined with invasive isolation methods makes this approach tedious and time consuming, although it has been successfully used to isolate abundant proteins from the egg celi prior to fertilization [1 5].
Protein phosphorylation constitutes one of the most prominent type of post transiational modification in the celi and it mobilizes a large number of genes, especially in plants, where it largely participates to the complexity of the proteome [16]. It is estimated that in humans one third of all proteins are simultaneously phosphorylated at any given time, mobilizing two percent of the genes (approximateÏy 500 protein kinases and 100 protein phosphatases) [17, 1$]. In plants, these proportions are even higher. In Arabidopsis there are approximately 1100 protein kinases and between 100 and 200 protein phosphatases, which constitutes 5% of its genome [19, 20]. Classically, detection of phosphoproteins within a protein mixture relied on the combination of electrophoretic procedures to isolate proteins and either autoradiography (in the case of prior ceil labeling with 32P) or immunodetection using antibodies raised against phosphorylated residues [16]. Recently, an alternative approach of direct staining of gels with a phosphoprotein specific fluorophore (Pro-Q Diamond dye) was proposed [21-23].
We have recently shown through an EST sequencing pro] ect from fertilized ovules and from the fine expression analysis of the isolated plant protein receptor kinases (PRK), that most of the PRKs were modulated at the transcriptional level following pollination or fertilization [24]. In the present study, and using a similar approach, the ovary proteome and phosphoproteome during ovule fertilization will be investigated in the self-incompatible species Solanum chacoense, a close relative of the potato and tomato. Three phosphoprotein detection methods to identify phosphoproteins differentially regulated during fertilization have been compared and the biological relevance ofthe isolated proteins wiÏÏ be discussed.
2.2 Materials and Methods
2.2.1 Plant material and sampling procedure
Ail plant material was collected from S. chacoense Bitt. genotype G4 (self incompatibility alleles S12$ 14). For fertilization-related events, 8. chacoense genotype
V22 (self-incompatibility alleles S11$13) was used as the pollen donor. These genotypes were obtained from crosses between une PI 458314 (self-incompatibility alleles Si 1S12)
and line PI 230582 (self-incompatibility alleles $13514) originally obtained from the
Potato Introduction Station (Sturgeon Bay, WI). In order to collect ail plant material on the same day for processing and analyses, flowers were pollinated on two consecutive days: the 42 h and 48 h after pollination samples on the first day, and the 30 h and 36 h after pollination samples on the second day. For each sample 30 flowers were pollinated and these experiments were done in triplicate (biological triplicates) to avoid differences due to growth conditions. Flowers were hand-dissected immediately afier collection and the ovaries were kept at -80°C until protein extraction.
2.2.2 In vivo labeling of the ovaries
For in vivo labeling, flowers were hand poiiinated in the greenhouse and six hours before ovary collection time, inflorescence stems bearing approximately s-10 flowers were placed in a microtube containing 0.4 mCi of a 32P-orthophosphate solution diluted in 40 pi of water (H3P04, Perkin Elmer, Boston, MA) for 20 min until total absorption (see Figure 1). Immediately following the absorption, the inflorescence stems were placed in sterile water for 6 h. Absorption of 32P-orthophosphate by different tissues was monitored by scintillation counting over time and afier 6 h, when the 32P labeling had reached the flowers, flowers were then collected dissected. Ovaries were isolated and frozen at -80°C until analysis.
32p labeling
20 min
}
Figure 1: Schematic drawing of the method method used to radioactively label ovary proteins with 32P in vivo. After manual pollination, inflorescence stems bearing 8-10 flowers were cut and placed in a microtube containing 32P orthophosphate until total absorption. Immediately following absorption, the inflorescence stems were placed in sterile water for 6 h. Absorption of 32P-orthophosphate was monitored by scintillation counting over time and 6 h was determined as optimal to get sufficient 32P labeling in the ovary. f lowers were then collected and dissected. Ovaries were isolated and prepared for 2-D gel analyses.
24 ta 42 h in
the greenhouse
before transfer
Flower pollination
2-DE
in the greenhouse
analysis
Transfer in water
for6h
2.2.3 Protein extraction
Fresh or frozen ovaries were ground in a mortar in the presence of liquid nitrogen. One hundred mg corresponding to 60 ovaries were resuspended in 1 mL of ice-cold 10% TCA/acetone, 0.07% f3-mercapthoethanol and allowed to precipitate overnight at -20°C. Following precipitation, the samples were centrifuged at 13000 g in a microtube centrifuge at 4°C and the precipitate was washed twice with 1 mL of cold 80% acetone and 0.07% -mercapthoethanoi. The samples were then dried by vacuum centrifugation for 1-2 min and resuspended in 300 iL of IEF sample buffer (8 M Urea, 50 mM dithiothreitol (DTT), 4% (w/v) CHAPS, 0.2% (v/v) Carrier ampholytes pH 3-10, 0.0002% (w/v) Bromophenol Blue) for 1 hour with vigorous vortexing. Insoluble material was removed by centrifugation at 13000 g in a table centrifuge for 30 min.
The protein content of the supematant was quantified using the Bio-Rad assay (Hercules, CA) based upon a modified procedure of Bradford [25] using bovine serum albumin (B SA) as a standard. Sixty micrograms of extracted proteins were used for gels stained with Pro-Q Diamond, whiie 100 jig of proteins were used for in vivo 32P orthophosphate labeling and 250 jig of proteins were used for antibody detection or Coomassie staining.
2.2.4 Second dimension electrophoresis
Proteins were resuspended in 125 tl of sample and IEF buffer with 1 nM of calyculin A phosphatase inhibitor (Calbiochem, La Joua ,CA, USA) and used to rehydrate IPG strips (Bio-Rad, Hercules, CA, USA). for the dephosphorylation assay, calyculin A was omitted and 10 ti (1 U/pJ) of aikaline phosphatase (Roche Diagnostics, Laval, QC, Canada) were added to the sample one hour prior to rehydration. Rehydration was performed overnight at room temperature with strips covered with minerai ou. Following rehydration, the strips were biotted against absorbing paper to remove excess liquid and minerai ou, piaced in the IEF tray containing the wet wicks on the electrodes, covered with new minerai oil, and focused in the Protean® IEF focusing chamber (Bio Rad). The protocoi used for focusing inciuded three steps: 1)15 min at 250 V with rapid
reached.
f ollowing IEF, IPG strips were frozen at -20°C until the next day. Afier thawing (10 mm), the IPG strips were removed from the focusing tray, blotted to remove excess ou and incubated for 10 min in SDS equilibration buffer (6 M Urea, 2% (w/v) SDS, 0.05 M Tris/HC1 pH $.$, 20% (v/v) Glycero!) with 2% (w/v) DTT, followed with another 10 min incubation in SDS equilibration buffer containing 2.5% (w/v) iodoacetamide. The IPG strips were then rinsed with SDS rulming buffer (25 mM Tris base, 192 mM Glycine, 0.1% (w/v) SD$) and placed on 10% acrylamide gels. Strips were overlaid with 0.5% (w/v) agarose in SD$ ruiming buffer with a trace of Bromophenol Blue. Second-dimension $D$-PAGE was performed in the Mini-PROTEAN® Dodeca ce!! (Bio-Rad) at 200V for 45 min and at 4°C or until the Bromophenol blue dye started migrating off the gel. Following migration the gels were either subjected to western blotting or stained with a specific protein stain.
2.2.5 Gel stainïng
For Pro-Q Diamond Phosphoprotein staining, the gels were fixed ovemight in the Pro-Q Diamond Fix solution (50% (v/v) methanol, 10% (v/v) acetic acid) at room temperature with gentie agitation. On the next day, the gels were incubated in fresh Pro-Q Diamond Fix solution for 30 min. The gels were then washed three times 10 min with water and stained with the Pro-Q Diamond Phosphoprotein stain for 47 min. Longer staining periods increased the total number of proteins detected but significantly decreased the specificity of the phosphoprotein dye. The gels were then immediately destained in the destaining solution (20% (v/v) 1 ,2-propanediol, 50 mM sodium acetate, pH 4.0) for 1 h followed by a second destain step for 1 h. The gels were then rinsed with water and scanned with a Typhoon 9200 phosphorimager (GE Healthcare, Baie d’Urfé, QC, Canada) using 532 nm excitation and the 610 BP 30 emission filter. Following the
scan, the gels were then stained with Sypro Ruby (Molecular Probes, Eugene, OR, USA) overnight at room temperature with gentle agitation. The gels were then washed with
10% (v/v) methanol, 7% (vlv) acetic acid for 30 min at room temperature with gentie agitation. The gels were finally rinsed with ultrapure distilled water and scanned using 582 nm excitation and the 610 BP 30 emission filter.
Gels that contained 32P labeled proteins were stained with $ypro Ruby only, dried for 3 h in a GelAir Dryer (Bio-Rad), and scanned using 582 nm excitation and the 610 BP 30 emission filter with a Typhoon 9200 phosphorirnager for total protein pattem. The dried gels were then exposed with one intensifying screen on Kodak Biomax MR film (Interscience, Markham, ON, Canada) for 2 weeks at room temperature.
For Coomassie Brilliant Blue (CBB) staining, the gels were stained ovemight with 0.25% (w/v) CBB G-250, 10% (vlv) methanol, 10% (v/v) acetic acid and then washed several times for 30 min with 10% (v/v) methanol, 10% (v/v) acetic acid until complete background destaining.
2.2.6 Western blotting ami immunodetection
Afler two-dimensional electrophoresis, the proteins were transferred electrophoretically onto PVDF membranes in 25 mM Tris base, 192 mM glycine and 20% (v/v) methanol. Afier transfer, the membranes were stained with Ponceau Red and then scaimed with a digital scanner (AGFA Duoscan T1200, Toronto, ON, Canada). The membranes were then washed with 25 ml TBS (20 mM Tris-HC1, 150 mM NaC1, pH 7.6) and blocked for 1 h with 25 ml ofblocking buffer (TBS with 0.1% (v/v) Tween-20 and 5% (w/v) BSA) at room temperature with gentle agitation. Following blocking, the membranes were washed tbree times for 5 min each with 15 ml of TBS wash buffer (TBS with 0.1% (v/v) Tween-20) and then incubated with the primary antibody (a mix of monoclonal antibodies from either the Phosphoserine, Phosphothreonine, or Phosphotyrosine Detection Kits (Calbiochem, La Jolla, CA, USA) diluted in blocking buffer at a concentration of 1 jig/mL overnight at 4°C with gentie agitation. Following the incubation, the membranes were washed three times for 5 min each with 15 ml of TBS wash buffer and then incubated with the secondary antibody (fluorescein conjugated goat anti-mouse total IgG, Calbiochem, La Joua, CA, USA) diluted in blocking buffer at a
concentration of 1 jig/mL for 1 h at room temperature with gentie agitation. f ollowing the incubation, the membranes were washed again three times for 5 min each with 15 ml of TBS wash buffer and then scanned using Typhoon 9200 phosphorimager using 532 nm excitation and the 526 SP emission filter.
2.2.7 Image analysis
Image analysis of the gels stained with Pro-Q Diamond and Sypro Ruby was canied out with the Image Master 2D Elite software (GE Healthcare, Baie d’Urfé, QC, Canada). Spots were detected with a peak dilation method. The parameters used were: background intensity 13, step size 14, smoothing size 12, minimum width-to-height ration 0.2 and maximum width-to-height ration 10. Other parameters managed by the software were used at their default settings. Some manual corrections were performed in order to ensure the same spots were detected between different gels. for background subtraction, the non-spot method was used. for normalization, the total volume multiplied by total area method was used.
Image analysis of membranes subjected to immunoblotting and gels after autoradiography was carried using Adobe Photoshop version 7.0. Different colors were applied to the total protein staining and to the phosphoprotein staining using Selective Color bol, and different images of the same gel were then superposed using the Opacity Tool.
2.2.8 Protein identification by LC-MSIMS
Spots that were chosen for sequencing were manually excised with a 1 mL pipet tip either from 7 Sypro Ruby stained gels or from 3 Coomassie stained gels and placed in a 96-well microtiter plate (Sigma, Milwaukee, WI, USA). The proteins were then automatically de-stained, reduced with DTT, alkylated with iodoacetamide, and digested with porcine trypsin (sequencing grade, Promega, Madison, WT, USA) using a MassPREP protein digest station (Micromass, Manchester, UK). The digest was evaporated to dryness, then dissolved in 12 jil of 0.1% aqueous TFA, ofwhich 6 tL were
analyzed by LC-MS/MS using a capLC temary HPLC system (Waters, Milford, MA, USA) interfaced to a Q-Tof Ultima Global hybrid tandem mass spectrometer fitted with a Z-spray nanoelectrospray ion source (Micromass, Manchester, UK). Solvents B and C comprised 0.2% formic acid in water, while solvent A consisted of 0.2% formic acid in acetonitrile. The peptide digest sample was loaded onto a C18 trapping column (Symmetry 300, 0.35 x 5 mm Opti-pak; Waters) and washed for 3 min using solvent C at a flow rate of 30 tL/min. The flow path was then switched using a 10-port rotary valve, and the sample eluted onto a C18 analytical column (PepMap, 75 im x 15 cm, 3-im particle size; LC Packings). Separations were performed using a linear gradient of 0:100 to 60:40 % A:B over 43 min. The composition was then changed to 80:20 % A:B and held for 10 min to flush the column before re-equilibrating for 7 min at 0:100 % A:B. Mass calibration of the Q-Tof instrument was performed using a product ion spectrum of Glu-fibrinopeptide B acquired over the rn/z range 50 to 1900. LC-MS/MS analysis was canied out using data dependent acquisition, during which peptide precursor ions were detected by scanning from m/z 400 to 1900 in TOF MS mode. Multiply charged (2+, 3+, or 4+) ions rising above predetermined threshold intensity were automatically selected for TOF MS/MS analysis, and production spectra acquired over the m/zrange 50 to 900. LC-MS/MS data were processed using ProteinLynx v2. 15 software (Micromass) and searched against the NCBI non-redundant (nr) and EST-others database using MASCOT
(Matrix Science Inc., Boston, MA). Searches were performed using
carbamidomethylation of cysteine as the fixed modification and oxidation of methionine as the variable modification, allowing for one missed cleavage during trypsin digestion.
2.2.9 RNA extraction, probe preparation, cDNA array hybridization and data analysis
DNA microarrays were printed on U1traGAPSTM Slides (Coming) ftom 7741 expressed sequence tags (ESTs) corresponding to 6374 unigenes derived from a fertilized ovary cDNA librairies covering embryo development from zygote to late torpedo stages in Solanum chacoense [24]. This microarray was used to analyze gene expression profiles in
ovaries O and 4$ HAP. Total RNA was extracted ftom unfertilized ovules (0 RAP) and from ovules 4$ RAP using TRIzol ® Reagent (Invitrogen) according to the manufacturer’s instructions. RNA yield and purity were assessed by absorbance determination at both 260 nm and 2$0 nm. RNA was only used when the ratio Abs260 nm/Abs280 nm was higher than 1.7. RNA integrity was determined with the RNA 6000 Nano Assay Kit and the Agilent 2100 Bioanalyzer. Thirty (30) tg of total RNA from 4$ RAP ovaries were hybridized to microarrays along with the same amount of control RNA (0 RAP ovaries) for 16h at 42°C. The experiment was done with four biological replicates that included two dye swaps. Labeling was performed with a cyanine 3-dCTP or cyanine 5-dCTP (1 mM; NEN Life Science, Boston MA, cat.. no. NEL576 and 577). Rybridization and washing were performed as described in the CyScribe Post labeling Kit (Amersham Biosciences) in the CMTTM hybridization chamber (Corning). The DNA microarray slides were scanned with a ScanArray Lite scanner (Perkin Elmer-Cetus, WelÏesley, CA; version 2.0) at 10-im resolution. The resulting 16-bit TIFF files were quantified with QuantAnay software (Perkin Elmer-Cetus; versions 2.0 and 3.0). Normalization was performed with Lowess (Locally weighted scatter plot smoothing). Statistical analysis and visualization were performed with GeneSpring software (Silicon Genetics, Redwood City, CA) using the available statistical tools (Student’s t test of replicate samples showing a variation different from 1).
2.3 Resuits and Discussion
2.3.1 Comparison of phosphoprotein detection methods
The present study aimed at the identification of proteins and phosphoproteins differentially regulated during fertilization in plants. For this purpose, we have chosen a wild-relative of the potato, $olanum chacoense, that is an obligate outcrosser due to the presence of a genetically determined reproductive barrier active in the style. The presence of this reproductive barrier, termed gametophytic self-incompatibility, involves rejection of pollen when both pistil and pollen share the same allele at the S locus, thus preventing the pollen tube to reach the ovules and to effect fertilization [26]. This self-recognition
and rejection system assures that only genetically different pollen can fertilize the flower, thus making seffing impossible. This, combined with manual pollinations, enables the synchronization of pollination, and thus, of fertilization over a limited time window.
Since the characterization of phosphoproteins still remains a difficuit task [16] and no perfect method for their detection exists, three different detection methods were used and compared in order to ascertain the validity of the phosphoproteins detected. These included: 1) autoradiography afier in vivo labeling with 32P orthophosphate; 2) immunodetection using antibodies raised against phosphorylated residues; 3) direct gel staining with a fluorophore specffic for phosphoproteins. Since fertilization takes place from 36 h afier pollination (RAP) in £ chacoense, and since pollination is known to induce some changes at a distance in the ovary before pollen tubes reach the ovaries [24, 27], 30 HAP ovaries were taken as controls and compared to 36, 42, and 48 h post pollination ovaries, where fertilization had taken place.
2.3.2 In vivo 32P labeling
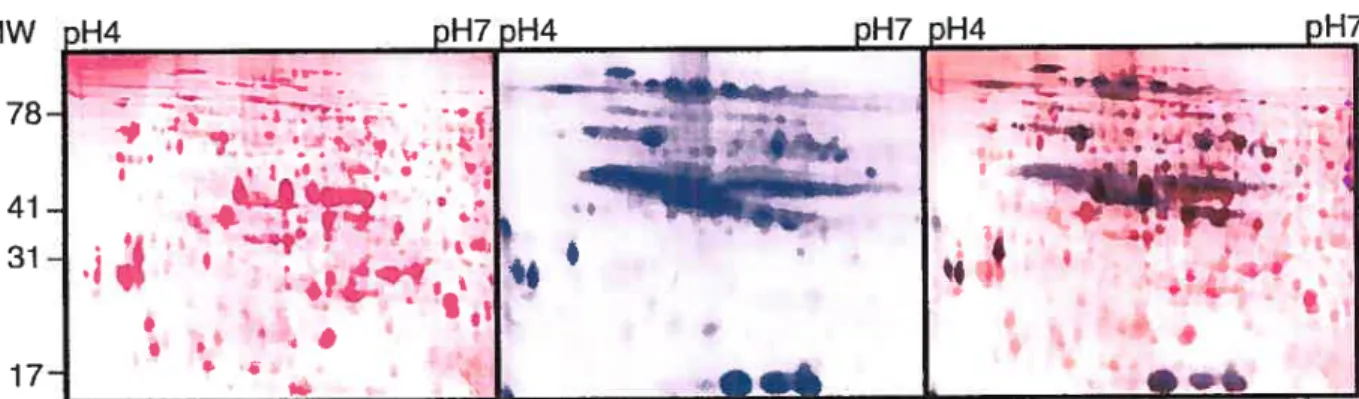
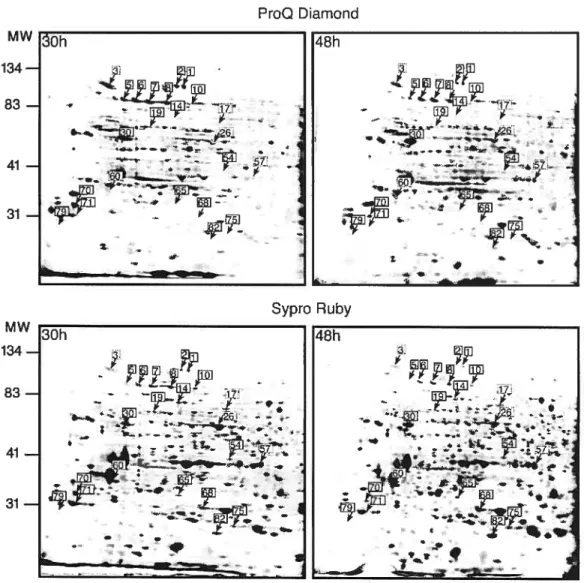
A 6 h period was determined as optimal to obtain high level of radioactive labeling in the ovaries, and the analysis of proteins differentially phosphorylated afier fertilization was carried out in two steps. Firstly, flowers were hand pollinated in the greenhouse and after 24, 30, 36 or 42 h, inflorescence stems were cut and brought into a specially designed growth chamber to enable a safe in vivo labeling procedure (figure 1). Proteins were then isotopically labeled by feeding the cut inflorescence stems bearing 8-10 flowers with a small volume of 32P orthophosphate solution in a microtube for 20 min. The inflorescence stems were then placed in a conical flask containing water and lefi for 6 h. The proteins were extracted from the labeled ovaries and subjected to 2-D electrophoresis. A total of 147 protein spots were detected on the autoradiogram, of which 90 protein spots (figure 2, right panel) could also be identified on the Sypro Ruby stained gel (Figure 2, left panel). Numerous spots were also organized in the horizontal lines, suggesting different levels of phophorylation of the same protein (figure 2, middle panel). Some of the phosphorylated proteins were present in such low amounts that they were under the detection threshold ofthe Sypro Ruby total protein stain (figure 2).
MW )H4 pH7 pH4 pH7 )H4 pH7 :EE’. —‘- —. h “. I • %q a
‘44•
• .+4
, 44
, •Ib 78-41 -31 -17-Figure 2: Comparison of the 2-DE patterns obtaineil from 32P-IabelIing and Sypro
Ruby (total protein) staining. 100 cg of proteins extracted from 32P in vivo-labeled ovaries harvested 48 KAP were separated on IEf strips pH4-7 as first dimension and 10% acrylamide SDS gels as second dimension. The gel was then stained with Sypro Ruby (lefi paneL, proteins colored in pink), then exposed to an autoradiography film and scanned (rniddle panel, proteins colored in blue). The superposition of the two images showing which protein correspond to a phosphoprotein can be seen in the nght panel (dual color).
2.3.3 Antibody detection
For antibody detection, flowers were hand pollinated in the greenhouse and ovaries collected after 30, 36, 42 or 48 HAP. Afier 2-D electrophoresis and electro transfer of the protein on PVDF membranes, a different mix of monoclonal antibodies was used to detect phosphoserine (Figure 3A, middle panel), phosphothreonine (Figure 3B, middle panel), and phosphotyrosine (F igure 3C, middle panel) residues. Before antibody detection, Ponceau Red staining was used to visualize the total protein pattern (Figure 3, lefi panels). Merging ofthe two images in different colors enabled subsequent mapping of the proteins detected with the various antibodies (Figure 3, right panels). A total of 155 spots could be detected with anti-phosphoserine antibodies, while 284 spots were detected with anti-phosphothreonine antibodies, and 222 spots were detected with anti-phosphotyrosine antibodies (Table 1). Image analysis and overlapping ofthe patterns obtained with the different antibodies allowed identification of proteins that were simultaneously phosphorylated on different amino acids. All possible phosphorylation patterns were obtained with some proteins being phosphorylated on serine and threonine residues, serine and tyrosine residues, threonine and tyrosine residues and some showing serine, threonine, and tyrosine phosphorylation (for example spots # 17, 26, 54 in Figure 5). Although a greater number of protein spots had been identified by each individual antibody, only the ones that could be unambiguously assigned to a Ponceau Red stained protein were considered for the Venn diagram analysis shown in Figure 3D. Figure 5 presents the complete compilation map of the phosphoprotein detection methods identified on a Sypro Ruby stained gel. Interestingly, even though putative phospho isomers of some proteins can be observed on the membranes from for ah three antibodies, the anti-phosphotyrosine detection presented the most obvious phospho isomer pattems with horizontal lines showing multiple phosphorylation states of the same protein for almost all proteins phosphorylated on tyrosine residues. Considering that each horizontal hine of spots detected with anti-tyrosine antibodies may be the same protein, the 222 identified spots would correspond to approximately 50 different proteins. This number is consistent with the fact that no tyrosine kinase similar to manmialian tyrosine
kinases have been isolated in plants although some plant protein kinases have been shown to have dual kinase specificity, phosphorylating both $er/Thr and Tyr residues [28, 29]. Furthermore, the characterization of a group of about 20 protein tyrosine phosphatases inArabidopsis suggests a wider role of tyrosine phosphorylation in plants [30].
:*
I’ -jIk.$I — —q q •e
•4
• ,. a. 0* 4•
H4 pH7 pH4 pi-17 pH4 pH7 ;;.
‘ 4 :4D
Phospho-Ser Phospho-Thr Phospho-Tyr H4 oI-17 H4 DH7 oH4 DH7A
MW 132- 78-41 -31-B
MW 132 78 41 31C
MW 132 78 41 31 17 ( 4.’s.
I
ê, H4 pH7 H4 pH7pH4 pH7 •. I “;:f
‘b1
Figure 3: Comparison of the 2-DE patterns obtained with anti-phospho-Ser, anti phospho-Thr, and anti-phospho-Tyr antibody detection. Lefi panels. Total protein (colored in pink) extracted from ovaries O h post-pollination with Ponceau Red staining of the membranes. Middle panels. Detection of the phosphorylated proteins (colored in blue) with anti-phospho-Ser (A), anti-phospho-Thr (B) and anti-phospho-Tyr (C) antibodies. Right panels. Superposition (dual color) of the Ponceau Red stained membranes and the scans obtained from the fluorescein-conjugated secondary antibody. D. Veim diagram analysis of numbers of phosphoproteins detected with different antibodies and matched on the $ypro Ruby gel showing the overlap between the different antibodies.
2.3.4 Phosphospecific protein dye
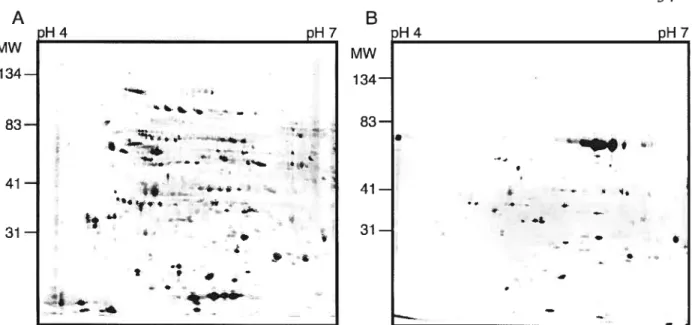
For phosphospecific protein dye detection, flowers were hand pollinated in the greenhouse and ovaries collected afier 30, 36, 42 or 4$ RAP. Afler 2-D electrophoresis, the gels were stained with the phosphospecific protein dye Pro-Q Diamond Phosphoprotein stain. Duration of the staining step had to be optimized and 47 minutes was chosen as the optimal time. With staining times longer than 47 minutes, the patterns obtained were very similar to those obtained from the total protein stain (Sypro Ruby), which suggests that a long staining period leads to a loss of staining specificity. Furthermore, even with this optimized staining time, more putative phosphoprotein spots were observed with Pro-Q Diamond Phosphoprotein stain than with either of other two methods. This, combined with the fact that general protein staining increases with the duration of staining, strongly suggests that this fluorophore is not absolutely specific for phosphoproteins. To test this, the staining pattem obtained with the Pro-Q Diamond stain was compared between ovary proteins extracted with added calyculine A (a phosphatase inhibitor) and a similar extract of ovary proteins treated with aikaline phosphatase for 1 h. The resulting gels are shown in Figure 4. Although the staining of many spots was reduced after pretreatment with aikaline phosphatase (at least 67% of the spots could be counted as reduced or absent after alkaline phosphatase treatrnent), flot all of them were affected. Because of the lack of absolute specificity of the phosphoprotein dye, only those spots that showed a decrease in intensity afier alkaline phosphatase treatment were further considered and herein refened to as phosphoproteins detected by the Pro-Q Diamond Phosphoprotein stain rnethod. Surprisingly, some of the spots showed increased staining after alkaline phosphatase treatment suggesting that, for some proteins, this treatment increased their stainability. The status of these latter as putative phosphoproteins is thus questionable. The staining time and conditions were identical for the two gels.
A B [14 pH7 H4 pH7 MW MW 134— 134— 83— 83— 41— 41 31— 31—
Figure 4: 2-DE patterns obtained with the Pro-Q Diamond phospho-specific stain before and after aikaline phosphatase treatment. A. Pro-Q Diamond stained gel with proteins extracted from ovaries O h post-pollination. B. Pro-Q Diamond stained gel obtained after pretreatment of the ovary extracted proteins with alkaline phosphatase.
_—* 4 4 — —— t * ‘ -4 * 4.’ 4 e
2.3.5 Comparison of the three phosphoprotein detection methods
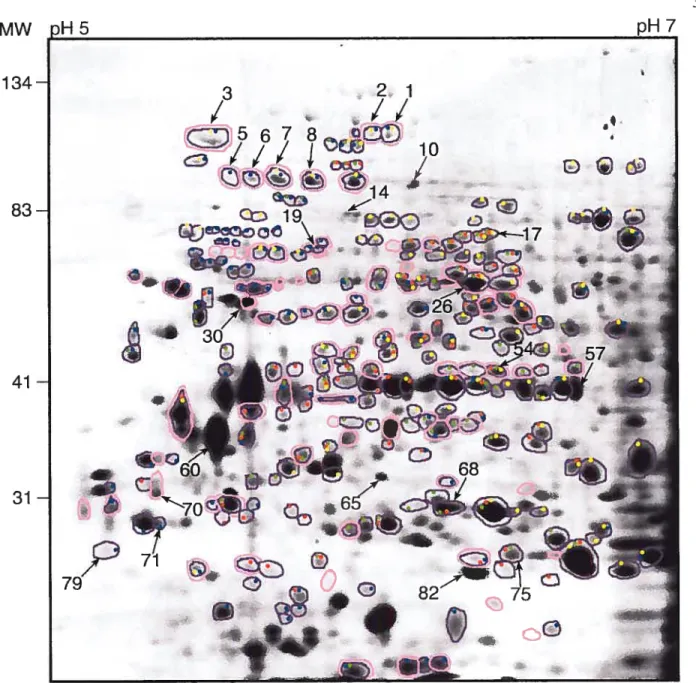
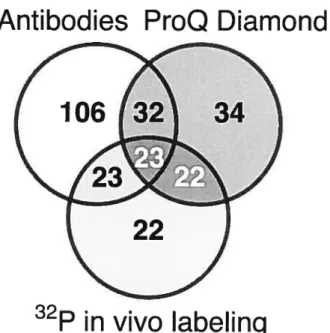
The phosphoproteins detected with these three detection rnethods were mapped onto a single gel to clearly visualize the degree of overlap obtained from the different methods (Figure 5). Table 1 and Figure 6 summarize the sensitivity ofthe three methods used (number of phosphoprotein spots detected) and the different levels of overlap observed. In total, with ah phosphoprotein detection methods combined, 262 phosphorylated proteins could be mapped to the 619 proteins detected by Sypro Ruby staining, represenfing 42% of the total proteins. Among these 262 phosphoproteins, antibodies detected 184 proteins from which only 7$ were also detected with either of other two rnethods (42%). Pro-Q Diamond phosphoprotein stain detected 111 proteins from which 76 were also detected with either ofthe other two methods (68%). The 32P in vivo labeling method detected 90 spots from which 7$ were also detected with either of other two rnethods (87%). Although the antibody detection method could be considered more sensitive from these resuits, it is also generally considered much less specific, especially for phosphoserine and phophothreonine residues [31]. This is reflected by a much higher percentage of spots that could not be confirmed by any of the other two methods (5 8%). Detection with 32P in vivo labeling was the more stringent method with the highest confirmation percentage, while ProQ Diamond staining gave an intermediate confidence level. However, even if the stringency of 32P labehing method seems very appealing, this method can present some serious drawbacks when using it for comparative studies in tissues like flower branches. The length of absorption is very long, combined with the fact that ATP turnover is very rapid and that most of phosphorylationidephosphorylation processes can happen very fast, it is almost impossible to track those instantaneous changes during fertilization with this method. Only 23 proteins were detected with all three methods simultaneously, representing 3.7% of the total proteins and 8.8% of ail the phosphorylated proteins detected. These results clearly indicate that ahhough there is no perfect method for phosphoprotein detection, and that some might be more appropriate depending on the tissue used. Confirmation by
alternative methods will significantÏy increase the assurance in assigning a protein as a phosphoprotein from a 2-DE gel analysis.
MW
134
83
41
31
Figure 5: Compilation map of the phosphoproteins detected with the three different detection methods. Phosphoproteins detected by ail the different methods were mapped onto a single gel made from proteins extracted from non fecundated ovaries and stained with Sypro Ruby. Spots circled in pink represent phosphoproteins detected with the 32P-orthophosphate in vivo labeling method. Spots circled in deep violet represent phosphoproteins detected from non-in vivo iabeling methods. Dots of different colors represent detection with Pro-Q Diamond (blue dot), anti-phospho-serine antibody
detection (yellow dot), anti-phospho-threonine antibody detection (red dot) and anti phospho-tyrosine antibody detection (green dot). for the Pro-Q Diamond detection method, only the proteins which had reduced staining afier aikaline phosphatase treatment were considered to be phosphoproteins. Anows with numbers indicate proteins that showed a reproducible variation following fertilization and that were identified by LC-MS/MS.
Detection mcthod used Total number of Total number of Number of Percentage of
protein spots phosphoprotein spots phosphoprotein spots phosphoprotein spots’
detected detected detected on the Sypro
Ruby_stained_gel
Sypro Ruby staining 619 - -
-Ponceau/anti P-Ser antibody 206 155 97 15.7 Ponceau/anti P-Thr antibody 284 284 75 12.1 Ponceaiilanti P-Tyr antibody 357 222 86 13.9
Proteins deteed with
at lea.st 1 antibody
-- 184
29.7
Proteins deteedwiU,
anti P-Ser+anti
P-Ponceau! - - 23 3.7
Tyr Antibody
staining Proteins detected with
anti P-Ser+ antiP- -
-24 3.9
Thr
Proteinsdetected with
antiP-Thr+ antiP- - - 5.8
36 Tyr
Proteins detected with
antiP-Set+anti P- -
-11 1.8
Tyr+anti P-Thr
Detected only by
106 17.1
antibody method -
-Sypro Ruby! AIl 453 147 90 14.5
32P staining Dctected only with
22 3.6
32P -
-ProQ Diamond AIl 353 236 111 17.9
stain Detected only with
5.5
withoutAvith ProQ Diamond
- - 34 phosphatase method Phosphoproteins detected by different -- 262 42.3 methods Phosphoproteins
detected with aIl 3 -
-23 3.7
rnelliods
Combination Proteins detected with
ofdifferent ProQ Diamond+
22 3.6
methods method
-
-Proteins detected with
PtoQ Diamond+ -
-32 5.2
antibody method Proteins detected vit1,
antibodies+
-- 23 3.7
Table 1. Comparison of different phosphoprotein detection methods. The total number of protein spots represent those detected with the general protein detection method (Sypro Ruby) on the gel which was latter subjected to a phospho protein detection method. The total number of phosphoproteins represent those detected with the given phosphoprotein detection method on the gel or the membrane. The number of phosphoprotein spots detected on the $ypro Ruby stained gel represent the number of phosphoprotein spots that could be mapped to a $ypro Ruby stained gel (see figure 5).
Antibodies ProQ Diamond
Figure 6 : Venn diagram analysis of numbers of phosphoproteins detected with the three different detection methods used and matched on the Sypro Ruby gel.