HAL Id: hal-00326634
https://hal.archives-ouvertes.fr/hal-00326634
Submitted on 4 Oct 2008
HAL is a multi-disciplinary open access
archive for the deposit and dissemination of
sci-entific research documents, whether they are
pub-lished or not. The documents may come from
teaching and research institutions in France or
abroad, or from public or private research centers.
L’archive ouverte pluridisciplinaire HAL, est
destinée au dépôt et à la diffusion de documents
scientifiques de niveau recherche, publiés ou non,
émanant des établissements d’enseignement et de
recherche français ou étrangers, des laboratoires
publics ou privés.
Observation of wave turbulence in vibrating plates
Arezki Boudaoud, Olivier Cadot, Benoît Odille, Cyril Touzé
To cite this version:
Arezki Boudaoud, Olivier Cadot, Benoît Odille, Cyril Touzé. Observation of wave turbulence in
vibrating plates. Physical Review Letters, American Physical Society, 2008, 100 (23), pp.234504.
�10.1103/PhysRevLett.100.234504�. �hal-00326634�
Arezki Boudaoud
Laboratoire de Physique Statistique, CNRS / ENS / Paris 6 / Paris 7, 24 rue Lhomond, 75231 Paris Cedex 5, France
Olivier Cadot, Benoˆıt Odille, and Cyril Touz´e
ENSTA-UME, Unit´e de Recherche en M´ecanique, Chemin de la Huni`ere, 91761 Palaiseau, Cedex, France
(Dated: October 4, 2008)
The nonlinear interaction of waves in a driven medium may lead to wave turbulence, a state such that energy is transferred from large to small lengthscales. Here, wave turbulence is observed in experiments on a vibrating plate. The frequency power spectra of the normal velocity of the plate may be rescaled on a single curve, with power-law behaviors that are incompatible with the weak turbulence theory of D¨uring et al. [Phys. Rev. Lett. 97, 025503 (2006)]. Alternative scenarios are suggested to account for this discrepancy — in particular the occurrence of wave breaking at high frequencies. Finally, the statistics of velocity increments do not display an intermittent behavior.
PACS numbers: 47.27.Gs, 62.30.+d, 47.35.Jk
The statistical distribution of energy and energy fluxes are central questions concerning out-of-equilibrium dissi-pative systems with a large number of degrees of free-dom. When waves propagate in a medium, their nonlin-ear interaction might generate other waves with different wavenumbers, which means that energy is transferred be-tween different lengthscales. If the amplitude of waves is large enough, this transfer leads to a distribution of energy on a large number of wavelengths, and the sys-tem reaches a state called wave turbulence [1], such that the energy cascades between scales and might be dissi-pated on a small scale. Although they share the same phenomenology, wave turbulence is much more advanced analytically [1] than hydrodynamic turbulence [2]. For waves of small amplitude, the framework of weak tur-bulence yields kinetic equations, the solutions of which have been derived starting from the mid-1960s and cor-respond to energy spectra with power-law dependence on the wavenumber. Wave turbulence might apply to capil-lary [3, 4] or gravity [5, 6] waves on the surface of liquids, to plasmas [7], to nonlinear optics [8], to magnetohydro-dynamics [9] or even to Bose-Einstein condensates [10].
Experimental studies are much less numerous than theoretical ones; they were performed either on the oceanographic scale — waves on a stormy sea (e.g. [11]), or on the laboratory scale — capillary and gravity waves [12, 13, 14, 15, 16, 17, 18]. Besides, the domain of validity of weak turbulence theory is still a matter of debate. On the one hand, discontinuities in the slope of breaking waves result mathematically in a wide en-ergy spectrum [19, 20], as apparently observed for grav-ity waves [18]. On the other hand, weak turbulence the-ory results in Gaussian statistics for the waves, in con-trast with experiments when bursts of intense motion occur [13, 17], a phenomenon known as intermittency. In this context, the theoretical study in [21] is very useful
as it provides a new system, vibrating plates, where wave turbulence could be observed.
Here we study experimentally a suspended plate driven at high amplitudes [22]. We show that a wide energy spectrum is generated, discuss its interpretation in terms of weak turbulence and wave breaking, and investigate whether the system is intermittent. The typical broad-band spectrum observed is also of special interest for its applications, e.g. for reproducing the sound of thunder in theaters. It is also related to the bright shimmer-ing sound of gongs and cymbals [23, 24]. Transition to chaotic vibration was studied for cymbals in [23], and for panels in [25, 26].
The experimental setup consists of a steel plate sus-pended to a rigid frame and forced with a vibration gener-ator (shaker B&K4810, glued to the plate with beeswax) moving perpendicularly to the plate (fig. 1a). The plate comes from a reverberation unit named EMT140, that was widely used in studio recordings to add a reverber-ated sound effect to dry signals recorded by near-field microphones [27]. Hence, the plate was chosen for its very high modal density, obtained by large dimensions 2 m × 1 m for a thickness of h = 0.5 mm, as well as for the moderate values of the quality factor, in order to get a fuzzy reverberated sound. Material properties were estimated as: Young’s modulus E = 200 GPa, Poisson’s
ratio ν = 0.3 and mass per unit volume ρ = 7800 kg/m3.
The plate is fixed at its four corners, so that the bound-ary condition is mainly free. The forcing is sinusoidal at
fi = 20 Hz that is close to a resonant frequency of the
plate; it was chosen in order to allow the best injection of energy in the system, so that the turbulent regime is reached more easily. A laser vibrometer gives the normal velocity v(t) at a given point in the plate. The signal is acquired at the sampling frequency of 32 kHz, and the FFT is computed from 50 s of signal, averaged over time
2 laser vibrometer (a) 40cm 40cm measurement points 2m 1m generatorvibration 0 100 200 300 400 500 −40 −20 0 20 40 430 440 450 460 470 480 −20 −10 0 10 20 t (ms) t (ms) (b) (c) (mm/s) (mm/s) v v
FIG. 1: The experiment. (a): set-up with a steel plate of dimensions 2 m × 1 m and thickness h = 0.5 mm; close-up view of the fixation. (b),(c): time series of the local transverse velocity measurements v(t) for the forcing frequency fi= 20
Hz; duration of 10 times (b) and 1 time (c) the forcing period.
windows of 0.5 s, so that ∆f = 2 Hz. A force sensor (impedance head B&K 8001) is mounted between the shaker and the plate. The simultaneous measurement of the velocity at the same point gives the average power I = hF vi injected by the generator into the system (with 1 mW of accuracy).
For a bending wave of frequency f and wavenumber k, the dispersion relation is
f = hck2, with c =pE/12ρ(1 − ν2)/ 2π (1)
proportional to the sound velocity in the bulk material. It was checked in [27] that this dispersion relation indeed holds in the present setup. It gives the space-time cor-respondence of the statistical properties of the velocity signal, similarly to Taylor’s hypothesis for fully turbu-lent flows [2], when fluctuations are not too large.
For very low forcing amplitude, the velocity signal v(t) recorded by the vibrometer is sinusoidal. For higher am-plitude, it becomes chaotic (fig. 1b,c). In the frequency space, v(t) is characterized by its power spectrum Pv(f ),
given by the Fourier transform of the auto-correlation function, Pv(f ) = R hv(t)v(t + τ)i exp(2πif τ) dτ. This
spectrum becomes broadband at high forcing (fig. 2a), which is typical of wave turbulence; however, even with
a long time-averaging of the signal, Pv keeps a
num-10−2 10−1 100 10−4 10−2 100 101 102 103 10−6 10−4 10−2 100 10−2 10−1 103 (a) (b)
φ
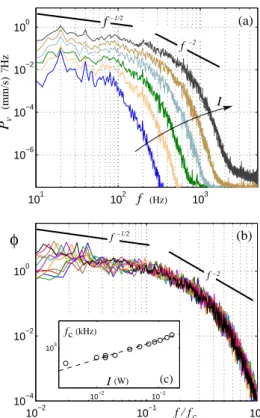
−1/2 −2 f (Hz) I c f / f (c) I(W) c (kHz) −1/2 −2 f 2 Pv (mm/s) /Hz f f f fFIG. 2: Power spectra of the transverse velocity. (a): raw Pv(f ) as a function of frequency f , for different values of
in-jected power I (in increasing order as displayed by the arrow: < 1 mW, 2.3, 8.8, 26.4, 68.8, 136 mW); errors ∆f = 2Hz and ∆Pv= 10−
7
(mm/s)2
/Hz. (b): rescaled spectra (I0/I) Pv
ac-cording to Eq.2 vs. f /fcfor all forcing amplitudes, where fc
is defined by (I0/I) 1/2 Pv(fc) = 10− 5 mm2 /s. Inset (c): evo-lution of fc with the forcing intensity . The continuous line
is the best power law given in Eq. (2), yielding an exponent α = 0.33.
ber of peaks corresponding to the plate eigenfrequen-cies. We checked homogeneity (by changing the exci-tation and measurement points) and independence on boundary conditions (by imposing fixed displacements at points at the edge); these changes affected very slightly the power spectra below the injection frequency .
As the forcing amplitude is increased, the spectra ex-hibit a wider and wider power-law dependence on fre-quency, Pv(f ) ∼ f−β with β = 0.5 ± 0.2 (this error is an
upper bound), which would correspond to the cascade regime. It is followed by a fall which could correspond to the dissipative scale. We seek the best rescaling of the spectra as a function of the injected power I. This yields the scaling form
Pv(f ) = (I/I0)1/2φ (f /fc) , fc∝ fi(I/I0)α. (2)
Here φ a scaling function, I0 a unit of power and fc a
cut-off frequency. This rescaling enables to collapse the spectra on a single curve (fig. 2b). The exponent for the
101 102 103 10−1 100 101 0 10 101 103 102 1 10 −1 γ(s )f 10−1 (Hz) 1/2 f f
FIG. 3: Damping factor for the present plate, from [27].
dependence of fc on I is found to be α = 0.33 ± 0.01
(fig. 2c). In the cascading frequency range, this implies Pv(f ) ∼ I1/2+αβf−β= I0.66±0.07f−0.5±0.2.
In order to compare with previous theoretical work, we first note that the power spectrum for the transverse dis-placement ξ of the plate is given by Pξ(f ) ∝ Pv(f )/f2.
When weak turbulence is attained, as investigated in [21], the spatial power spectrum of the displacement can be rewritten as Pξ(k) ∝ c−1ǫ1/3k−4, introducing energy
flux ǫ per unit mass (ǫ has units of a velocity cubed and is proportional to the power input I), and omit-ting numerical prefactors and a logarithmic dependence on k. ǫ is proportional to the injected energy I. The 1/3 exponents for ǫ comes from the ξ → −ξ symme-try of the plate, which involves four waves interaction. The spectrum can be translated into the frequency space Pξ(k)kdk ∝ Pξ(f )df . Using the dispersion relation (1),
we get Pξ(f ) ∝ hǫ1/3f−2 and Pv(f ) ∝ hǫ1/3 is constant.
This dependence is significantly weaker than in the mea-surements (fig. 2a,b).
In the framework of weak turbulence, nonlinearities of order p imply that Pv(f ) scales as ǫ1/p [1]; the
ex-ponent 1/2 obtained for p = 2 is the closest to the measured .66 ± 0.07 (2). This value of p = 2 means three waves interactions, a quadratic nonlinearity and no ξ → −ξ symmetry. Indeed, geometrical imperfec-tions are unavoidable in real plates, which is known to break this symmetry and to produce quadratic non-linearities [28]. Therefore, we assume in the following that Pv(f ) ∼ ǫ1/2f−1/2, corresponding to a displacement
spectrum Pξ(f ) ∼ ǫ1/2f−5/2. This assumption allows to
investigate the possible role of damping in setting the cutoff frequency.
Indeed, we introduce the damping rate γ(f ) ∼ fδ.
The spectrum of the energy per unit mass is E(f ) ∝
Pv(f ) ∼ ǫ1/2f−1/2. Let us consider the balance of
energy over the cascade frequency range; the in-flux
is ǫ while the energy dissipated till fc = hckc is
Rkc
γ(k)E(k) dk ∝ Rfcγ(f )E(f )phc/f df. Balancing
these two fluxes yields fc ∼ ǫ1/ 2δ. For our setup, a
fit to the damping coefficient measured in [27] is shown in fig. 3 in the frequency domain of interest. It yields
δ ≃ 1/2, so that fc∼ ǫ ∼ I, which is far from
measure-ments (2) and so damping cannot account for the cutoff. A last option is that the wide energy spectrum might be generated by singularities of the plate displacement as
for gravity waves [19]. For plates, wave breaking would be replaced [21] by ridges [29, 30] and d-cones [31, 32]. It was shown in [20] that random independent slope dis-continuities result in a spectrum Pξ(f ) ∝ νsΓ2f−4, νs
being the frequency of occurrence of slope discontinuities and Γ the rms velocity impulse at each discontinuity. For the velocity Pv(f ) ∝ νsΓ2f−2 which compares with the
second part of the spectra (fig. 2a,b) over half a decade. Besides, the jump should be given by the typical rms velocity vrmsI1/2, so that we expect Γ ∼ ǫ1/2. As a
con-sequence, the whole spectrum could result from a 3-waves interaction for low frequencies, as suggested above, and singularities for higher frequencies. These two spectra match at a frequency f = fcsuch that ǫ1/2f−1/2∼ ǫf−2,
yielding f ∼ ǫ1/3, which agrees with the scaling (2) as
seen in fig. 2c.
Finally, we consider the statistics of of the velocity in-crements defined as ∆τv = v(t + τ ) − v(t). The PDFs are
displayed in fig. 4a for the large forcing amplitude. An intermittent behavior of the velocity statistics would be revealed by a change in the PDFs shape as the lag τ de-creases [2]. Here we can see in fig. 4a that the PDF shape remains satisfactorily Gaussian whatever τ . The struc-ture functions, Sp(τ ) = h|∆τv|pi, are plotted in fig. 4b.
They are generally used to determine the scaling behavior of the velocity differences statistics with the time-lag τ [2]. The structure functions start to decrease for τ < 50 ms (i.e. the forcing period). For very small τ < 0.3 ms (i.e. the cut-off frequency), the velocity signal
be-comes smooth and a simple scaling behavior Sp(τ ) = τp
is found. For wave turbulence, the range of interest is comprised between these two last extremes. However, within this range no clear power laws are distinguishable in fig. 4b. We then chose to plot the structure functions versus S2(τ ) in fig. 4c. This technique was used for fully
developed turbulence to measure anomalous scaling ex-ponent due to the intermittency phenomenon [33]. In our case, the scaling exponents, defined as: Sp(τ ) ∝ S2(τ )ζp, are indicated in fig. 4c for each order moment p. There is
no significant deviation from ζp = p/2, meaning that no
anomalous scaling is observable. Hence, wave turbulence in plates does not exhibit any intermittency phenomenon. To summarize, we observed a broadband spectrum in a vibrating plate and investigated the variations of the cut-off frequency. In this context, internal damping mechanisms (mainly thermoelastic and viscoelastic losses for our plate [27]) seem to be irrelevant. Losses at the edge [21] can be discarded as the plate is fixed only at the corners. The radiation of acoustic waves in air is negligible since the frequencies of interest are well below the coincident frequency, for which bending and acous-tic waves have the same phase velocity. The value of this frequency has been measured as 20 kHz in our set-up [27]. For thicker plates, the coincident frequency may fall in the frequency range of interest, thus leading to a huge increase of the damping factor, see e.g. [34]. This
4 −4 −2 0 2 4 10−6 10−4 10−2 100 102 104 106 (a) ∆ /στ
v
τ 0.98 ms 0.24 ms 0.12 ms τ= τ= τ= τ= τ= 3.9 ms 15.6 ms PDF 10−1 100 101 102 10−1 100 101 102 103 104 105 106 107 108 109 100 101 102 100 101 102 103 104 105 106 107 108 101 100 10−1 100 101 102 100 102 104 106 101 103 105 107 τ(ms) S2 S4 S5 10* S3 10* S2 Sp S3 10* S4 S5 10* S6 (b) (c) 3 ζ =4 ζ =5 ζ = Sp 8 10 6 S 2.98 2.47 2.0 1.49 ζ =6FIG. 4: Statistical properties of the velocity increments ∆τv = v(t + τ ) − v(t) (injected power 136 mW). Probability
density functions compared to Gaussians in (a). Structure functions of order p = 2, 3, 4, 5, 6, versus (b): the timelag τ , and (c): the order 2 structure function S2. Continuous lines
are best power laws fits with exponents ζp(see text).
could affect the conclusions on the cut-off. Our experi-mental results suggest a 3-waves spectrum matched to a spectrum of singularities where dissipation occurs. Ob-viously they call for more theoretical effort, in particular concerning the weak turbulence of plates with quadratic nonlinearities or the turbulence of singularities.
We are grateful to K. Arcas, E. Hamm, F. Melo and S. Rica for help and discussions. J.-M. Mainguy and L.-C. Tr´ebuchet from Radio-France are also thanked for the loan of the plate reverberator. This work was partially supported by ANR Blanc OPADETO.
[1] V. E. Zakharov, V. S. Lvov, and G. Falkovisch, Kol-mogorov Spectra of Turbulence I: Wave Turbulence (Springer Verlag, Berlin, 1992).
[2] U. Frisch, Turbulence (Cambridge Univers. Press, 1995). [3] V. E. Zakharov and N. N. Filonenko, J. Appl. Mech.
Tech. Phys. 8, 37 (1967).
[4] A. N. Pushkarev and V. E. Zakharov, Phys. Rev. Lett. 76, 3320 (1996).
[5] V. E. Zakharov and N. N. Filonenko, Sov. Phys. Dokl. 11, 881 (1967).
[6] M. Onorato, A. R. Osborne, M. Serio, D. Resio, A. Pushkarev, V. E. Zakharov, and C. Brandini, Phys. Rev. Lett. 89, 144501 (2002).
[7] S. L. Musher, A. M. Rubenchik, and V. E. Zhakarov, Phys. Rep. 252, 177 (1995).
[8] S. Dyachenko, A. C. Newell, A. Pushkarev, and V. E. Zakharov, Physica D 57, 96 (1992).
[9] S. V. Nazarenko, A. C. Newell, and S. Galtier, Physica D 152-153, 646 (2001).
[10] Y. Lvov, S. V. Nazarenko, and R. West, Physica D 184, 333 (2003).
[11] M. A. Donelan, J. Hamilton, and W. H. Hui, Phil. Trans. Roy. Soc. London A 315, 509 (1985).
[12] R. G. Holt and E. H. Trinh, Phys. Rev. Lett. 77, 1274 (1996).
[13] W. B. Wright, R. Budakian, D. J. Pine, and S. J. Put-terman, Science 278, 1609 (1997).
[14] E. Henry, P. Alstrom, and M. T. Levinsen, Europhys. Lett. 52, 27 (2000).
[15] M. Y. Brazhnikov, G. V. Kolmakov, A. A. Levchenko, and L. P. Mezhov-Deglin, Europhys. Lett. 58, 510 (2002). [16] E. Falcon, C. Laroche, and S. Fauve, Phys. Rev. Lett.
98, 094503 (2007).
[17] E. Falcon, S. Fauve, and C. Laroche, Phys. Rev. Lett. 98, 154501 (2007).
[18] P. Denissenko, S. Lukaschuk, and S. Nazarenko, Phys. Rev. Lett. 99, 014501 (2007).
[19] O. M. Phillips, J. Fluid Mech. 156, 505 (1985). [20] E. A. Kuznetsov, JETP Letters 80, 83 (2004).
[21] G. D¨uring, C. Josserand, and S. Rica, Phys. Rev. Lett. 97, 025503 (2006).
[22] A. Boudaoud, E. Hamm, and F. Melo, Phys. Rev. Lett. 99, 254301 (2007).
[23] C. Touz´e and A. Chaigne, Acta Acustica 86, 557 (2000). [24] A. Chaigne, C. Touz´e, and O. Thomas, Acoust. Sc. Tech.,
Acoust. Soc. of Japan 26, 403 (2005).
[25] T. M. K. Nagai, S. Murayama and T. Yamaguchi, J. Sound Vib. 305, 492 (2007).
[26] M. Amabili, Int. J. Non-linear Mech. 40, 683 (2005). [27] K. Arcas, in Proceedings of the ICA (Madrid, 2007). [28] D. Hui and A. W. Leissa, ASME J. App. Mech. 50, 750
(1983).
[29] A. E. Lobkovsky, S. Gentges, H. Li, D. Morse, and T. A. Witten, Science 270, 1482 (1995).
[30] A. E. Lobkovsky, Phys. Rev. E 53, 3750 (1996). [31] M. Ben Amar and Y. Pomeau, Proc. R. Soc. Lond. A
453, 729 (1997).
[32] E. Cerda, S. Cha¨ıeb, F. Melo, and L. Mahadevan, Nature 401, 46 (1999).
[33] R. Benzi, S. Ciliberto, R. Tripiccione, C. Baudet, F. Mas-saioli, and S. Succi, Phys. Rev. E 48, R29 (1993).
[34] A. Chaigne and C. Lambourg, J. Acoust. Soc. Am. 109, 1422 (2001).
![FIG. 3: Damping factor for the present plate, from [27].](https://thumb-eu.123doks.com/thumbv2/123doknet/7764467.255695/4.892.110.396.75.167/fig-damping-factor-present-plate.webp)

