HAL Id: hal-01178202
https://hal.archives-ouvertes.fr/hal-01178202
Preprint submitted on 17 Jul 2015HAL is a multi-disciplinary open access archive for the deposit and dissemination of sci-entific research documents, whether they are pub-lished or not. The documents may come from teaching and research institutions in France or abroad, or from public or private research centers.
L’archive ouverte pluridisciplinaire HAL, est destinée au dépôt et à la diffusion de documents scientifiques de niveau recherche, publiés ou non, émanant des établissements d’enseignement et de recherche français ou étrangers, des laboratoires publics ou privés.
The Index of Economic Freedom: Methodological
matters
Issaka Dialga, Thomas Vallée
To cite this version:
Issaka Dialga, Thomas Vallée. The Index of Economic Freedom: Methodological matters. 2015. �hal-01178202�
Dale Squires
EA 4272
The Index of Economic Freedom:
Methodological matters
Issaka Dialga*
Thomas Vallée*
2015/16
(*) LEMNA, Université de Nantes
Laboratoire d’Economie et de Management Nantes-Atlantique Université de Nantes
Chemin de la Censive du Tertre – BP 52231 44322 Nantes cedex 3 – France www.univ-nantes.fr/iemn-iae/recherche Tél. +33 (0)2 40 14 17 17 – Fax +33 (0)2 40 14 17 49
D
o
cu
m
en
t
d
e
T
ra
va
il
W
o
rk
in
g
P
ap
er
1
The Index of Economic Freedom: methodological matters
Issaka Dialga1 and Thomas Vallée2
LEMNA, University of Nantes, France
Abstract
Composite indicators (CIs) are essential in public debates and policies so the social demand for synthetic tools is constantly increasing. They are also subject to criticism (see Saisana and Saltelli 2010; Klugman et al, 2011) due to lack of a gold standard in their construction. The Index of Economic Freedom (IEF) is one of these tools subject to criticism because it suffers from methodological matters. The IEF lacks statistical validity because two of its components are strongly and negatively correlated with the others. Both components are causing significant variations in 95 percent of countries ranked. This paper deals with these issues by using Principal Components Analysis (PCA) and Benefit Of the Doubt (BOD) methods to generate component and country specific weights in computing the scores. The PCA and BOD analyses provide consistent results that differ dramatically with the baseline ones (results using equal weights). Given stable results provided by the PCA and BOD analysis, the IEF would receive broad legitimacy basing the calculation of its scores on endogenous weighting models.
Keywords: Index of economic freedom; Principal components Analysis; Benefit of the Doubt weighting system; country ranking
2
1.
Introduction
Composite indicators (CIs) are used in a wide range of fields such as the environment, the economy, society and technological development (OECD-JRC, 2008). CIs allow us to see “the big picture” and the complexity of a given sector, which cannot be captured by an individual indicator. It is an ideal means for comparing the performance of different countries. The United Nations Development Program (UNDP) has created many CIs such as the Human Development Index (HDI) which allows us to compare countries by taking into account the following dimensions: income, life expectancy and education. Nowadays, public policies are largely dependent on these synthetic tools. Hence, former French President, Mr. Nicolas Sarkozy, launched in 2008 a commission named “Commission on the Measurement of Economic Performance and Social Progress” or “Commission Sitglitz-Sen-Fitoussi”. The social demand for such multidimensional measures has increased, like the political one as a consequence, and of course, research has increased as well (see Figure 2in appendix 1).
Obviously, such indicators are not without their critics (Saisana and Saltelli, 2010; Klugman, et al, 2011). Most of these critics focus on the methodological aspects in the CIs construction. In particular, the choice of certain weights of variables as components in CIs can be very subjective with no empirical evidence nor defendable theoretical foundation presented (Conseil de l’Europe, 2005; Stiglitz, Sen and Fitoussi, 2009).
As a consequence, these critics persist in questioning the local legitimacy of these indicators as guidance and follow-up tools for public actions (FAIR, 2011) since they can send misleading policy messages if they are poorly constructed or misinterpreted (Saisana and Saltelli, 2010).
For the past two decades, the Heritage Foundation has published annually an index of economic freedom (IEF) in 186 countries all over the world. The index focuses on four aspects of the economic environment over which governments can exercise some policy control which can condemn individuals to poverty and deprivation (Heritage Foundation ,2014). Unfortunately, the index suffers from statistical validity. Two of its ten components are strongly and negatively correlated with the others meaning that all components are not necessarily equally weighted in the composite index (Nardo et al. 2005; OECD and JRC, 2008).
3
This paper deals with this issue using PCA and BOD approach to generate unequal weights. The article is organized as follow: section 2 provides a short methodological description of the two problematical components of the index. We assess the contribution of two negative correlated components to countries ranking by removing them. Section 3 uses the two PCA and BOD methods to generate country specific score. Section 4 concludes by giving the salient points of the analysis.
2.
Index of Economic Freedom: methodological presentation
According to the Heritage Foundation, most individuals lack economic freedom and opportunity because most of them are not free to work, produce, consume and invest in any way they please. Yet, economic freedom is one of the fundamental human rights. To assess the degree of a economically free society, the Heritage foundation constructed an index of economic freedom. The index focuses on four key aspects of economic activity over which governments can exercise some policy control. The four key domains are namely government size, market openness, regulatory efficiency and rule of law. The four aspects (pillars) are subdivided into 10 components (see Figure 1) that are aggregated using an arithmetic mean with
4
Figure 1 – The IEF framework
As recommended by Tarantola et Vertesy (2012), a multivariate analysis has to be carried out in order to verify the internal statistical consistency of the data within each pillar/dimension of the conceptual framework. Ideally, a composite indicator is structured in such a way that each pillar describes a single latent component. This requires a positive and high level of correlation within each pillar. There are two ways to test this: using a correlation table including all indicators and by conducting classical Principal Component Analysis (PCA) as a method of dimensionality. Based on the PCA results, relevant dimensions can be accepted if they adhere to the following criteria: (a) have an eigenvalue above 1 (Kaiser criterion); (b) account for at least 10% of total variance; (c) cumulatively contribute to more than 60% of total variance (OECD-JRC, 2008).
As we will see in Table 1, the “Government size” pillar is a problematic one. But first, let’s explain exactly what it is. The components of the three other pillars are detailed in Appendix 2.
Government size
As illustrated in Figure 1, two indicators are used to take into account the influence of government control on economic freedom. They are fiscal freedom and government spending.
•Fiscal Freedom •Government Spending
Government
Size
•Trade Freedom •Investment Freedom •Financial FreedomMarket
Openness
•Business Freddom •Labor Freedom •Monetary FreedRegulatory
Efficiency
•Property Rights•Freedom from Corruption
5
Fiscal freedom measures the level of taxation of both individual and corporate income. The
authors use a quadric cost function in the sub-indicator construction to reflect the diminishing revenue returns from very high rates of taxation. Formally, the index is:
= 100 − ( ) (1)
Where denotes three levels of taxation such as the top marginal tax rate on individual income, the top marginal tax rate on corporate income, and the total tax burden as a percentage of GDP;
denotes the country. The α parameter is calibrated to 0.03. Indeed, when there is no tax burden, the country gets the highest score which is equal to 100.
Government spending captures the burden induced by government expenditures including
state consumption and transfer payments. The idea is that government spending causes chronic budget deficits and the accumulation of public debt. Those are one of the most serious drags on economic dynamism. Methodologically, the authors use the same formula as fiscal freedom to construct scores:
= 100 − ( ) (2)
Where is scaled to 0.03. The benchmark is zero expenditure while the optimal spending is assumed to be 30% of GDP. There is no theoretical justification for such a choice. Furthermore, if the government spending is greater or equal to 58% of GDP, the country score in this component is zero. In other words, (30% #$) provides an optimal score for the country
while 100 − (58% #$) = 0.
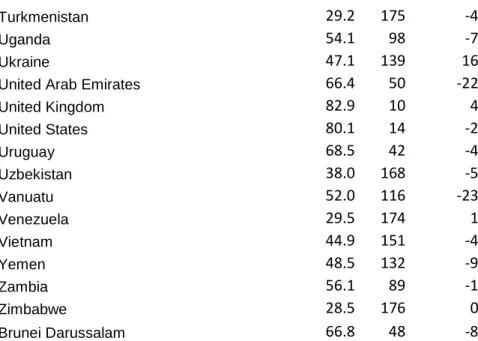
Country ranking assessment without fiscal freedom and government spending components
The two components have more impact on country ranking. As Table 8 shows in the appendix, removing the two components (fiscal freedom and government spending) causes large variations in country ranking. Considering 2014 IEF data, 95 per cent of countries change place. Most of them lose places ranging from one place (for Benin, Angola, and Singapore) to 23 (for Vanuatu). Countries such as France and Lesotho improve their scores and gain 43 and 50 places respectively. These preliminary results support our intuition that the two components deserve special attention. The section below deals with this matter.
6
3. Using PCA and BOD approaches for generating specific weights
3.1.
PCA approach and correlation validity
Once again, and following the recommendation of Tarantola and Vertesy (2012), each pillar should describe a single latent component which requires a positive and high level of correlation within each pillar and positive correlation inside each pillar. Furthermore, the question of weights is always an important one. Table 1 shows the correlation structure between the different components. As one can easily see, the two components, “Fiscal Freedom” and “Government Spending”, which define the “Government Spending” pillar, are negatively correlated to the others. Such a negative correlation can be interpreted in two ways: first, the definition of the components is problematic; second, these components should belong to a separate pillar different from all the other components. We will not discuss whether or not these two components are theoretically well-defined, but we will concentrate on the second solution by conducting a PCA analysis.
7
Table 1-Pearson Correlation Matrix
PROPERTY RIGHTS FREEDOM FROM CORRUPTION FISCAL FREEDOM GOV’_T SPENDING BUSINESS’ FREEDOM LABOR FREEDOM PROPERTY RIGHTS 1.000 FREEDOM FROM CORRUPTION 0.934 1.000 FISCAL FREEDOM -0.211 -0.240 1.000 GOV’_T SPENDING -0.317 -0.371 0.476 1.000 BUSINESS FREEDOM 0.702 0.680 0.077 -0.209 1.000 LABOR FREEDOM 0.359 0.355 0.261 -0.031 0.439 1.000 MONETARY FREEDOM 0.479 0.432 0.193 0.037 0.474 0.303 TRADE FREEDOM 0.505 0.489 0.128 -0.130 0.577 0.313 INVESTMENT FREEDOM 0.706 0.631 -0.092 -0.139 0.612 0.271 FINANCIAL FREEDOM 0.746 0.670 -0.020 -0.134 0.644 0.278
Results of PCA Analysis
PCA analysis highlights that at least two components exist. Notice that PCA supposed a linear arithmetic aggregation method. Methodologically, three conditions have to be satisfied. First, to determine the number of relevant latent variables in the set of components, theeigenvalue associated with the variable adopted should be ≥1. Second, the individual contribution of the variable to the total variance should be at least ≥10%. Third, the cumulative of variances must be ≥ 60%.
Table 2: Determining the number of relevant factors
Factors Eigenvalues % of variance Cumulative %
Factor 1 4.999 49.993 49.993 Factor 2 1.742 17.416 67.409 Factor 3 0.899 8.991 76.400 Factor 4 0.606 6.055 82.455 Factor 5 0.483 4.832 87.287 Factor 6 0.428 4.278 91.565 Factor 7 0.326 3.255 94.820
8
Factor 8 0.287 2.872 97.692
Factor 9 0.174 1.744 99.436
Factor 10 0.056 0.564 100.00
Table 2Table 2 shows that there are two relevant factors because only the first two factors meet
the first condition of the choice of the number of latent factors (i.e. eigenvalues ≥1). This result means that components belonging to each of those factors cannot be equally weighted as the Heritage Foundation has done. These results allowed us to use PCA method to generate countries specific weights.
Table 3: Components weights generated from PCA approach
Variables Weights
Weights variation (%)
Property Rights 0.115 15
Freedom from Corruption 0.103 3
Fiscal Freedom 0.124 23 Gov't Spending 0.095 -5 Business Freedom 0.110 10 Labor Freedom 0.045 -55 Monetary Freedom 0.084 -16 Trade Freedom 0.094 -6 Investment Freedom 0.113 13 Financial Freedom 0.119 19
Table 3 shows, in contrast to the equal weight adopted by the Heritage Foundation, the specific component weight and its deviation (in %) from the equal weight assumption. As one can see, although a small variation occurs concerning the Freedom from corruption indicator (+3%), the change is substantial for the Labor Freedom indicator and the Fiscal Freedom one. This analysis can be done by looking at changes in the pillar level. As shown by Table 4, it impacts mainly the Regulatory Efficiency domain. The global weight of this key domain is reduced by 20 %, while all the other domains weight increase by approximately 8%.
9
Table 4- Evolution of the weights of the four key domains of the IEF
Pillar IEF PCA Deviation (%)
Government size 0.2 0.218 +8.96
Market Openness 0.3 0.326 +8.70
Regulatory Efficiency 0.3 0.238 -20.56
Rule of Law 0.3 0.218 +8.83
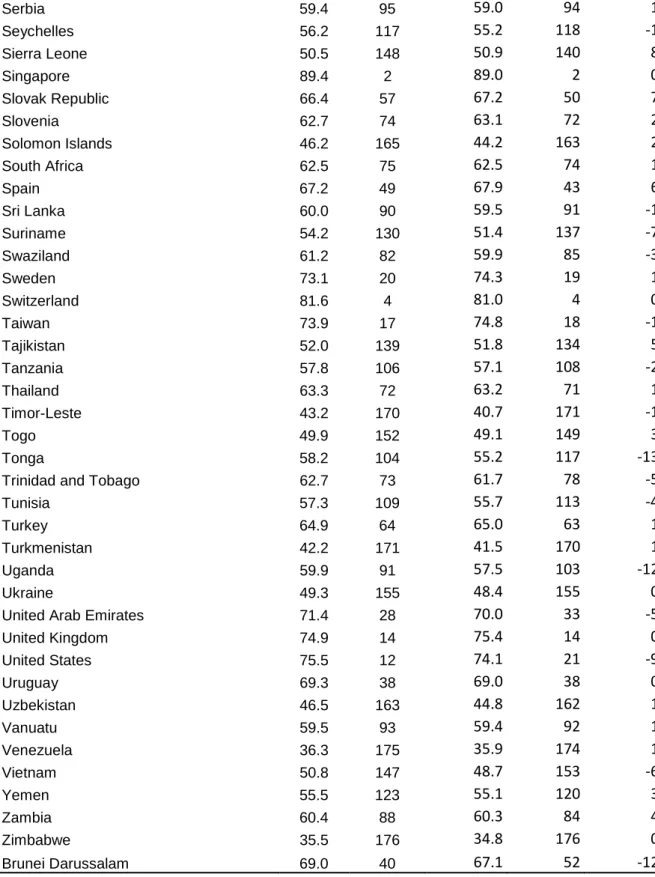
This result challenges the scores generated with the equal weighting method and consequently, the countries scorings and rankings. As one can note from Table 9, some important changes occur. At the extreme, the ranking of Morocco increases by 16, while the one of Tonga decreases by 9. The ranking of the US decreases by 9, moving from the 12th position to the 21st one. Indeed, as seen from Table 9 in the appendix, most of countries move from their initial positions (only 3% of countries retain their initial classification). The extent of the scores variation (compared to the baseline: equal weight) indicates that the equal weighting method adopted by the Heritage Foundation is a major methodological problem. Nevertheless, the positions of the first seven countries remain unchanged.
Table 5- Variation of the final ranking for some selected countries
Country Name IEF (2014) Ranking PCA Ranking Rank Variation
Honduras 112 96 +16 Brazil 114 106 +9 South Korea 31 23 +8 Finland 19 12 +7 Tonga 104 117 -13 United States 12 21 -9
10
3.2.
BOD approach
The Benefit of the Doubt (BOD) approach allows weighting that is endogenously determined by the data in such a way that they are country specific. Furthermore, by looking at the values of those weights, it is possible to discuss whether or not the country has placed priorities in some specific dimensions of the index. The BOD method is based on the Data Envelopment Analysis (DEA) technique (Nardo et al. 2005; OECD-JRC 2008; DREES 2011).
Formally, one needs to solve the following maximization problem:
1,., , , , { } 1 max s i i m m s s i s i w i CI w y = = =
∑
s.t. 1 , , , 1 0 1, 1,..., ..., m s i s i i s i w y s k m w i = ≤ ≥ = = ∑
% %with k the number of countries, and m the number of dimensions m=10 in the IEFcase.
Table 6- Components specific weights and associate scores for selected countries Country Name Property Rights Freedom from Corruption Fiscal Freedom Gov't Spending Business Freedom Labor Freedom Monetary Freedom Trade Freedom Investment Freedom Financial Freedom score Honduras 0.000 0.000 0.187 0.406 0.000 0.000 0.564 0.000 0.000 0.000 91 Brazil 0.000 0.000 0.126 0.010 0.000 0.000 0.975 0.000 0.000 0.082 82 South Korea 0.000 0.000 0.000 0.067 0.134 0.000 0.985 0.000 0.000 0.000 96 Finland 0.642 0.054 0.011 0.000 0.057 0.000 0.000 0.000 0.346 0.000 100 Tonga 0.000 0.000 0.386 0.000 0.000 0.672 0.000 0.000 0.000 0.000 95 United States 0.062 0.000 0.000 0.000 0.000 0.979 0.000 0.000 0.000 0.000 100 North Korea 0.000 1.000 0.000 0.000 0.000 0.000 0.000 0.000 0.000 0.000 5 China 0.000 0.000 0.000 0.781 0.000 0.005 0.348 0.000 0.000 0.000 91 France 0.000 0.000 0.000 0.000 0.000 0.000 0.000 1.000 0.000 0.000 92 Germany 0.706 0.000 0.000 0.000 0.064 0.000 0.000 0.000 0.335 0.000 99
11
Table 6Table 6 presents various kinds of countries. These include the much more open countries
such as the United States, and the protected ones like North Korea. The table shows that those heterogeneous countries have different policies according to their economy regulations. Furthermore, regulatory policies are different even within the same economic union. Indeed, if Germany focuses on several key variables (this diversification possibly explains its very high score of 99), France IEF is exclusively determined by only the trade freedom component. It is not surprising to notice the very low score for North Korea regarding its very little contact with the rest of the world. In the selected countries, only Finland’s index components can be consider as well-balanced (five of the components in Finland’s case received a weight different from zero), while the other countries have very specific priorities.
The complete results are presented in Table 10Table 11in the appendix. The first one gives the specific component weights generated for each country. According to the BOD approach, Table 10 shows that all countries have very various priorities in terms of economic freedom. Most of them consider trade freedom as the first priority in the set of economic freedom components and this is followed by fiscal freedom in second place. Only Singapore constitutes a particular case: while the others concentrate all their efforts on the other dimensions of the index than property rights, Singapore has concentrated all its efforts on property rights (the weight in this component equals 1 which implies that weights of the nine remaining components equal zero). It is also important to note that no country gives equal importance to the ten components of the index as was supposed by the Heritage Foundation.
Table 7- Equal, PCA and BOD weights variation
Equal PCA BOD3
Deviation (%) between PCA
and Equal
Deviation (%)between PCA and BOD
Deviation (%)between PCA and BOD PROPERTY RIGHTS 0.1 0.115 0.059 15 -41 48 FREEDOM FROM CORRUPTION 0.1 0.103 0.008 3 -92 92 FISCAL FREEDOM 0.1 0.124 0.160 23 60 -29 GOV_T SPENDING 0.1 0.095 0.190 -5 90 -100 BUSINESS FREEDOM 0.1 0.110 0.010 10 -89 90
12 LABOR FREEDOM 0.1 0.045 0.028 -55 -71 37 MONETARY FREEDOM 0.1 0.084 0.263 -16 164 -214 TRADE FREEDOM 0.1 0.094 0.254 -6 154 -170 INVESTMENT FREEDOM 0.1 0.113 0.024 13 -76 78 FINANCIAL FREEDOM 0 .1 0.119 0.059 19 -41 48
Results of Table 11 confirm that using the equal weighting method to generate countries scores in the case of the IEF is an inappropriate approach. The country specific approach (BOD) reveals that countries do not have the same policies in terms of economic freedom and so, components of this index must be weighted differently. Doing so, one can observe that the method favors certain countries (53% of countries) while 47% of them saw their scores decreased. The contrast of those results (weights variation between the three methods used in this paper are very important, see Table 7Table 7) reinforces the necessity to justify the methodological approach adopted by a coherent theoretical framework.
Conclusion
The aim of this paper was to highlight the methodological problem of the choice of equal weighting in the Index of Economic Freedom. The principal components analysis found broad agreement that there are two distinct latent components in the index suggesting different weights of the components. Using the PCA method, countries scores and rankings are dramatically changed as compared to the baseline. The Benefit Of the Doubt method used secondly confirms the necessity to adopt a country specific weighting method in the case of the IEF. The contrast of those results reinforces the necessity to justify the methodological approach adopted by a coherent theoretical framework. Using statistical tools such as PCA or adopting a country specific weighting method like BOD seem to be a more legitimate approach than the simple equal weighting method. In order to keep its legitimacy, the Heritage Foundation should adopt one of the approaches developed in this paper, as our results have questioned the annual publications of this institute.
13
References
Conseil de l’Europe. 2005. Elaboration concertée des indicateurs de la cohésion sociale: guide méthodologique. Council of Europe.
DREES. 2011. « Analyse critique du développement d’indicateurs composites : le cas de l’infarctus du myocarde après la phase aiguë ».
http://www.drees.sante.gouv.fr/analyse-critique-du- developpement-d-indicateurs-composites-le-cas-de-l-infarctus-du-myocarde-apres-la-phase-aigue,8500.html.
FAIR. 2011. « La richesse autrement, un « riche » hors série ». http://www.alternatives-economiques.fr/la-richesse-autrement_fr_pub_1071.html.
Heritage Foundation. 2014. « 2014 Index of Economic Freedom », Think Tank Edition. http://www.heritage.org/index/about.
Klugman, Jeni, Francisco Rodríguez, et Hyung-Jin Choi. 2011. « The HDI 2010: New Controversies, Old Critiques ». The Journal of Economic Inequality 9 (2): 249‑88. doi:10.1007/s10888-011-9178-z.
Nardo, Michela, Michaela Saisana, Andrea Saltelli, et Stefano Tarantola. 2005. « Tools for Composite Indicators Building ». In European Commission, EUR 21682 EN, Institute for the Protection and Security of the Citizen, JRC Ispra, Italy, 131.
OECD-JRC. 2008. Handbook on Constructing Composite Indicators: Methodology and User Guide. OECD Publishing.
http://www.keepeek.com/Digital-Asset- Management/oecd/economics/handbook-on-constructing-composite-indicators-methodology-and-user-guide_9789264043466-en#page1.
Saisana, Michaela, et Andrea Saltelli. 2010. Uncertainty and sensitivity analysis of the 2010 environmental performance index. OPOCE.
http://www.yale.edu/epi/files/2008EPI_SensitivityAnalysis.pdf.
Stiglitz, Joseph, Amartya Sen, et Jean-Paul Fitoussi. 2009. « Report of the Commission on the Measurement of Economic performance and Social Progress ». http://www.stiglitz-sen-fitoussi.fr/documents/rapport_anglais.pdf.
Tarantola, Stefano, et Daniel Vertesy. 2012. « Composite Indicators of Research Excellence ». EUR - Scientific and Technical Research Reports, Institute for the Protection and Security of the Citizen.
14
Appendix
Appendix 1: Evolution of the use of Cis for research purpose.
Figure 2 - Evolution of the number of research articles on “Composite Indicators” published in ScienceDirect between 2000 and 2015 (18/03) in all journals (left side) and in Economics, Econometrics and Finance journals
(right side)
Appendix 2: The eight other components of the IEF Rule of Law
Two components are used to assess this aspect: property rights and freedom from corruption. The properties rights are used to capture private accumulated property and its protection. The more effective protection of property is balanced with a higher score. The authors use a categorical scheme to allocate the scores within countries. The idea behind freedom of corruption is that corruption erodes economic freedom by introducing insecurity and uncertainty. It also reduces economic vitality by increasing costs and shifting resources into unproductive activities (Heritage Foundation, 2014). The score of this component derives from Transparency International’s Corruption Index (CPI) following this formula: ) =
(10 − )$*)
(10 − 95) × 100
- where 10 and 95 are respectively upper and lower bounds. According to 2012 review methodology, the higher value of CPI is to assign very little corruption. 0 50 100 150 200 250 300 350 2000 2001 2002 2003 2004 2005 2006 2007 2008 2009 2010 2011 2012 2013 2014 2015 0 10 20 30 40 50 60 70 80 90 2000 2001 2002 2003 2004 2005 2006 2007 2008 2009 2010 2011 2012 2013 2014 2015
15 Regulatory efficiency
Three components are used here: business freedom, labor freedom and monetary freedom. Business freedom captures the ease of starting, operating and closing a business using ten World Bank “doing business” indicators. Each index of the sub-indicator is scaled from zero to 100 using the following formula: = 50 × ./01.20⁄ where ./01.20 is the overall score of the 187 countries.
Labor freedom assesses the regulation of the country labor market such as the existence of minimum wage, laws inhibiting layoffs, severance requirements and measurable regulatory restraints on hiring and hours worked. The authors use the same formula as this described above.
= 50 × ./01.20⁄ where denotes the six following factors: ratio of
minimum wage to the average value added per worker, hindrance to hiring additional workers, rigidity of hours, difficulty of firing redundant employees, a legally mandated notice period, and mandatory severance pay. The labor freedom index is the simple average score of the six factors weighted equally.
The monetary freedom component combines price stability and price control. The authors assume that both inflation and price control distort market activity. Price stability without microeconomic intervention (on the country level) is the ideal state for a free market (Heritage Foundation, 2014). The monetary freedom index is constructed as follows:
4 5 = 100 − 67 8ℎ ./2. − $ 5:;⁄ with
7 8ℎ ./2. the inflation rates of the past three years taken on average;$ 5 ranging from zero to 20 where 20 is assigned as a severe penalty due to price control. The α parameter represents a coefficient that stabilizes the variance of scores. It is assumed to be 6.333.
Market openness
The remaining three components namely trade freedom, investment freedom and financial freedom are grouped in this last aspect. Trade freedom is the measure of the extent that tariffs
16
and non-tariffs impact goods and services trade. The trade freedom sub-indicator is normalized as follows:
< = =>(< ?.@− )
(< ?.@− ? A)
B C × 100 − D<E F where
D<E denotes Non-Tariff Barriers penalty ranges from zero to 20.
Both investment freedom and financial freedom components use a categorial scheme to assign countries scores. The investment freedom scheme ranges from 0 (no national treatment, prescreening or expropriation with no legal recourse) to 100 (most transfers approved with some restrictions or one or two sectors restricted). The same scheme is used to scale the financial freedom sub-indicator score with 0 if the government uses repression and 100 if there is negligible government interference.
Table 8: Country ranking assessment without fiscal freedom and
government spending components
Country score Rank
Rank variation Albania 62.6 67 -13 Algeria 47.1 138 8 Angola 41.7 161 -1 Argentina 41.5 163 3 Armenia 65.1 55 -14 Australia 86.7 5 -2 Austria 81.2 13 11 Azerbaijan 57.5 85 -4 Bahamas 64.5 59 -23 Bahrain 72.5 28 -15 Bangladesh 47.0 140 -9 Barbados 69.9 37 8 Belarus 43.9 153 -3 Belgium 79.9 15 20 Belize 51.4 121 -6 Benin 52.1 114 -1 Bhutan 53.4 105 11 Bolivia 41.8 160 -2
Bosnia and Herzegovina 59.2 76 25
Botswana 71.2 31 -4 Brazil 55.7 91 23 Bulgaria 62.7 65 -4 Burkina Faso 53.0 107 -9 Burma 36.1 170 -8 Burundi 48.6 131 10
17
Cambodia 49.3 129 -21
Cameroon 46.1 148 -12
Canada 84.3 7 -1
Cape Verde 64.4 60 0
Central African Republic 38.7 166 -5
Chad 39.9 165 2
Chile 78.4 18 -11
China 46.5 145 -8
Colombia 68.9 39 -5
Comoros 45.5 150 -8
Congo. Democratic Republic of the
Congo 32.8 171 1 Congo. Republic of 36.3 169 0 Costa Rica 62.4 68 -15 Côte d'Ivoire 52.3 113 -6 Croatia 61.1 71 16 Cuba 28.4 177 0 Cyprus 70.1 36 10 Czech Republic 74.6 23 3 Denmark 90.1 1 9 Djibouti 52.0 117 1 Dominica 64.7 58 5 Dominican Republic 54.6 93 -13 Ecuador 44.8 152 7 Egypt 46.7 142 -7 El Salvador 62.0 69 -10 Equatorial Guinea 38.2 167 1 Eritrea 32.7 172 2 Estonia 77.8 19 -8 Ethiopia 41.6 162 -11 Fiji 53.6 103 -4 Finland 82.5 11 8 France 72.6 27 43 Gabon 52.8 109 -4 Gambia 54.5 94 -2 Georgia 71.1 32 -10 Germany 79.4 16 2 Ghana 59.2 75 -9 Greece 59.0 78 41 Guatemala 54.8 92 -9 Guinea 47.5 136 -3 Guinea-Bissau 42.2 159 -16 Guyana 52.0 115 6 Haiti 42.8 156 0 Honduras 50.8 123 -11
Hong Kong SAR 89.8 2 -1
18 Iceland 77.3 20 3 India 49.9 126 -6 Indonesia 51.5 120 -20 Iran 29.5 173 0 Ireland 82.2 12 -3 Israel 73.0 25 19 Italy 66.0 51 35 Jamaica 65.1 56 0 Japan 75.9 22 3 Jordan 66.4 49 -10 Kazakhstan 57.4 87 -20 Kenya 52.3 112 -1 Kiribati 48.9 130 34 Korea. North 1.3 178 0 Korea. South 70.9 34 -3 Kuwait 58.7 81 -5 Kyrgyz Republic 57.0 88 -3 Lao P.D.R. 42.3 158 -14 Latvia 68.4 44 -2 Lebanon 53.6 101 -5 Lesotho 53.4 104 50 Liberia 46.3 146 -8 Lithuania 72.6 26 -5 Luxembourg 78.9 17 -1 Macau 68.7 41 -12 Macedonia 65.5 53 -10 Madagascar 54.3 97 -18 Malawi 51.6 119 5 Malaysia 67.0 47 -10 Maldives 46.2 147 -2 Mali 50.5 124 -2 Malta 69.2 38 20 Mauritania 46.8 141 -7 Mauritius 73.9 24 -16 Mexico 63.5 62 -7 Micronesia 50.1 125 28 Moldova 54.1 99 11 Mongolia 58.5 83 14 Montenegro 62.6 66 2 Morocco 56.0 90 13 Mozambique 51.2 122 6 Namibia 58.6 82 12 Nepal 40.7 164 -15 Netherlands 83.1 9 6 New Zealand 88.5 4 1 Nicaragua 53.2 106 -4
19 Niger 48.2 133 -6 Nigeria 48.0 134 -5 Norway 77.0 21 11 Oman 64.9 57 -9 Pakistan 47.8 135 -9 Panama 58.8 79 -8
Papua New Guinea 49.6 127 5
Paraguay 54.3 96 -18 Peru 63.3 64 -17 Philippines 53.6 100 -11 Poland 68.9 40 10 Portugal 68.5 43 26 Qatar 67.5 46 -16 Romania 63.6 61 1 Russia 46.5 144 -4 Rwanda 61.0 72 -7 Saint. Lucia 71.0 33 0
Saint. Vincent and the Grenadines 65.4 54 -2
Samoa 61.1 70 14
São Tomé and Príncipe 46.7 143 14
Saudi Arabia 57.4 86 -9 Senegal 51.7 118 7 Serbia 59.0 77 18 Seychelles 52.9 108 9 Sierra Leone 42.4 157 -9 Singapore 89.0 3 -1 Slovak Republic 66.0 52 5 Slovenia 68.2 45 29 Solomon Islands 47.4 137 28 South Africa 60.9 73 2 Spain 72.5 29 20 Sri Lanka 53.6 102 -12 Suriname 49.3 128 2 Swaziland 58.3 84 -2 Sweden 83.3 8 12 Switzerland 85.1 6 -2 Taiwan 71.8 30 -13 Tajikistan 43.6 154 -15 Tanzania 52.5 111 -5 Thailand 58.8 80 -8 Timor-Leste 46.0 149 21 Togo 43.4 155 -3 Tonga 52.5 110 -6
Trinidad and Tobago 60.0 74 -1
Tunisia 54.4 95 14
20
Turkmenistan 29.2 175 -4
Uganda 54.1 98 -7
Ukraine 47.1 139 16
United Arab Emirates 66.4 50 -22
United Kingdom 82.9 10 4 United States 80.1 14 -2 Uruguay 68.5 42 -4 Uzbekistan 38.0 168 -5 Vanuatu 52.0 116 -23 Venezuela 29.5 174 1 Vietnam 44.9 151 -4 Yemen 48.5 132 -9 Zambia 56.1 89 -1 Zimbabwe 28.5 176 0 Brunei Darussalam 66.8 48 -8
Table 9: scores and ranking variations between Equal and PCA weighting
Country Name 2014 Score Ranking score with PCA weighting New Ranking Rank variation Albania 66.9 54 67.8 45 9 Algeria 50.8 146 50.7 141 5 Angola 47.7 160 47.9 158 2 Argentina 44.6 166 43.8 164 2 Armenia 68.9 41 68.0 42 -1 Australia 82.0 3 82.3 3 0 Austria 72.4 24 72.0 26 -2 Azerbaijan 61.3 81 59.9 86 -5 Bahamas 69.8 36 69.2 36 0 Bahrain 75.1 13 75.1 17 -4
21 Bangladesh 54.1 131 53.4 129 2 Barbados 68.3 45 67.8 44 1 Belarus 50.1 150 48.4 156 -6 Belgium 69.9 35 69.7 34 1 Belize 56.7 115 55.6 115 0 Benin 57.1 113 56.8 111 2 Bhutan 56.7 116 54.8 124 -8 Bolivia 48.4 158 48.8 151 7
Bosnia and Herzegovina 58.4 101 58.1 100 1
Botswana 72.0 27 72.2 24 3 Brazil 56.9 114 57.1 106 8 Bulgaria 65.7 61 64.5 66 -5 Burkina Faso 58.9 98 58.4 98 0 Burma 46.5 162 43.4 167 -5 Burundi 51.4 141 50.2 143 -2 Cambodia 57.4 108 57.2 105 3 Cameroon 52.6 136 51.7 135 1 Canada 80.2 6 80.4 6 0 Cape Verde 66.1 60 67.1 53 7
22
Central African Republic 46.7 161 45.8 161 0
Chad 44.5 167 43.4 168 -1
Chile 78.7 7 79.1 7 0
China 52.5 137 50.5 142 -5
Colombia 70.7 34 70.0 32 2
Comoros 51.4 142 50.1 144 -2
Congo. Democratic Republic of the
Congo 40.6 172 39.5 172 0 Congo. Republic of 43.7 169 42.3 169 0 Costa Rica 66.9 53 67.1 54 -1 Côte d'Ivoire 57.7 107 56.9 109 -2 Croatia 60.4 87 61.3 80 7 Cuba 28.7 177 28.3 177 0 Cyprus 67.6 46 67.5 48 -2 Czech Republic 72.2 26 71.9 27 -1 Denmark 76.1 10 75.5 13 -3 Djibouti 55.9 118 55.1 121 -3 Dominica 65.2 63 64.2 68 -5 Dominican Republic 61.3 80 60.9 83 -3 Ecuador 48.0 159 47.4 159 0
23 Egypt 52.9 135 53.1 130 5 El Salvador 66.2 59 65.9 59 0 Equatorial Guinea 44.4 168 43.7 166 2 Eritrea 38.5 174 35.5 175 -1 Estonia 75.9 11 77.5 8 3 Ethiopia 50.0 151 48.8 152 -1 Fiji 58.7 99 57.3 104 -5 Finland 73.4 19 75.7 12 7 France 63.5 70 64.3 67 3 Gabon 57.8 105 56.9 110 -5 Gambia 59.5 92 58.7 95 -3 Georgia 72.6 22 71.3 30 -8 Germany 73.4 18 75.2 16 2 Ghana 64.2 66 64.6 65 1 Greece 55.7 119 55.6 114 5 Guatemala 61.2 83 61.0 82 1 Guinea 53.5 133 51.6 136 -3 Guinea-Bissau 51.3 143 49.8 147 -4 Guyana 55.7 121 53.6 128 -7
24
Haiti 48.9 156 46.8 160 -4
Honduras 57.1 112 58.6 96 16
Hong Kong SAR 90.1 1 90.1 1 0
Hungary 67.0 51 67.5 47 4 Iceland 72.4 23 73.4 22 1 India 55.7 120 54.0 126 -6 Indonesia 58.5 100 58.4 97 3 Iran 40.3 173 39.5 173 0 Ireland 76.2 9 76.3 10 -1 Israel 68.4 44 68.7 40 4 Italy 60.9 86 61.3 81 5 Jamaica 66.7 56 65.9 58 -2 Japan 72.4 25 71.5 29 -4 Jordan 69.2 39 69.0 37 2 Kazakhstan 63.7 67 61.8 77 -10 Kenya 57.1 111 56.1 112 -1 Kiribati 46.3 164 43.7 165 -1 Korea. North 1.0 178 1.1 178 0 Korea. South 71.2 31 72.7 23 8
25 Kuwait 62.3 76 62.3 75 1 Kyrgyz Republic 61.1 85 59.6 90 -5 Lao P.D.R. 51.2 144 49.9 146 -2 Latvia 68.7 42 68.5 41 1 Lebanon 59.4 96 59.1 93 3 Lesotho 49.5 154 48.6 154 0 Liberia 52.4 138 52.0 133 5 Lithuania 73.0 21 74.3 20 1 Luxembourg 74.2 16 76.2 11 5 Macau 71.3 29 71.7 28 1 Macedonia 68.6 43 67.6 46 -3 Madagascar 61.7 79 62.3 76 3 Malawi 55.4 124 54.9 123 1 Malaysia 69.6 37 68.8 39 -2 Maldives 51.0 145 49.9 145 0 Mali 55.5 122 54.0 127 -5 Malta 66.4 58 66.9 56 2 Mauritania 53.2 134 52.4 132 2 Mauritius 76.5 8 76.5 9 -1
26 Mexico 66.8 55 66.9 57 -2 Micronesia 49.8 153 48.1 157 -4 Moldova 57.3 110 58.2 99 11 Mongolia 58.9 97 57.6 101 -4 Montenegro 63.6 68 63.3 70 -2 Morocco 58.3 103 59.8 88 15 Mozambique 55.0 128 55.4 116 12 Namibia 59.4 94 57.1 107 -13 Nepal 50.1 149 49.4 148 1 Netherlands 74.2 15 75.3 15 0 New Zealand 81.2 5 80.9 5 0 Nicaragua 58.4 102 57.5 102 0 Niger 55.1 127 54.5 125 2 Nigeria 54.3 129 53.0 131 -2 Norway 70.9 32 72.1 25 7 Oman 67.4 48 67.1 51 -3 Pakistan 55.2 126 55.0 122 4 Panama 63.4 71 64.7 64 7
Papua New Guinea 53.9 132 51.3 138 -6
Paraguay 62.0 78 63.6 69 9 Peru 67.4 47 67.1 55 -8 Philippines 60.1 89 59.9 87 2 Poland 67.0 50 67.4 49 1 Portugal 63.5 69 65.1 62 7 Qatar 71.2 30 71.0 31 -1 Romania 65.5 62 65.3 61 1 Russia 51.9 140 51.0 139 1 Rwanda 64.7 65 62.8 73 -8 Saint. Lucia 70.7 33 69.4 35 -2
Saint. Vincent and the Grenadines 67.0 52 65.6 60 -8
Samoa 61.1 84 59.7 89 -5
São Tomé and Príncipe 48.8 157 48.9 150 7
Saudi Arabia 62.2 77 61.4 79 -2
27 Serbia 59.4 95 59.0 94 1 Seychelles 56.2 117 55.2 118 -1 Sierra Leone 50.5 148 50.9 140 8 Singapore 89.4 2 89.0 2 0 Slovak Republic 66.4 57 67.2 50 7 Slovenia 62.7 74 63.1 72 2 Solomon Islands 46.2 165 44.2 163 2 South Africa 62.5 75 62.5 74 1 Spain 67.2 49 67.9 43 6 Sri Lanka 60.0 90 59.5 91 -1 Suriname 54.2 130 51.4 137 -7 Swaziland 61.2 82 59.9 85 -3 Sweden 73.1 20 74.3 19 1 Switzerland 81.6 4 81.0 4 0 Taiwan 73.9 17 74.8 18 -1 Tajikistan 52.0 139 51.8 134 5 Tanzania 57.8 106 57.1 108 -2 Thailand 63.3 72 63.2 71 1 Timor-Leste 43.2 170 40.7 171 -1 Togo 49.9 152 49.1 149 3 Tonga 58.2 104 55.2 117 -13
Trinidad and Tobago 62.7 73 61.7 78 -5
Tunisia 57.3 109 55.7 113 -4
Turkey 64.9 64 65.0 63 1
Turkmenistan 42.2 171 41.5 170 1
Uganda 59.9 91 57.5 103 -12
Ukraine 49.3 155 48.4 155 0
United Arab Emirates 71.4 28 70.0 33 -5
United Kingdom 74.9 14 75.4 14 0 United States 75.5 12 74.1 21 -9 Uruguay 69.3 38 69.0 38 0 Uzbekistan 46.5 163 44.8 162 1 Vanuatu 59.5 93 59.4 92 1 Venezuela 36.3 175 35.9 174 1 Vietnam 50.8 147 48.7 153 -6 Yemen 55.5 123 55.1 120 3 Zambia 60.4 88 60.3 84 4 Zimbabwe 35.5 176 34.8 176 0 Brunei Darussalam 69.0 40 67.1 52 -12
Table 10: Country specific Weights generated by BOD
Country Name Property Rights Freedom from Corruption Fiscal Freedom Gov't Spending Business Freedom Labor Freedom Monetary Freedom Trade Freedom Investment Freedom Financial Freedom Albania 0.000 0.000 0.579 0.000 0.000 0.000 0.000 0.513 0.000 0.000
28 Algeria 0.000 0.000 0.758 0.000 0.215 0.000 0.101 0.000 0.000 0.000 Angola 0.000 0.000 0.908 0.000 0.000 0.000 0.000 0.113 0.005 0.000 Argentina 0.000 0.000 0.000 0.000 0.000 0.000 0.000 1.111 0.000 0.000 Armenia 0.000 0.000 0.000 0.000 0.000 0.000 0.000 1.111 0.000 0.000 Australia 0.533 0.275 0.000 0.055 0.000 0.000 0.000 0.000 0.000 0.272 Austria 0.729 0.000 0.000 0.000 0.000 0.033 0.000 0.000 0.347 0.000 Azerbaijan 0.000 0.000 0.208 0.000 0.000 0.000 0.910 0.000 0.067 0.000 Bahamas 0.098 0.000 0.817 0.107 0.000 0.041 0.000 0.000 0.000 0.019 Bahrain 0.000 0.000 0.684 0.000 0.000 0.000 0.000 0.372 0.032 0.000 Bangladesh 0.000 0.000 0.000 1.029 0.064 0.000 0.000 0.000 0.000 0.000 Barbados 0.061 0.089 0.221 0.000 0.000 0.000 0.812 0.000 0.000 0.000 Belarus 0.000 0.000 0.579 0.000 0.000 0.000 0.000 0.513 0.000 0.000 Belgium 0.000 0.000 0.000 0.000 0.000 0.000 0.000 1.111 0.000 0.000 Belize 0.000 0.000 0.025 0.074 0.091 0.000 1.001 0.000 0.000 0.000 Benin 0.000 0.000 0.000 0.774 0.000 0.000 0.351 0.000 0.010 0.000 Bhutan 0.000 0.000 0.698 0.000 0.000 0.368 0.000 0.000 0.000 0.000 Bolivia 0.000 0.000 0.579 0.000 0.000 0.000 0.000 0.513 0.000 0.000 Bosnia and Herzegovina 0.000 0.000 0.000 0.000 0.000 0.000 0.000 1.111 0.000 0.000 Botswana 0.000 0.000 0.000 0.000 0.000 0.000 0.000 1.111 0.000 0.000 Brazil 0.000 0.000 0.126 0.010 0.000 0.000 0.975 0.000 0.000 0.082 Bulgaria 0.000 0.000 0.579 0.000 0.000 0.000 0.000 0.513 0.000 0.000 Burkina Faso 0.000 0.000 0.187 0.406 0.000 0.000 0.564 0.000 0.000 0.000 Burma 0.000 0.000 0.073 0.989 0.000 0.032 0.000 0.000 0.000 0.000 Burundi 0.000 0.000 0.098 0.000 0.000 0.000 0.752 0.322 0.003 0.000 Cambodia 0.000 0.000 0.300 0.658 0.000 0.000 0.155 0.000 0.000 0.000 Cameroon 0.000 0.000 0.000 1.041 0.000 0.052 0.000 0.000 0.000 0.000 Canada 0.437 0.000 0.000 0.000 0.000 0.000 0.000 0.674 0.000 0.000 Cape Verde 0.033 0.000 0.157 0.007 0.000 0.000 0.952 0.000 0.041 0.000 Central African Republic 0.000 0.000 0.000 1.069 0.000 0.000 0.000 0.000 0.000 0.000 Chad 0.000 0.000 0.000 0.781 0.000 0.005 0.348 0.000 0.000 0.000 Chile 0.800 0.000 0.000 0.088 0.000 0.000 0.245 0.000 0.000 0.000 China 0.000 0.000 0.000 0.781 0.000 0.005 0.348 0.000 0.000 0.000 Colombia 0.000 0.000 0.000 0.085 0.098 0.000 1.008 0.000 0.000 0.000 Comoros 0.000 0.000 0.000 0.781 0.000 0.005 0.348 0.000 0.000 0.000 Congo. Democratic Republic of the Congo 0.000 0.000 0.076 0.818 0.000 0.000 0.227 0.000 0.000 0.000 Congo. Republic of 0.000 0.000 0.000 0.781 0.000 0.005 0.348 0.000 0.000 0.000 Costa Rica 0.039 0.000 0.000 1.058 0.000 0.000 0.000 0.000 0.000 0.000 Côte d'Ivoire 0.000 0.000 0.009 0.093 0.017 0.000 0.894 0.177 0.000 0.000 Croatia 0.000 0.000 0.000 0.000 0.000 0.000 0.000 1.111 0.000 0.000 Cuba 0.000 0.000 0.093 0.000 0.000 0.000 0.983 0.092 0.000 0.000 Cyprus 0.000 0.000 0.096 0.000 0.002 0.000 0.743 0.334 0.000 0.000
29 Czech Republic 0.000 0.000 0.000 0.000 0.000 0.000 0.000 1.111 0.000 0.000 Denmark 0.000 0.000 0.000 0.000 0.000 0.000 0.000 0.000 0.000 1.111 Djibouti 0.000 0.000 0.208 0.000 0.000 0.000 0.910 0.000 0.067 0.000 Dominica 0.000 0.000 0.000 0.085 0.098 0.000 1.008 0.000 0.000 0.000 Dominican Republic 0.000 0.000 0.027 0.976 0.000 0.000 0.000 0.000 0.101 0.000 Ecuador 0.000 0.000 0.579 0.000 0.000 0.000 0.000 0.513 0.000 0.000 Egypt 0.000 0.000 0.684 0.000 0.000 0.000 0.000 0.372 0.032 0.000 El Salvador 0.000 0.000 0.000 0.570 0.000 0.000 0.538 0.000 0.000 0.053 Equatorial Guinea 0.000 0.000 0.162 0.000 0.000 0.000 0.991 0.000 0.000 0.000 Eritrea 0.000 0.000 0.000 0.000 0.000 0.000 0.000 1.111 0.000 0.000 Estonia 0.777 0.000 0.047 0.000 0.000 0.000 0.000 0.000 0.285 0.000 Ethiopia 0.000 0.000 0.000 1.041 0.000 0.052 0.000 0.000 0.000 0.000 Fiji 0.000 0.000 0.000 0.089 0.000 0.115 0.979 0.000 0.009 0.000 Finland 0.642 0.054 0.011 0.000 0.057 0.000 0.000 0.000 0.346 0.000 France 0.000 0.000 0.000 0.000 0.000 0.000 0.000 1.111 0.000 0.000 Gabon 0.000 0.000 0.000 0.781 0.000 0.005 0.348 0.000 0.000 0.000 Gambia 0.000 0.000 0.018 0.770 0.000 0.000 0.346 0.000 0.000 0.000 Georgia 0.000 0.000 0.000 0.000 0.000 0.000 0.000 1.111 0.000 0.000 Germany 0.706 0.000 0.000 0.000 0.064 0.000 0.000 0.000 0.335 0.000 Ghana 0.000 0.000 0.366 0.701 0.000 0.000 0.000 0.000 0.032 0.000 Greece 0.000 0.000 0.000 0.000 0.000 0.000 0.000 1.111 0.000 0.000 Guatemala 0.000 0.000 0.000 1.069 0.000 0.000 0.000 0.000 0.000 0.000 Guinea 0.000 0.000 0.000 1.041 0.000 0.052 0.000 0.000 0.000 0.000 Guinea-Bissau 0.000 0.000 0.420 0.556 0.000 0.012 0.121 0.000 0.000 0.000 Guyana 0.000 0.000 0.000 0.074 0.000 0.112 0.999 0.000 0.004 0.000 Haiti 0.000 0.000 0.147 0.000 0.000 0.000 0.923 0.066 0.052 0.000 Honduras 0.000 0.000 0.187 0.406 0.000 0.000 0.564 0.000 0.000 0.000 Hong Kong SAR 1.013 0.000 0.000 0.086 0.000 0.000 0.000 0.000 0.000 0.013 Hungary 0.000 0.000 0.000 0.000 0.000 0.000 0.000 1.111 0.000 0.000 Iceland 0.437 0.000 0.000 0.000 0.000 0.000 0.000 0.674 0.000 0.000 India 0.000 0.000 0.484 0.566 0.000 0.045 0.000 0.000 0.000 0.000 Indonesia 0.000 0.000 0.109 0.958 0.000 0.000 0.000 0.000 0.000 0.034 Iran 0.000 0.000 0.092 0.970 0.032 0.000 0.000 0.000 0.000 0.000 Ireland 0.328 0.000 0.000 0.000 0.000 0.000 0.408 0.108 0.303 0.000 Israel 0.000 0.000 0.000 0.000 0.000 0.000 0.961 0.005 0.208 0.000 Italy 0.000 0.000 0.000 0.000 0.000 0.000 0.000 1.111 0.000 0.000 Jamaica 0.000 0.000 0.000 0.000 0.040 0.000 0.557 0.000 0.560 0.000 Japan 0.032 0.044 0.039 0.084 0.017 0.000 0.983 0.000 0.000 0.000 Jordan 0.000 0.000 0.485 0.000 0.000 0.000 0.576 0.000 0.085 0.000 Kazakhstan 0.000 0.000 0.564 0.483 0.000 0.043 0.000 0.000 0.000 0.000 Kenya 0.000 0.000 0.027 0.087 0.000 0.000 0.874 0.193 0.007 0.000 Kiribati 0.000 0.000 0.084 0.000 0.000 0.096 0.989 0.000 0.000 0.000 Korea. North 0.000 1.063 0.000 0.000 0.000 0.000 0.000 0.000 0.000 0.000 Korea. South 0.000 0.000 0.000 0.067 0.134 0.000 0.985 0.000 0.000 0.000
30 Kuwait 0.000 0.000 1.001 0.000 0.000 0.000 0.000 0.000 0.000 0.000 Kyrgyz Republic 0.000 0.000 0.705 0.000 0.000 0.357 0.000 0.000 0.003 0.000 Lao P.D.R. 0.000 0.000 0.300 0.658 0.000 0.000 0.155 0.000 0.000 0.000 Latvia 0.000 0.000 0.000 0.000 0.000 0.000 0.000 1.111 0.000 0.000 Lebanon 0.000 0.000 0.737 0.131 0.000 0.000 0.000 0.169 0.050 0.000 Lesotho 0.000 0.000 0.093 0.000 0.000 0.000 0.983 0.092 0.000 0.000 Liberia 0.000 0.000 0.208 0.000 0.000 0.000 0.910 0.000 0.067 0.000 Lithuania 0.000 0.000 0.579 0.000 0.000 0.000 0.000 0.513 0.000 0.000 Luxembourg 0.834 0.000 0.000 0.029 0.000 0.000 0.000 0.000 0.248 0.000 Macau 0.000 0.000 0.020 0.744 0.000 0.000 0.000 0.337 0.000 0.000 Macedonia 0.000 0.000 0.097 0.000 0.000 0.000 0.738 0.339 0.000 0.000 Madagascar 0.000 0.000 0.076 0.818 0.000 0.000 0.227 0.000 0.000 0.000 Malawi 0.000 0.000 0.579 0.000 0.000 0.000 0.000 0.513 0.000 0.000 Malaysia 0.000 0.000 0.025 0.074 0.091 0.000 1.001 0.000 0.000 0.000 Maldives 0.000 0.000 0.800 0.000 0.220 0.040 0.000 0.000 0.000 0.000 Mali 0.000 0.000 0.000 0.381 0.000 0.000 0.647 0.140 0.000 0.000 Malta 0.000 0.000 0.000 0.000 0.000 0.000 0.000 1.111 0.000 0.000 Mauritania 0.000 0.000 0.208 0.000 0.000 0.000 0.910 0.000 0.067 0.000 Mauritius 0.000 0.000 0.579 0.000 0.000 0.000 0.000 0.513 0.000 0.000 Mexico 0.000 0.000 0.000 0.000 0.000 0.000 0.000 1.111 0.000 0.000 Micronesia 0.000 0.000 0.579 0.000 0.000 0.000 0.000 0.513 0.000 0.000 Moldova 0.000 0.000 0.579 0.000 0.000 0.000 0.000 0.513 0.000 0.000 Mongolia 0.000 0.000 0.108 0.000 0.000 0.227 0.833 0.000 0.000 0.000 Montenegro 0.000 0.000 0.684 0.000 0.000 0.000 0.000 0.372 0.032 0.000 Morocco 0.000 0.000 0.000 0.085 0.098 0.000 1.008 0.000 0.000 0.000 Mozambique 0.000 0.000 0.061 0.024 0.000 0.000 0.953 0.119 0.000 0.028 Namibia 0.000 0.000 0.000 0.000 0.000 0.000 0.000 1.111 0.000 0.000 Nepal 0.000 0.000 0.076 0.818 0.000 0.000 0.227 0.000 0.000 0.000 Netherlands 0.419 0.086 0.000 0.000 0.000 0.000 0.000 0.450 0.164 0.000 New Zealand 0.741 0.000 0.000 0.000 0.000 0.000 0.000 0.000 0.247 0.123 Nicaragua 0.000 0.000 0.000 0.000 0.000 0.000 0.000 1.111 0.000 0.000 Niger 0.000 0.000 0.000 0.784 0.000 0.000 0.347 0.000 0.000 0.000 Nigeria 0.000 0.000 0.253 0.432 0.000 0.000 0.460 0.000 0.000 0.000 Norway 0.437 0.000 0.000 0.000 0.000 0.000 0.000 0.674 0.000 0.000 Oman 0.000 0.000 0.684 0.000 0.000 0.000 0.000 0.372 0.032 0.000 Pakistan 0.000 0.000 0.092 0.970 0.032 0.000 0.000 0.000 0.000 0.000 Panama 0.000 0.000 0.208 0.000 0.000 0.000 0.910 0.000 0.067 0.000 Papua New Guinea 0.000 0.000 0.000 0.000 0.000 0.000 0.000 1.111 0.000 0.000 Paraguay 0.000 0.000 0.418 0.579 0.021 0.000 0.088 0.000 0.000 0.000 Peru 0.000 0.000 0.000 0.381 0.000 0.000 0.647 0.140 0.000 0.000 Philippines 0.000 0.000 0.000 0.776 0.005 0.000 0.354 0.000 0.000 0.000 Poland 0.000 0.000 0.000 0.000 0.000 0.000 0.000 1.111 0.000 0.000 Portugal 0.000 0.000 0.000 0.000 0.000 0.000 0.000 1.111 0.000 0.000 Qatar 0.030 0.000 0.712 0.000 0.000 0.000 0.000 0.322 0.023 0.000 Romania 0.000 0.000 0.000 0.000 0.000 0.000 0.000 1.111 0.000 0.000
31 Russia 0.000 0.000 0.579 0.000 0.000 0.000 0.000 0.513 0.000 0.000 Rwanda 0.000 0.000 0.000 0.073 0.000 0.157 0.957 0.000 0.000 0.000 Saint. Lucia 0.000 0.000 0.015 0.049 0.004 0.167 0.948 0.000 0.000 0.000 Saint. Vincent and the Grenadines 0.014 0.000 0.000 0.085 0.019 0.082 0.993 0.000 0.000 0.000 Samoa 0.000 0.000 0.108 0.000 0.000 0.227 0.833 0.000 0.000 0.000 São Tomé and Príncipe 0.000 0.000 0.684 0.000 0.000 0.000 0.000 0.372 0.032 0.000 Saudi Arabia 0.000 0.000 1.000 0.000 0.000 0.001 0.000 0.000 0.000 0.000 Senegal 0.000 0.000 0.000 0.096 0.000 0.000 0.885 0.204 0.000 0.000 Serbia 0.000 0.000 0.684 0.000 0.000 0.000 0.000 0.372 0.032 0.000 Seychelles 0.000 0.000 0.159 0.000 0.025 0.000 0.951 0.000 0.052 0.000 Sierra Leone 0.000 0.000 0.135 0.931 0.000 0.000 0.000 0.000 0.033 0.000 Singapore 1.023 0.000 0.000 0.087 0.000 0.000 0.000 0.000 0.000 0.000 Slovak Republic 0.000 0.000 0.000 0.000 0.000 0.000 0.000 1.111 0.000 0.000 Slovenia 0.000 0.000 0.000 0.000 0.000 0.000 0.000 1.111 0.000 0.000 Solomon Islands 0.000 0.000 0.083 0.000 0.000 0.000 0.886 0.203 0.000 0.000 South Africa 0.000 0.000 0.000 0.079 0.047 0.000 0.946 0.119 0.000 0.000 Spain 0.000 0.000 0.000 0.000 0.000 0.000 0.000 1.111 0.000 0.000 Sri Lanka 0.000 0.000 0.092 0.970 0.032 0.000 0.000 0.000 0.000 0.000 Suriname 0.000 0.000 0.000 0.145 0.000 0.113 0.929 0.000 0.000 0.000 Swaziland 0.000 0.000 0.000 0.000 0.000 0.000 0.000 1.111 0.000 0.000 Sweden 0.405 0.003 0.000 0.000 0.025 0.000 0.356 0.000 0.351 0.000 Switzerland 0.428 0.021 0.000 0.080 0.000 0.000 0.569 0.065 0.000 0.000 Taiwan 0.000 0.000 0.000 0.085 0.098 0.000 1.008 0.000 0.000 0.000 Tajikistan 0.000 0.000 0.731 0.327 0.000 0.000 0.000 0.000 0.000 0.000 Tanzania 0.000 0.000 0.391 0.482 0.000 0.000 0.000 0.227 0.000 0.000 Thailand 0.000 0.000 0.000 1.025 0.000 0.000 0.000 0.000 0.000 0.081 Timor-Leste 0.000 0.000 0.000 0.000 0.000 0.491 0.646 0.000 0.000 0.000 Togo 0.000 0.000 0.000 0.776 0.005 0.000 0.354 0.000 0.000 0.000 Tonga 0.000 0.000 0.386 0.000 0.000 0.672 0.000 0.000 0.000 0.000 Trinidad and Tobago 0.000 0.000 0.579 0.000 0.000 0.000 0.000 0.513 0.000 0.000 Tunisia 0.000 0.000 0.025 0.074 0.091 0.000 1.001 0.000 0.000 0.000 Turkey 0.000 0.000 0.000 0.000 0.000 0.000 0.000 1.111 0.000 0.000 Turkmenistan 0.000 0.000 0.442 0.608 0.043 0.000 0.000 0.000 0.000 0.000 Uganda 0.000 0.000 0.000 1.041 0.000 0.052 0.000 0.000 0.000 0.000 Ukraine 0.000 0.000 0.000 0.000 0.000 0.000 0.000 1.111 0.000 0.000 United Arab Emirates 0.000 0.000 0.035 0.044 0.000 0.000 0.929 0.172 0.000 0.000 United Kingdom 0.706 0.000 0.000 0.000 0.064 0.000 0.000 0.000 0.335 0.000 United States 0.062 0.000 0.000 0.000 0.000 0.979 0.000 0.000 0.000 0.000 Uruguay 0.000 0.000 0.000 0.000 0.000 0.000 0.000 1.111 0.000 0.000 Uzbekistan 0.000 0.000 0.808 0.052 0.204 0.000 0.000 0.000 0.000 0.000 Vanuatu 0.000 0.000 0.485 0.000 0.000 0.000 0.576 0.000 0.085 0.000
32 Venezuela 0.000 0.000 0.579 0.000 0.000 0.000 0.000 0.513 0.000 0.000 Vietnam 0.000 0.000 0.000 0.000 0.000 0.000 0.000 1.111 0.000 0.000 Yemen 0.000 0.000 0.579 0.000 0.000 0.000 0.000 0.513 0.000 0.000 Zambia 0.000 0.000 0.000 0.000 0.000 0.000 0.000 1.111 0.000 0.000 Zimbabwe 0.000 0.000 0.104 0.000 0.037 0.000 1.027 0.000 0.000 0.000 Brunei Darussalam 0.000 0.000 0.025 0.000 0.000 1.012 0.000 0.000 0.000 0.000
Table 11: Country specific scores generated by BOD
Country Name score with BOD weighting Ranking with BOD Ranking Variation Albania 99 34 20 Algeria 82 169 -23 Angola 88 146 14 Argentina 77 174 -8 Armenia 95 81 -40 Australia 100 1 2 Austria 100 1 23 Azerbaijan 94 92 -11 Bahamas 100 1 35 Bahrain 100 1 12 Bangladesh 99 34 97 Barbados 89 139 -94 Belarus 93 106 44 Belgium 98 48 -13 Belize 92 112 3 Benin 94 92 21 Bhutan 89 139 -23 Bolivia 90 134 24
Bosnia and Herzegovina 97 66 35
Botswana 92 112 -85 Brazil 82 169 -55 Bulgaria 98 48 13 Burkina Faso 93 106 -8 Burma 97 66 96 Burundi 82 169 -28 Cambodia 98 48 60 Cameroon 92 112 24 Canada 99 34 -28 Cape Verde 93 106 -46
Central African Republic 99 34 127
Chad 87 151 16
Chile 100 1 6
33
Colombia 94 92 -58
Comoros 93 106 36
Congo, Democratic Republic of the
Congo 81 173 -1 Congo, Republic of 87 151 18 Costa Rica 97 66 -13 Côte d'Ivoire 94 92 15 Croatia 97 66 21 Cuba 76 176 1 Cyprus 94 92 -46 Czech Republic 98 48 -22 Denmark 100 1 9 Djibouti 91 126 -8 Dominica 99 34 29 Dominican Republic 100 1 79 Ecuador 83 166 -7 Egypt 87 151 -16 El Salvador 96 75 -16 Equatorial Guinea 87 151 17 Eritrea 77 174 0 Estonia 99 34 -23 Ethiopia 96 75 76 Fiji 89 139 -40 Finland 100 1 18 France 92 112 -42 Gabon 90 134 -29 Gambia 87 151 -59 Georgia 98 48 -26 Germany 99 34 -16 Ghana 92 112 -46 Greece 92 112 7 Guatemala 100 1 82 Guinea 94 92 41 Guinea-Bissau 95 81 62 Guyana 92 112 9 Haiti 87 151 5 Honduras 91 126 -14
Hong Kong SAR 100 1 0
Hungary 98 48 3 Iceland 99 34 -11 India 86 163 -43 Indonesia 97 66 34 Iran 93 106 67 Ireland 100 1 8 Israel 94 92 -48 Italy 98 48 38 Jamaica 94 92 -36
34 Japan 100 1 24 Jordan 98 48 -9 Kazakhstan 97 66 1 Kenya 88 146 -35 Kiribati 94 92 72 Korea, North 5 178 0 Korea, South 96 75 -44 Kuwait 98 48 28 Kyrgyz Republic 97 66 19 Lao P.D.R. 95 81 63 Latvia 98 48 -6 Lebanon 92 112 -16 Lesotho 87 151 3 Liberia 86 163 -25 Lithuania 99 34 -13 Luxembourg 100 1 15 Macau 100 1 28 Macedonia 100 1 42 Madagascar 100 1 78 Malawi 82 169 -45 Malaysia 96 75 -38 Maldives 100 1 144 Mali 91 126 -4 Malta 98 48 10 Mauritania 89 139 -5 Mauritius 99 34 -26 Mexico 95 81 -26 Micronesia 98 48 105 Moldova 91 126 -16 Mongolia 87 151 -54 Montenegro 96 75 -7 Morocco 92 112 -9 Mozambique 94 92 36 Namibia 92 112 -18 Nepal 97 66 83 Netherlands 100 1 14 New Zealand 100 1 4 Nicaragua 95 81 21 Niger 100 1 126 Nigeria 87 151 -22 Norway 99 34 -2 Oman 99 34 14 Pakistan 95 81 45 Panama 91 126 -55
Papua New Guinea 95 81 51
35 Peru 100 1 46 Philippines 99 34 55 Poland 98 48 2 Portugal 98 48 21 Qatar 100 1 29 Romania 98 48 14 Russia 88 146 -6 Rwanda 90 134 -69 Saint. Lucia 97 66 -33
Saint. Vincent and the Grenadines 94 92 -40
Samoa 90 134 -50
São Tomé and Príncipe 89 139 18
Saudi Arabia 100 1 76 Senegal 95 81 44 Serbia 88 146 -51 Seychelles 88 146 -29 Sierra Leone 92 112 36 Singapore 100 1 1 Slovak Republic 98 48 9 Slovenia 98 48 26 Solomon Islands 87 151 14 South Africa 89 139 -64 Spain 98 48 1 Sri Lanka 94 92 -2 Suriname 87 151 -21 Swaziland 91 126 -44 Sweden 100 1 19 Switzerland 100 1 3 Taiwan 99 34 -17 Tajikistan 93 106 33 Tanzania 86 163 -57 Thailand 91 126 -54 Timor-Leste 83 166 4 Togo 92 112 40 Tonga 95 81 23
Trinidad and Tobago 89 139 -66
Tunisia 90 134 -25
Turkey 94 92 -28
Turkmenistan 100 1 170
Uganda 95 81 10
Ukraine 96 75 80
United Arab Emirates 100 1 27
United Kingdom 100 1 13
United States 100 1 11
Uruguay 92 112 -74
36 Vanuatu 100 1 92 Venezuela 76 176 -1 Vietnam 87 151 -4 Yemen 95 81 42 Zambia 94 92 -4 Zimbabwe 83 166 10 Brunei Darussalam 100 1 39