HAL Id: hal-03000546
https://hal.archives-ouvertes.fr/hal-03000546
Preprint submitted on 12 Nov 2020HAL is a multi-disciplinary open access
archive for the deposit and dissemination of sci-entific research documents, whether they are pub-lished or not. The documents may come from teaching and research institutions in France or abroad, or from public or private research centers.
L’archive ouverte pluridisciplinaire HAL, est destinée au dépôt et à la diffusion de documents scientifiques de niveau recherche, publiés ou non, émanant des établissements d’enseignement et de recherche français ou étrangers, des laboratoires publics ou privés.
In Situ Electron Paramagnetic Resonance Correlated
Spectroscopy and Imaging: A Tool for Lithium-Ion
Batteries to Investigate Metallic Lithium
Sub-Micrometric Structures Created by Plating and
Stripping
Charles Emmanuel Dutoit, Mingxue Tang, Gourier Didier, Jean-marie
Tarascon, Hervé Vezin, Elodie Salager
To cite this version:
Charles Emmanuel Dutoit, Mingxue Tang, Gourier Didier, Jean-marie Tarascon, Hervé Vezin, et al.. In Situ Electron Paramagnetic Resonance Correlated Spectroscopy and Imaging: A Tool for Lithium-Ion Batteries to Investigate Metallic Lithium Sub-Micrometric Structures Created by Plating and Stripping. 2020. �hal-03000546�
In situ electron paramagnetic resonance correlated
spec-troscopy and imaging: a tool for lithium-ion batteries
to investigate metallic lithium sub-micrometric structures
created by plating and stripping
Charles-Emmanuel Dutoit1,2,∗†, Mingxue Tang1,2‡, Didier Gourier3, Jean-Marie Tarascon2,4, Herv´e Vezin5,∗& Elodie Salager1,2
1CNRS, CEMHTI UPR3079, Universit´e d’Orl´eans, 45071 Orl´eans, France
2R´eseau sur le Stockage Electrochimique de l’Energie (RS2E), FR CNRS 3459, France
3Chimie-ParisTech, PSL Universit´e, CNRS, Institut de Recherche de Chimie-Paris (IRCP), 75005
Paris, France
4Coll`ege de France, CNRS FRE3357, 75005 Paris, France
5Universit´e Lille Nord de France, CNRS UMR8516, LASIR, 59655 Villeneuve d’Ascq, France
Monitoring the formation of dendrites or filaments of lithium is of paramount importance 1
for Li-based battery technologies, hence the intense activities in designing in situ techniques 2
to visualize their growth. Herein we report the benefit of correlating in situ electron para-3
magnetic resonance (EPR) spectroscopy and EPR imaging to analyze the morphology and 4
location of metallic lithium in a symmetric Li/LiPF6/Li electrochemical cell during
polariza-5
tion. We exploit the variations in shape, resonance field and amplitude of the EPR spectra 6
to follow, operando, the nucleation of sub-micrometric Li particles (narrow and symmetrical 7
†Present address: Chimie-ParisTech, PSL Universit´e, CNRS, Institut de Recherche de Chimie-Paris (IRCP), Paris,
France
signal) that conjointly occurs with the fragmentation of bulk Li on the opposite electrode 8
(asymmetrical signal). Moreover, in situ EPR correlated spectroscopy and imaging (spectral-9
spatial EPR imaging) allows the identification (spectral) and localization (spatial) of the sub-10
micrometric Li particles created by plating (deposition) or stripping (altered bulk Li surface). 11
We finally demonstrate the possibility to visualize, via in situ EPR imaging, dendrites formed 12
through the separator in the whole cell. Such a technique could be of great help in mastering 13
the Li-electrolyte interface issues that plague the development of solid-state batteries. 14
Introduction 15
Rechargeable lithium-ion batteries (LIBs) are recognized for the good balance between weight, 16
volume and electrochemical performance. Despite the wide range of applications for LIBs, pre-17
vention of non-uniform deposition of metallic lithium is still of paramount importance to avoid in-18
ternal short-circuits and thermal runaway. Formation of lithium dendrites on the negative graphitic 19
electrode is an issue in mature LIBs that prevents faster charge, essential for the development 20
of transport electrification,1, 2 while lithium filament growth hinders the spread of all-solid-state
21
batteries.3, 4 22
Metallic lithium deposition in batteries is still relatively hard to predict, and the visualization, 23
in real time, of its location, morphology and growth is the subject of intense development for many 24
techniques.5 A precious feature of Electron Paramagnetic Resonance (EPR) is the combination
25
of imaging and spectroscopy, unexplored to date for the characterization of lithium deposition in 26
batteries. In 2015 in situ EPR was demonstrated as a tool of choice to detect Li deposits, either 27
by imaging6 or spectroscopy.7 In continuation of the latter an extensive study by operando EPR 28
spectroscopy was performed for Li plating on graphite.8 Niem¨oller et al. also studied, ex situ, the
29
potential and limitations of ex situ EPR imaging (EPRI) on metallic Li9.
30
In this paper, we report the combination of in situ X-band EPR spectroscopy and imaging 31
to observe directly, in situ, the morphology and the distribution of metallic lithium in a symmetric 32
Li/LiPF6/Li electrochemical cell. We observe the roughening of the lithium surface upon
strip-33
ping, the spatially inhomegeneous electrodeposition of the sub-micrometric lithium particles and 34
dendrite growth causing a short-circuit. 35
Results and discussion 36
Figure 1a shows a schematic representation of the Li/LiPF6/Li electrochemical cell placed in the
37
EPR resonator, with the static magnetic field H oriented along the Z axis and the microwave field 38
along the Y axis. The magnetic field gradients, used for imaging, are oriented along the Y and 39
Z axes. This configuration is optimized to study lithium exchange between the two electrodes 40
and especially dendritic growth. The EPR spectrum of the assembled electrochemical cell in the 41
pristine state, before applying the current flow, is shown in fig. 1c. It is identical to the spectrum 42
of a metallic lithium disk (fig. 1b), as expected. The resonance field and therefore the measured g 43
factor ( g=2.0030, close to the free electron spin g=2.0023) is characteristic of metallic lithium. 44
Previous EPR investigations showed that the lineshape, linewidth and intensity were highly 45
dependent on the morphology of metallic lithium. 6, 7, 9The EPR spectrum lineshape of a metallic
A B H Separator I>0 Pristine T=300K A/B~5 348.5 349 349.5 Magnetic field (mT)
metallic lithium disk
f=9.79GHz Z Y (a) (b) (d) EPR i n te n si ty (a .u ) T=300K f=9.79GHz End of polarization 2 348.9 349 349.1 349.2 349.3 349.4 Magnetic field (mT) Exp. Li(1)+Li(2) Li(1) Li(2) T=300K f=9.79GHz (c) 348.9 349 349.1 349.2 349.3 349.4 Magnetic field (mT) EPR i n te n si ty (a .u ) EPR i n te n si ty (a .u ) Pristine state End of polarization 1 End of polarization 2 Li disk (Lib) Li disk (Lit)
Figure 1: (Colour online) Operando EPR spectroscopy recorded at 9.79 GHz. (a) Schematic representation of the EPR electrochemical cell and its orientation in the external magnetic field H. Y and Z are the magnetic field gradient directions for imaging. (b) cw-EPR spectrum of a pristine metallic lithium disk (no cycling). A and B denote the amplitude of the positive and negative parts
of the EPR line respectively. (c) Selection of operando cw-EPR spectra of the Li/LiPF6/Li cell. A
symmetrical and sharp EPR line appears in the low magnetic field flank of the bulk signal upon polarization. (d) Experimental (black dots) and simulated (red line) EPR spectra at the end of polarization 2. The dysonian component of the simulation Li(1) is assigned to the bulk Li signal of both electrodes and the lorentzian component Li(2) to the newly formed sub-micrometric Li particles.
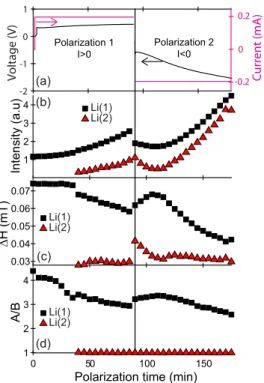
(a) (b) (d) Polarization 1 I>0 Polarization 2 I<0 0 50 100 150
Polarization time (min) 1 2 3 4 A/ B 0.03 0.04 0.05 0.06 0.07 ∆ H (mT ) 1 2 3 4 In te n si ty (a .u ) Li(1) Li(2) Li(1) Li(2) Li(1) Li(2) -2 -1 0 1 Volta ge (V) (c) -0.2 0 0.2 C urren t (mA)
Figure 2: (Colour online) Evolution of the cw-EPR parameters versus polarization time for the two components, Li(1) (bulk Li) and Li(2) (micrometric particles). (a) Voltage (left) and current (right) of the electrochemical cell, (b) EPR spectrum intensity, (c) linewidth ∆H and (d) asymmetry ratio A/B.
conductor is indeed controlled by the limited penetration depth δmw of the microwave field in the
47
metal, known as the skin effect: 10
48
δmw ∝
r ρ
f (1)
ρ being the metal resistivity and f the microwave frequency. 49
More precisely the EPR spectrum lineshape depends on the metal thickness d compared 50
to δmw. If d > δmw, only the spins located inside the skin depth are excited by the microwave
51
field. During the spin coherence time T2, each electron travels on a distance of the order of
52
δef f ≈ (DeT2)
1
2 where Deis the diffusion coefficient of electrons.10, 11 As δef f ≈ 60µm in metal-53
lic lithium,9 the electrons penetrate several times in the skin region during T
2 (∼10−9 sec), and
54
thus experience each time a microwave pulse, resulting in an asymmetrical (dysonian) lineshape 55
classically characterized by the asymmetry ratio A/B≈5. 10, 11 If d < δmw, all the electronic spins
56
experience the same microwave field, resulting in a symmetrical Lorentzian EPR line. Conse-57
quently the presence of sub-micrometric metallic lithium such as dendritic and/or mossy structures 58
can be revealed by the shape of the EPR spectrum. As expected for a Li electrode in the pristine 59
state (fig.1b), a single dysonian lineshape with A/B≈5 is observed, typical of thick metal. This is 60
in good agreement with the thickness d=400 µm of the Li electrode, which is much larger than the 61
skin depth δmw ≈1 µm for Li at 9.6 GHz.6, 7
62
The Li//Li cell was polarized to follow the mechanisms of Li stripping and plating with a 63
current density of 1 mA/cm2 (fig. 2a). During polarization 1, the top Li electrode is oxidized (Li 64
stripping) and the bottom electrode is reduced (Li electroplating). In polarization 2 this process is 65
reversed. No sign of cell failure was observed after 175 min of positive and negative polarization. 66
Three spectra of the cell, corresponding to the pristine state (t=0 min), the end of polarization 67
1 (t=85 min) and the end of polarization 2 (t=175 min), are shown in fig.1c. Between the two 68
polarization steps, the cell was left in open circuit (OCV) to record in situ EPR images. In contrast, 69
EPR spectra were recorded operando during the polarization steps, that is with current flowing 70
through the cell. The spectra exhibit different lineshapes, indicative of a modification of the Li 71
electrode morphologies upon polarization. The growth of a narrow and symmetric line in the 72
low field flank of the bulk Li signal results in a splitting of the EPR spectrum (fig. 1c). Each 73
EPR spectrum was simulated by the sum of two contributions: (i) a dysonian line for bulk Li 74
(Li(1)) with an asymmetry ratio 4>A/B>2, a fixed resonance field Hres=349.15 mT and a varying
75
linewidth ∆H; (ii) a narrow (∆H∼0.03-0.4 mT) and symmetric (A/B∼1) lorentzian line (Li(2)) 76
with resonance field Hres=349.12 mT (corresponding to g=2.0032), lower than for bulk lithium.
77
This new EPR line is assigned to Li particles with size d <1 µm, as discussed above. An example 78
of simulation is given in fig. 1d. The evolution of the EPR spectrum parameters for the two Li 79
species (intensity, linewidth ∆H and asymmetry A/B) during cell operation are given in fig. 2. The 80
intensities of the simulated lines continuously increase as the cell is polarized, to reach a factor 4 81
at the end of polarization 2 (t=175 min), as shown in fig. 2b. This increase in the EPR intensity 82
is assigned to the growth of sub-micrometric Li particles (Li(2)) on both electrodes but also to the 83
increased intensity of the EPR line of bulk Li (Li(1)). The latter should not be misinterpreted as 84
an increase in the total quantity of metallic Li during polarization. This increased intensity of bulk 85
Li signal (Li(1)) is the direct consequence of the progressive decrease of the asymmetry ratio A/B 86
from 5 to less than 3 at the end of polarization 2 (fig. 2d). This feature is the manifestation of the 87
alteration of the two bulk electrode surfaces during cycling, which creates Li structures with size 88
approaching the skin depth δmw. As only electron spins in the volume of the skin are responsible
89
for the EPR signal, the roughening of bulk lithium at constant total volume of metal induces an 90
increase of the skin volume, and thus an increase of the EPR intensity. The decrease of ∆H (fig. 91
2c) for bulk lithium during polarization is also the consequence of the progressive decrease of A/B 92
for the bulk Li signal. 93
This evolution of the EPR signal during cell cycling indicates that the reaction Li0 → Li+
94
+ e− (1) at one electrode and the reverse reaction Li+ + e− → Li0 (2) at the other electrode are
95
not equivalent. In polarization 1, newly formed sub-micrometric Li particles are produced on the 96
bottom electrode (Lib) with reaction (2), while the progressive roughening of the bulk Li electrode
97
on top (Lit) occurs through reaction (1). It seems, however, that there is a beginning of reversible
98
behaviour in the first few minutes of polarization 2, when the current is reversed, with a decrease 99
in EPR intensity of both types of lithium, as well an increase of the A/B ratio and the linewidth 100
∆H of bulk lithium (fig. 2). This could indicate that the previously-formed Li microparticles 101
on Lib are partially consumed by reaction (1) and/or structures of lithium in electrode Lit are
102
fused together into larger structures through reaction (2). In the second part of polarization 2, 103
however, the general evolution observed during polarization 1 continues, with an increase in the 104
EPR intensities of both Li types, and a decrease of A/B and ∆H of bulk lithium (fig. 2). This 105
demonstrates the high sensitivity of in situ EPR spectroscopy to the nucleation of very small Li 106
particles and the roughening of bulk Li electrodes, and places it as a tool of choice for studying the 107
effect of prolonged cycling. 108
Interestingly, the resonance field Hres of EPR line for the sub-micrometric Li particles is
109
shifted to low field by 0.03 mT compared to the bulk Li signal. Although the nature of this shift 110
requires further studies, it is likely that it is produced by the dynamic nuclear polarization of 111
metallic lithium particles via the Overhauser effect:12–14 the partial saturation of the EPR line po-112
larizes the nuclear spins, which create a very small nuclear field Hnucof around 0.03 mT, adding
113
to the external field H0. As the spins resonate in the effective field Hef f=H0+Hnuc>H0, the
res-114
onance condition, hf=gµB(Hres+Hnuc) requires that Hres decreases when Hnuc increases. This
115
effect is maximum when the electron spins ”experience” all the nuclear spins, as in the case of 116
the sub-micrometric Li particles. A recent NMR investigation showed that Dynamic Nuclear Po-117
larization (DNP) of metallic lithium was a powerful technique for characterizing electrodeposited 118
microstructures.15
119
In summary, the surface of the stripped Li electrode roughens during electrochemical po-120
larization, with structures of micrometric size or slightly larger, and new Li particles of sub-121
micrometric size nucleate through electroplating on the opposite electrode. In order to visualize 122
and locate these two types of metallic Li in the electrochemical cell, we performed in situ electron 123
paramagnetic resonance imaging (EPRI) of the full cell (fig. 3a, b, c). EPR images were recorded 124
in the pristine state, at the end of polarization1 and of polarization 2, in open-circuit phases to 125
-3 -2 -1 0 1 2 3 Position (mm) 0 0.2 0.4 0.6 0.8 1 Lit Separator End of polarization 1 -0.5 0 0.5 1 Po si ti o n (mm) 349 349.2 349.4 349.6 349.8 Magnetic field (mT) -0.5 0 0.5 1 Po si ti o n (mm) -0.5 0 0.5 1 Po si ti o n (mm)
Spatial-spatial EPRI Spectral-spatial EPR
End of polarization 2 Pristine state Lib (d) (a) (e) (b) (f) (c)
Figure 3: (Colour online) In situ X-band EPR spatial-spatial images (left) and spectral-spatial images (right) of the cell in the pristine state (top), at the end of polarization 1 (middle) and at the end of polarization 2 (bottom). The images display the absolute value of the EPR line |dχ”/dH|. The vertical dashed line indicates the resonance field of the bulk Li signal and the white triangle the resonance field of the sharper component (guides to the eye). The field of the vertical dashed line shifts between spectral-spatial EPR images due to a change of the microwave frequency. The color bar indicates the color code for the intensities, identical for all plots.
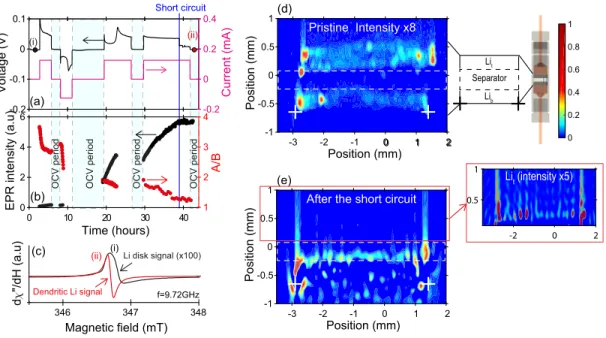
0 1 2 Lit Lib Separator Short circuit O C V p e ri o d O C V p e ri o d O C V p e ri o d O C V p e ri o d -3 -2 -1 0 1 2 Position (mm) -1 -0.5 0 0.5 1 Po si ti o n (mm) (d) Pristine Intensity x8 (e) -3 -2 -1 0 1 2 Position (mm) -1 -0.5 0 0.5 1 Po si ti o n (mm)
After the short circuit (a) (b) (c) (ii) (i) Dendritic Li signal Li disk signal (x100) (i) (ii) 0 10 20 30 40 Time (hours) 0 2 4 6 1 2 3 4 A/ B Magnetic field (mT) d "/ d H (a .u ) -0.2 -0.1 0 0.1 Vo lt a g e (V) -0.2 0 0.2 0.4 C u rre n t (mA) f=9.72GHz EPR i n te n si ty (a .u ) 348 347 346 0 0.2 0.4 0.6 0.8 1 -2 0 2 0.5 1 Lit (intensity x5)
Figure 4: (Colour online) In situ detection (EPR spectrum) and localization (EPR 2D images) of dendritic Li . (a) Voltage and current of the electrochemical cell versus time. The vertical blue line indicates the short circuit with a voltage drop to 0 V and current still flowing in the cell. (b)
Operandointensity and A/B ratio measured on the entire EPR signal (no simulation) as a function
of time. (c) EPR spectra of the cell recorded in the pristine state (bulk Li electrodes) and after the short circuit (dendritic Li). The resonance field is Hres=346.82 mT for the bulk Li signal and
Hres=346.7 mT for the dendritic Li signal. (d, e) In situ spatial-spatial EPR images recorded in the
pristine state (intensity x8) and after the short circuit, respectively. Spots crossing the separator after the short circuit suggest the location of dendritic Li. The inset shows a zoom in the region of
the top electrode Lit, not fully consumed. The white crosses are a guide to the eye for the lower
prevent compositional evolution during recording. First, pure two-dimensional imaging (spatial-126
spatial mode) was tested, with a gradient of 175 G/cm for encoding spatially the lithium signal. 127
Thanks to the sharp EPR lines of metallic Li (<1 G) the EPR images can be obtained with a high 128
spatial resolution of the order of micrometers in the pristine state.9, 16 129
Spatial-spatial EPR images are shown in fig. 3(left). They confirm that metallic Li is located 130
only in the two electrodes initially (fig. 3a). The separator inside the cell, with a thickness of 131
500 µm, appears in the center from the absence of EPR signal during all the electrochemical steps. 132
Its apparent size is similar to the real size and is indicative of a relatively good alignment of the 133
cell. In principle, one would expect to observe a similar EPR intensity within the two electrodes in 134
the pristine state. The observed contrast may have several physical origins such as, for example, 135
local variations of the microwave field caused by shielding or eddy current effects.9 After the
136
positive current flow (end of polarization 1, fig. 3b), the EPR intensity decreases in electrode Lit
137
(top). Additional spots corresponding to metallic Li deposition appear on electrode Lib (bottom),
138
and more particularly at the interface with the separator. The reverse phenomenon is observed 139
after inversion of the current flow (end of polarization 2, fig. 3c), with the metallic Li intensity 140
increasing on the surface of Lit, near the separator, and an intensity decrease in Lib. This imaging
141
mode, however, does not allow distinguishing clearly the two types of metallic Li. 142
In order to map the distribution of metallic lithium while preserving the spectroscopic (line-143
shape, resonance field) information, we turned to the correlation of spectroscopy and imaging 144
(spectral-spatial EPR). This technique consists in scanning the whole cell with the field gradient 145
(175 G/cm) applied along the Y direction (cell axis). The image (electron density profile) is re-146
constructed by stacking the EPR spectra obtained for each slice along the Y axis. In the resulting 147
two-dimensional plots shown in fig. 3 (right) the shape, resonance field and intensity of the EPR 148
spectra can be determined for each slice along the Y cell axis. For clarity the plot indicates the 149
variation of the absolute value of the first derivative signal |dχ”/dH| with the external magnetic 150
field. In this representation the spectra consist in two lobes along H separated by a narrow domain 151
with zero intensity. The main features of the EPR spectra can be recognized: (i) the field splitting 152
between the two lobes gives the peak-to-peak linewidth, ∆H of the EPR line, (ii) the relative inten-153
sity of the two lobes gives the asymmetry ratio A/B, and (iii) the boundary between the two lobes 154
is the value Hres of the external field H0 at which resonance occurs, as indicated by dashed lines
155
and white triangles. 156
The spatial distribution of the two types of lithium was obtained more precisely with these 157
spectral-spatial images. Initially, both electrodes show similar spectral characteristics, i.e. a broad 158
signal with the low field lobe more intense than the high field one, revealing the presence of only 159
bulk lithium foils (fig. 3d). Several modifications are observed at the end of polarization 1 (fig 3e): 160
(i) the EPR line is more intense in electrode Libthan in electrode Lit, and reveals the
submicromet-161
ric Li deposition on the bottom electrode, in agreement with spatial-spatial imaging. Interestingly 162
(ii) the intensity of the top (depleted) electrode is higher than in the pristine state. This effect is 163
the consequence of the roughening of the electrode surface upon stripping (increase of the volume 164
probed within the skin depth), in good agreement with our interpretation of pure EPR spectroscopy 165
(fig 2b). In addition, (iii) the linewidth of bulk Li decreases in both electrodes, in agreement with 166
fig. 2c. More importantly, in fig. 3e (iv) Hresof the top part of the Lib electrode is slightly shifted
167
to lower field (white triangle) compared to the bottom part of the same electrode (vertical dashed 168
line). This result indicates that the sub-micrometric particles appear at the interface with the sep-169
arator and not in the bulk of the bottom electrode. This trend is magnified, though in the opposite 170
direction, at the end of polarization 2 (current reversed) in fig. 3f: (i) the bottom electrode is sig-171
nificantly depleted, while the signal of the top electrode is narrower, more intense and symmetrical 172
at the interface with the separator; (ii) Hres of the bottom part of electrode Lit (white triangle)
173
is again shifted to lower field with respect to the top part (dashed line). These features indicate 174
the nucleation of an increased number of sub-micrometric Li particles at the electrode-separator 175
interface. 176
Finally, let us discuss the well-known problem of dendritic lithium nucleation which ulti-177
mately leads to short-circuit. Fig. 4 focuses on an in situ dendrite-induced short-circuit in another 178
symmetric Li//Li cell. This phenomenon is visible in the galvanostatic profile in fig. 4a. We de-179
tected a sudden drop to 0 V after almost 38 hours of cycling with the current still flowing, which 180
is indicative of a global short-circuit. The corresponding evolution of the EPR intensity and A/B 181
of the entire spectrum are given in fig. 4b. The intensity initially increases while A/B decreases. 182
This indicates a progressive increase in the number of electron spins submitted to the microwave 183
field, a signature of sub-micrometric Li particles nucleation and of the roughening of the elec-184
trodes. After the short-circuit however, the intensity no longer varies with time, in agreement with 185
the failure of the cell. Fig. 4c shows the EPR spectra recorded (i) in the pristine state and (ii) 186
after the short-circuit. The broad and asymmetric lineshape of (i) corresponds to the bulk lithium 187
electrodes. The second spectrum (ii) appears at lower field, symmetrical and more intense than (i) 188
by a factor ∼100. This intense and very sharp peak associated with the short-circuit corresponds 189
to a large predominance of sub-micrometric Li particles, i.e. the modification of the morphology 190
of the whole lithium disks. It is important to note that Li dendrites with sub-micrometric thickness 191
may also contribute to this signal. This hypothesis is confirmed by the spatial-spatial EPR images 192
recorded in the pristine state (fig. 4d) and after the short-circuit (fig. 4e). The presence of a dendrite 193
is evidenced by a red spot on the right-hand side of fig. 4e that crossed the separator and short-194
circuited the cell. Note that the top electrode was not consumed entirely; its intensity is lower as 195
explained above, but we can detect it (inset in fig. 4e). Additional red signals are dispersed under 196
the bottom electrode (indicated by white crosses) and correspond to Li sub-micrometric particles 197
deposited on the current collector after the short-circuit. 198
Conclusion 199
We performed in situ EPR measurements on symmetric Li/LiPF6/Li cells in operating conditions.
200
We establish operando EPR spectroscopy and in situ EPR spectral-spatial imaging as two highly 201
complementary tools to follow the changing morphology of metallic lithium during stripping and 202
to identify, localize and distinguish dendrites and sub-micrometric lithium particle during plat-203
ing. Two main features were observed from the evolution of the EPR spectra and spectral-spatial 204
EPR images of metallic Li in the electrochemical cell during polarization: (i) the nucleation of 205
sub-micrometric Li particles at the interface between the separator and the electrodes; (ii) the pro-206
gressive roughening of the electrodes into fragments of size slightly larger than 1 µm. We also 207
provide an in situ EPR image of dendrites in the separator between the two electrodes, at the origin 208
of a short-circuit of the electrochemical cell. To the best of our knowledge, spectral-spatial EPR 209
imaging was never used to investigate such electrochemical devices and we hope that these results 210
will pave the way to the combination of operando EPR spectroscopy and in situ spectral-spatial 211
EPR imaging to diagnose new generations of lithium-ion batteries. 212
Methods 213
Electrochemical cell The symmetric Li/LiPF6/Li electrochemical cells were assembled in the
214
homemade EPR cell previously developed6using an argon-filled glove box. The current collectors
215
were copper disks on each side. The electrodes were metallic lithium disks with a typical thickness 216
of around 400 µm and a diameter of 5 mm. One piece of porous microfiber mat (Whatman type 217
GF/D) was used to separate the electrodes. The whole content of the EPR cell was soaked with 218
electrolyte (1 mol/L LiPF6 in a mixture of ethylene and dimethyl carbonate in weight ratio 1:1,
219
Merck). Galvanostatic control was performed at room temperature using a VSP galvanostat from 220
Bio-Logic. The EPR cell was polarized (polarizations 1 and 2 in fig. 1a) with a current density 221
of 1 mA/cm2. The current was paused at the end of polarization 1 to record the images. EPR
222
spectra were recorded continuously during polarization with a time resolution of 5 min (operando 223
EPR spectroscopy). The same procedure was used for polarization 2, with a current of -1 mA/cm2.
224
The second EPR cell was polarized with a current density of 0.63 mA/cm2 for 3 hours and
-225
0.63 mA/cm2 for 3 hours. It was polarized positively again, with the same current as before,
226
during 20 hours to observe the nucleation of dendrites. 227
In situ EPR In situ continuous wave (cw) electron paramagnetic resonance experiments were 228
carried out using a conventional X-band Bruker E500 spectrometer operating at around 9.6 GHz 229
and room temperature. The microwave power supplied into the resonator was set to 4 mW in 230
order to avoid saturation of the EPR signal. The 100 kHz modulation depth of the magnetic field 231
was set to 0.1 mT or less to prevent distortion due to over-modulation. Conversion time and time 232
constant were set to 40.96 ms and 20.48 ms respectively. Cw-EPR spectra were fitted with one 233
dysonian and one derivative of Lorentzian using Matlab. The resonance fields of bulk (dysonian) 234
and sub-micrometric Li (Lorentzian) were fixed at 349.15 and 349.12 mT respectively. 235
The spectral-spatial and spatial-spatial images were recorded with a field-of-view of 7 mm 236
and gradient strength of 175 G/cm. The size of spatial-spatial images was 512 × 512 pixels re-237
sulting in a pixel size of 13.7 µm. The high resolution spatial-spatial EPR images were obtained 238
after a deconvolution of the acquired projections under a magnetic field gradient from a signal 239
recorded without gradient and a filtered back-projection. 140 projections were recorded for the 240
spectral-spatial images with a spectral resolution of 1024 points and a pixel size of 13.7 µm in 241
the spatial dimension. The high resolution spectral-spatial images were obtained from a filtered 242
back-projection of the acquired projections. 243
Acknowledgements This work was supported by the Agence Nationale de la Recherche (ANR) under a
244
JCJC project (ANR-15-CE05-0015-01) and LABEX STORE-EX (ANR-10-LABX-76), by the CNRS and
245
the RS2E (R´eseau sur le Stockage Electrochimique de l’Energie) network. C-ED, ES and HV thank R.
246
Omn´ee and M. Deschamps for valuable discussions. C-ED, ES and HV thank CNRS’s research federation
Author contributions E.S., J.-M.T. and H.V. designed the project. C.-E.D., M.T. and H.V. performed the
249
EPR measurements, C.-E.D., E.S., D.G. and H.V. interpreted the results. The manuscript was drafted by
250
C.-E.D. and E.S. and revised by all authors.
251
Competing Interests The authors declare no competing interests.
252
Correspondence Correspondence and requests for materials should be addressed to C.-E.D.
253
(email: charles.dutoit@chimieparistech.psl.eu) and to H.V. (email: herve.vezin@univ-lille1.fr).
254
255 1. Liu, K., Liu, Y., Lin, D., Pei, A. & Cui, Y. Materials for lithium-ion battery safety. Science 256
Advances4 (2018).
257
2. Waldmann, T., Hogg, B. I. & Wohlfahrt-Mehrens, M. Li plating as unwanted side reaction in 258
commercial Li-ion cells – A review. Journal of Power Sources 384, 107–124 (2018). 259
3. Hatzell, K. B. et al. Challenges in lithium metal anodes for solid-state batteries. ACS Energy 260
Letters5, 922–934 (2020).
261
4. Liu, Q. et al. Understanding undesirable anode lithium plating issues in lithium-ion batteries. 262
RSC Advances6, 88683–88700 (2016).
263
5. Foroozan, T., Sharifi-Asl, S. & Shahbazian-Yassar, R. Mechanistic understanding of li den-264
drites growth by in- situ/operando imaging techniques. Journal of Power Sources 461, 228135 265
(2020). 266
6. Sathiya, M. et al. Electron paramagnetic resonance imaging for real-time monitoring of li-ion 267
batteries. Nature Communications 6 (2015). 268
7. Wandt, J. et al. Operando electron paramagnetic resonance spectroscopy – formation of mossy 269
lithium on lithium anodes during charge–discharge cycling. Energy Environ. Sci. 8, 1358– 270
1367 (2015). 271
8. Wandt, J., Jakes, P., Granwehr, J., Eichel, R.-A. & Gasteiger, H. A. Quantitative and time-272
resolved detection of lithium plating on graphite anodes in lithium ion batteries. Materials 273
Today21, 231 – 240 (2018).
274
9. Niem¨oller, A., Jakes, P., Eichel, R. A. & Granwehr, J. EPR Imaging of Metallic Lithium 275
and its Application to Dendrite Localisation in Battery Separators. Scientific Reports 8, 1–7 276
(2018). 277
10. Dyson, F. J. Electron spin resonance absorption in metals. ii. theory of electron diffusion and 278
the skin effect. Phys. Rev. 98, 349–359 (1955). 279
11. Feher, G. & Kip, A. F. Electron spin resonance absorption in metals. i. experimental. Phys. 280
Rev.98, 337–348 (1955).
281
12. Overhauser, A. W. Polarization of nuclei in metals. Physical Review 92, 411–415 (1953). 282
13. Vigreux, C., Binet, L. & Gourier, D. Bistable Conduction Electron Spin Resonance in Metallic 283
Lithium Particles. The Journal of Physical Chemistry B 102, 1176–1181 (1998). 284
14. Vigreux, C., Loiseau, P., Binet, L. & Gourier, D. Anomalous metallic lithium phases: Identifi-285
cation by ESR, ENDOR, and the bistable Overhauser effect. Physical Review B - Condensed 286
Matter and Materials Physics61, 8759–8770 (2000).
15. Hope, M. A. et al. Selective NMR observation of the SEI-metal interface by dynamic nuclear 288
polarisation from lithium metal. Nature communications 11, 2224 (2020). 289
16. Maresch, G. G., Mehring, M. & Emid, S. High resolution ESR imaging. Physica B+C 138, 290
261–263 (1986). 291