HAL Id: hal-00319056
https://hal.archives-ouvertes.fr/hal-00319056
Submitted on 1 Jan 1999
HAL is a multi-disciplinary open access
archive for the deposit and dissemination of sci-entific research documents, whether they are pub-lished or not. The documents may come from teaching and research institutions in France or abroad, or from public or private research centers.
L’archive ouverte pluridisciplinaire HAL, est destinée au dépôt et à la diffusion de documents scientifiques de niveau recherche, publiés ou non, émanant des établissements d’enseignement et de recherche français ou étrangers, des laboratoires publics ou privés.
The influence of global warming in Earth rotation speed
R. Abarca del Rio
To cite this version:
R. Abarca del Rio. The influence of global warming in Earth rotation speed. Annales Geophysicae, European Geosciences Union, 1999, 17 (6), pp.806-811. �hal-00319056�
The in¯uence of global warming in Earth rotation speed
R. Abarca del RioLEGOS-UMR5566-GRGS, 18 Av. Ed Belin, F-31400 Toulouse, France, e-mail: [email protected] Received: 7 December 1998 / Revised: 21 January 1999 / Accepted: 29 January 1999
Abstract. The tendency of the atmospheric angular momentum (AAM) is investigated using a 49-year set of monthly AAM data for the period January 1949± December 1997. This data set is constructed with zonal wind values from the reanalyses of NCEP/NCAR, used in conjunction with a variety of operationally produced AAM time series with dierent independent sources and lengths over 1976±1997. In all the analyzed AAM series the linear trend is found to be positive. Since the angular momentum of the atmosphere±earth system is conserved this corresponds to a net loss of angular momentum by the solid earth, therefore decreasing the Earth rotation speed and increasing the length of day (LOD). The AAM rise is signi®cant to the budget of angular momentum of the global atmosphere±earth system; its value in milliseconds/century (ms/cy) is +0.56 ms/cy, corresponding to one-third of the estimated increase in LOD (+1.7 ms/cy). The major contribution to this secular trend in AAM comes from the equatorial Tropopause. This is consistent with results from a previous study using a simpli®ed aqua-planet model to investigate the AAM variations due to near equatorial warming conditions. During the same time interval, 1949±1997, the global marine + land-surface tempera-ture increases by about 0.79 °C/cy, showing a linear correspondence between surface temperature increase and global AAM of about 0.07 ms per 0.1 °C. These results imply that atmospheric angular momentum may be used as an independent index of the global atmo-sphere's dynamical response to the greenhouse forcing, and as such, the length of day may be used as an indirect indicator of global warming.
Key words. Meteorology and atmospheric dynamics (general circulation), Geodesy
Introduction and motivation
A distinguishing characteristic of the Earth's rotation is that the rate of rotation varies with time. Changes in the length of the mean solar day (LOD) are used to describe the changes in the rotation rate. Analyzing observations of eclipses dating back 2500 years, Stephenson and Morrison (1995) showed that the LOD has increased on average by +1.7 0.05 milliseconds/century (ms/cy). The astronomical evidence points to a secular change in the mean motion of the moon. With the requirement that angular momentum must be conserved, this obser-vation means that the Earth must also be subject to a tidal acceleration. The acceleration of the moon, measured accurately from lunar laser ranging and from the observed perturbations on the orbits of arti®cial satellites causes by lunar tides (Christodoulis et al., 1988), allowed Stephenson and Morrison (1995) to compute the corresponding change in LOD as +2.3 0.1 ms/cy. Thus, there must be an average accelerative non tidal component in the Earth's rotation which acts to decrease the LOD by )0.6 0.1 ms/cy. This is commonly explained by the eects of the last ice age (Wahr, 1988); the postglacial rebound induces a net transfer of material within the Earth toward higher northern latitudes, decreasing the Earth's moment of inertia and thereby decreasing LOD. Using laser-ranging data from Lageos and Starlette satellites, it has been possible to measure changes in the Earth's gravitational ®eld and estimate secular variability in LOD due to internal mass distribution within the Earth system. These measurements range from )0.44 0.05 ms/cy to )0.61 0.05 ms/cy, consistent with values we should expect from a postglacial rebound process (Peltier and Jiang, 1996).
The LOD signal also undergoes diurnal to decadal variability (Lambeck, 1980). These ¯uctuations are of considerable geophysical interest since they imply that changes occur in the mass distribution inside and on the
surface of the Earth, or that torques are applied at the Earth surface or at the core-mantle boundary (Lam-beck, 1988). It has now been proven that changes in the axial momentum of the atmosphere's angular momen-tum (AAM) explains most of the changes in the length of the day (LOD) over the broad band range of time scales from diurnal up to the interannual (Eubanks, 1993). However on decadal and longer time-scales, non-atmospheric processes must dominate the global mo-mentum budget; a view which has been appreciated since at least as long ago as Munk and MacDonald (1960).
Recently, Satoh and Yoshida (1996) applied an atmospheric aqua planet model to show that global uniform warming of surface temperature results in an increase of the AAM. These results, based on a simpli®ed model were too weak to explain the decadal variability in LOD. However their ideas were supported by Abarca del Rio (1997), who used information on zonal winds from rawinsonde measurements and oper-ational centers from 1963 to 1994 to show that part of the decadal variability on LOD could be excited by the atmosphere. Thus, in contradiction to Munk and MacDonald (1960), it is possible that long term atmo-spheric variability may be contributing to secular variability in LOD.
Many authors have studied long-term instrumental temperature records to separate possible anthropogenic climate change from natural climate variability (Ni-cholls et al., 1996 and references therein). All these studies concluded that a signi®cant, but irregular warming trend has occurred on a global scale since 1850: global surface temperatures have increased by about 0.3±0.6 °C since the late nineteenth century, and by about 0.2±0.3 °C over the last 40 years (the period with the most credible data). The trend is fairly ¯at from the middle of the nineteenth century until 1910, followed by increases of over 0.1 °C per decade in combined land-and sea-surface temperature during 1910±1940 land-and over the last four decades. The short instrumental climate records at our disposal make it dicult to explain this irregular increase. This could be due to natural vari-ability, external forcing such a slow insolation variations or changes in the mean terrestrial volcanism. However the most popular suspected cause is anthropogenic greenhouse gases which give rise to internal climate variability. This last hypothesis implies a linear increase in surface temperature (land and sea) given an expo-nential increase in carbon dioxide. This increase in global surface temperature, whatever its cause should be, may then possibly generate a trend in AAM.
The purpose of this paper is to investigate a trend in AAM, the relative contribution from the whole atmo-sphere as its possible relationship with surface temper-ature. This study is made possible thanks to the recent reanalyses of long records of climate variables by NCEP/NCAR (Kalnay et al., 1996) that provide zonal winds for almost 50 years (1949±1997). Information from independent AAM series derived from operational centers (NCEP, JMA, UKMO and ECMWF) is pro-vided by the Sub Bureau of Atmospheres (SBA)
(Salstein et al., 1993) of the International Earth Rota-tion Service (IERS) which allows us to verify the reality of the estimates of the secular trend.
Trend in AAM series
The AAM about the polar axis of a layer of the atmosphere, may calculated by (Barnes et al., 1983) AAM 2pR3 g ZPt Ps Z ÿp=2 p=2 Z2p 0 u cos2u@k@u@p 1
where R is the radius of the Earth, g the acceleration due to gravity and u denotes zonal wind. The term is integrated over all latitudes, longitudes and pressures (u; k and p). Because the wind ®elds are archived at constant pressures levels, it is convenient when using these data sets to set the lower boundary in the integration pS to 1000 hPa, whereas the upper level
pT varies here from 100±10 hPa depending on the
operational weather center considered. All the charac-teristics of AAM series used in that study are summa-rized in Table 1. The longest series of values of operational AAM data already available from SBA are the NMC100W , integrated up to 100 hPa produced by
the NMC, now NCEP, from June 1976 to January 1997. Also starting in 1976 are the NMC50
W (50 hPa) series
from NMC analyses. The UK25
W(25 hPa) series begins in
May 1983 from the analyses of the United Kingdom Meteorological Oce (UKMO). A series of values integrated up to 10 hPa (EC10
W) became available from
the European Centre for Medium Range Weather Forecasts (ECMWF) starting in October 1984. Starting in september 1983, the Japan Meteorological Agency (JMA) also provides the JMA10Wseries up to 10 mb. All
operational AAM series extend up to January 1997. In summary, all these series collected and archived by the SBA (Salstein et al., 1993) are at least 10-years long. However, since decadal scale variability is also present
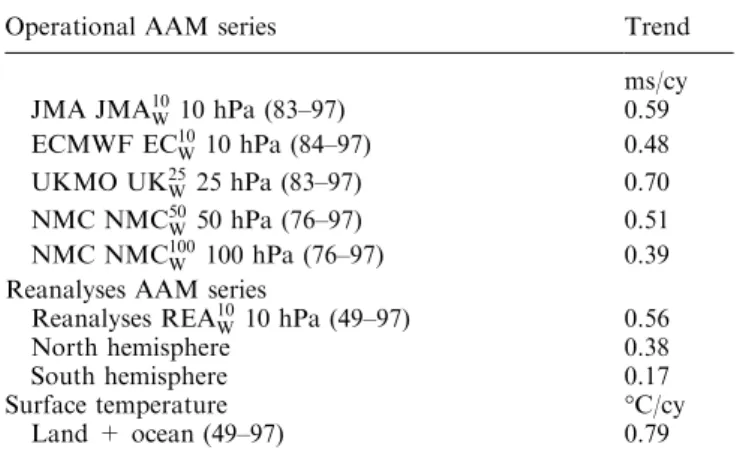
Table 1. Estimates of rates. AAM values are given in 10)3s (ms)
and Temperatures in degrees Celsius (°C). First column gives information on the AAM series; source, name, upper height integrated and length
Operational AAM series Trend ms/cy JMA JMA10 W10 hPa (83±97) 0.59 ECMWF EC10 W10 hPa (84±97) 0.48 UKMO UK25 W25 hPa (83±97) 0.70 NMC NMC50 W50 hPa (76±97) 0.51 NMC NMC100 W 100 hPa (76±97) 0.39
Reanalyses AAM series Reanalyses REA10
W10 hPa (49±97) 0.56
North hemisphere 0.38
South hemisphere 0.17
Surface temperature °C/cy
Land + ocean (49±97) 0.79 R. Abarca del Rio: The in¯uence of global warming in Earth rotation speed 807
in AAM (Abarca del Rio, 1997), the determination of a long-term gradient in AAM can be biased by this or other low frequency signals present in the time series. The availability of zonal wind ®elds from the recent NCEP reanalyses (Kalnay et al., 1996) allows us to construct a 49-year-long AAM time series (January 1949±December 1997), that permits a better determina-tion of decadal variability and thus a more accurate long-term trend. The reanalyses ®elds of NCAR/UCAR are available on a monthly basis on 2.5 ´ 2.5 latitude± longitude grids over 17 layers (1000, 925, 850, 700, 600, 500, 400, 300, 250, 200, 150, 100, 70, 50, 30, 20 and 10 hPa). These ®elds allowed computation of AAM up to 10 hPa REA10W using Eq. 1.
It is possible to infer changes in LOD from global AAM time series, assuming that changes in AAM for the entire atmosphere are accompanied by equal, but opposite, changes in the angular momentum of the earth, through the relation (Rosen and Salstein, 1983) DLOD ms 1:68 10ÿ29DAAM kg m2=s 2
where DLOD is given in milliseconds. In this study all AAM series will be expressed in their equivalent value in LOD.
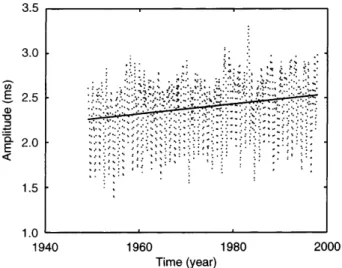
The REA10Wseries over 1949±1997 is shown in Fig. 1,
together with its calculated linear trend. The trend is equal to 0.56 ms/cy. As an external check, we also estimate trends in the operational AAM series. Results for all the calculated trends are reported in Table 1. The estimated trends range from 0.48 ms/cy for the EC10 W
series to 0.70 ms/cy for the UK25
Wseries. Note that values
from NMC100
W and NMC50Ware close, which demonstrate
that the main contribution is from the troposphere (79%); however the dierence suggests that the lower stratosphere contributes signi®cantly to this trend. Temperature changes and global AAM
Over the same time span, the global (land + marine) temperature data set from the Climate Research Unit of
the University of East Anglia (Parker et al., 1994), increases by about 0.79 °C/cy (Table 1). Thus, if at secular time scales a relation exists between global surface temperature increase and global AAM increase the ratio would be a 0.07 ms per 0.1 °C increase. Indeed a close relation at interannual time-scales has already been shown between temperature and AAM (Stefanick, 1982) by assuming that changes in subtropical winds are qualitatively consistent with tropical temperatures chan-ges assuming geostrophic balance. This study sugchan-gests that a thermal wind argument was sucient for explaining the amplitude of the zonal wind variations. More recently, a modeling study by Satoh and Yoshida (1996) provided a ®rst insight into a possible relation between increase in global temperature and AAM. Their results show that AAM increases when the temperature is uniformly increased due to the higher elevations of the Tropopause and the jets. Their study also demonstrated that when warming is con®ned near the equator, a jet is created within the equatorial Tropopause which leads to increased zonal winds and therefore to an important contribution to the global AAM trend. The mechanism by which the equatorial jet is created is related to Rossby wave generation in the equatorial area (Satoh, personal communication).
Zonal and regional contributions to the AAM trend The monthly zonal wind ®elds from the NCEP reana-lyses (1949±1997), were used to compute the relative contribution to the trend from all vertical layers from the surface (1000 hPa) up to 10 hPa on a global and hemispheric basis. For each hemisphere within each pressure level at which zonal wind data were available, we compute the angular momentum (Fig. 2). In order to stress the contribution from upper layers of the atmo-sphere, results in Figs. 2, 4 are presented according to height in kilometers (km) instead of units of pressures (hPa). Indeed, a major contribution to the global AAM originates within the upper troposphere and lower stratosphere (10±26 km), with a broad peak about 15± 19 km (roughly 100±50 hPa) explaining results found with the NMC100
W and NMC50W series. The vertical
distribution in the northern hemisphere explains most of the prominent 10±25 km peak. A strong contribution to the global AAM is also found about 1±5 km (roughly 900±600 hPa) with a peak at 2.5 km (roughly 750 hPa) originated mainly from southern hemisphere contribu-tion. Note that the southern hemisphere includes layers with negative contribution, located within the upper part of the Troposphere (10±15 km, roughly 200± 100 hPa).
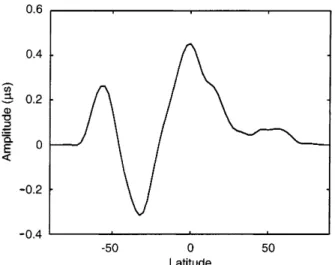
These hemispheric trends can be further examined by calculating the zonal contribution to the global AAM. Within each latitude width for which zonal wind data were available (every 2.5° latitude) we compute the angular momentum (per unit of latitude width) from the surface (1000 hPa) to the top (10 hPa; Fig. 3). A negative contribution comes preferentially from the latitudes 45°S to 25°S, which correspond to the position
Fig. 1. Time series of AAM from 1949 to 1997 (points) and the estimated trend (solid)
of the southern hemisphere jet (Peixoto and Oort, 1992). Over the southern hemisphere a positive peak takes place from 70°S to 45°S, with a maximum at about 56°S, with only a very slight counterpart at the same northern latitude. However, the most important contribution to the global trend in AAM arises in tropical latitudes between 20°S to 20°N. As the positive and negative contributions almost compensate each other in the southern hemisphere, the integrated value from 20°S to 20°N accounts for most of the trend found in the global AAM.
To give a further insight into which portions of the atmosphere are most responsible for the results found above, we estimated angular momentum within each latitude width (every 2.5°) and atmospheric layer for which zonal winds were available (Fig. 4). As already shown by Figs. 2 and 3, there is no symmetry with respect to the equator though similar properties are shown in both hemispheres. In both hemispheres strong
negative trends ®nd their source over the subtropical jets about 25°±35° latitudes, located within 10 and 15 km (200±100 hPa) with a maximum of intensity around 30° and 13 km (150 hPa). However, the altitudes of the negative trends are not exclusively located near the jets; they extend from the near surface (800 mb) to the top of the atmosphere. The negatives trends correspond to the zone of exchange between the Hadley and Ferrel cells (Peixoto and Oort 92). Note that in the northern hemisphere the position of the jets is slightly equator-ward than in southern hemisphere.
Strong positive contributions to the global AAM trend are found within the latitudes 50°±60° with maximum intensity at 55° which related to the bound-aries between Ferrel and Polar cells (Peixoto and Oort 92). The southern hemisphere contributions are larger than those of the northern hemisphere. The lack of symmetry with respect to the equator, on the strength of hemispheric contributions to the global AAM may depict the oceanic character of the southern hemisphere which makes zonal circulation stronger compared to the more continental northern hemisphere.
Warming and AAM trend
The results plotted in Fig. 4 highlight the tropical trend values shown in Fig. 3; tropical peaks originate prefer-entially from high altitudes over the equatorial Tropo-pause (6±23 km, (400±30 hPa) but also from weaker amplitude contributions over the lower troposphere, i.e. from 1±4 km (900±600 hPa). Due to the near cancella-tion of negative and positive southern hemisphere contributions (Fig. 3), the prominent contribution seen about 10±25 km in Fig. 2 originates mostly from the equatorial bands. This structure agrees with the results by Satoh and Yoshida (1996). We remark similar responses in the equatorial upper troposphere and lower stratosphere although it is not clear whether these are directly related to the equatorial jet responding to the localized warming shown by Satoh and Yoshida (1996). This part of the lower stratosphere may also be in¯uenced by the lowest region of the stratospheric Quasi-Biennial Oscillation (QBO). The interaction be-tween a global warming and the response of the QBO has not yet been studied, mostly because until recently it has been very dicult to simulate QBO in global circulation models (Takahashi, 1996). This interaction should also be investigated.
Summary and conclusion
This study based on the AAM series computed with the zonal wind ®eld from NCAR/NCEP reanalyses shows that AAM present a measurable and clear positive trend over the last 49 years (1949±1997). It is equivalent to a secular trend of +0.56 ms/cy in length of day. The trend in AAM is con®rmed by four independent data sets arising from dierent atmospheric operational centers, i.e. ECMWF, UKMO, JMA and the NMC (now
Fig. 2. Vertical distribution of contributions to the global AAM trend. Northern hemisphere (dashed), southern hemisphere (points) and sum of both contributions (solid). The ordinate is height in kilometers (km). Values are given in units of 10)6s (us)
Fig. 3. Distribution of contributions over rings of 2.5° latitude width to the global AAM trend. The ordinate is height in kilometers (km). Values are given in units of 10)6s (us)
NCEP). Over the last 49 years, the computed trend in global (land + ocean) surface temperature is 0.79 °C/cy. Consequently an increase of 0.1 °C per decade in global surface temperature will increase the global AAM by 0.07 ms.
This study addresses the relative contributions of dierent parts of atmospheric angular momentum on the linear trend in LOD. It appears that the atmosphere as a whole gained angular momentum. The main contribution arises over the troposphere with almost 80% of the total trend in AAM, but the participation of the stratosphere is also important in terms of geograph-ical contribution. The main contribution to the global AAM increase is located at the equator, one part near the surface but mostly within the equatorial Tropo-pause. This is consistent with a recent study by Satoh and Yoshida (1996) with an aqua planet model under global warming characteristics. Positive and negative values of trend are found within boundary zones of dierent atmospheric cells; they are positive between the Polar and Ferrel cells, and negative between the Hadley and Ferrel cells with particularly strong values associ-ated within the main jet of each hemisphere. These results highlights the role played by the dierent cells (Hadley, Ferrel and Polar) and their boundaries on atmospheric angular momentum under global warming conditions. The values of the trend are generally higher over the southern hemisphere re¯ecting probably the larger ocean surface area.
Considering that changes in AAM for the entire atmosphere are accompanied by equal but opposite changes in the axial angular momentum of the solid earth, the value in LOD due to the AAM trend found (+0.56 ms/cy) represent about the same value, though in the opposite sense, of contribution to trend in LOD measured by Laser ranging techniques ()0.4 to )0.6 ms/ cy) and attributed to postglacial rebound (Peltier and Jiang, 1996). The atmosphere is thus playing a major role at secular time-scales in LOD variability.
Since both contributions tend to cancel each other out, the actual (this century) trend in LOD must be close the secular trend due to tidal friction (+2.3 ms/ cy). Nevertheless, the observed secular increase in LOD (+1.7 ms/cy) given by Stephenson and Morrison (1995) is obtained from all reliable historical observa-tions over the past 2700 years (700 BC to AD 1900). Instead, the secular trend due to AAM is obtained exclusively from atmospheric reanalyses over the last 50 years. However, other components of the system such as oceanic circulation may be also participating actively at secular time scales, and their contribution will have to be carefully estimated before any de®nitive conclu-sion.
While the record of surface air (land and marine) temperature has for long been the principal evidence for change in the global system, atmospheric angular momentum, used until now to characterize the general circulation of the atmosphere, may be as well considered as a global warming indicator. Since the total angular momentum of the atmosphere±earth system is conserved the rotation rate of the solid Earth appears to be an indirect indicator. Furthermore this study questions whether an important eect of global warming, under an anthropogenic hypothesis, is the changing of the orbital characteristics of our planet.
Acknowledgements. We are grateful for discussion with Mme. Martine Feissel and comments by Mr. Masaki Satoh. Both provided critical readings of the manuscript and made several helpful and useful suggestions. An anonymous reviewer oered accurate and fruitful comments. Rosemary Morrow kindly assisted us in improving the English of this article. Special thanks to Peter Nelson from SBA (AER inc., Boston, USA) of International Earth Rotation Service (IERS) for providing us with the operational AAM data. We thank CPC/NCEP for providing us with the zonal wind ®elds from reanalyses of NCEP/NCAR.
Topical Editor F. Vial thanks S. Yoshida for his help in evaluating this paper.
References
Abarca del Rio, R., La Rotation de la Terre: Etude du cycle annuel et de la variabilite basse frequence. Etude climatique de la rotation Terrestre Ph.D. thesis, Universite Paul Sabatier, 1997. Barnes, R. T. H., R. Hide, A. A. White, and C. A. Wilson, Atmospheric angular momentum ¯uctuations, length of day changes and polar motion, Proc. R. Soc. Lon., 387, 31±73, 1983. Christodoulis, D. C., D. E. Smith, R. G. Williamson, and S. M. Klosko, Observed tidal braking in the Earth/Moon/Sun system, J. Geophys. Res., 93, 6216±6236, 1988.
Eubanks, T. M., Variations in the orientation of the Earth, in Contributions of space geodesy to geodynamics, ed. by S. D. E., and D. L. Turcotte, American Geophysical Union, Washington, D.C., 1±54, 1993.
Kalnay, E., M. Kanahitsu, R. Kistler, W. Collins, D. Deaven, L. Gandin, H. Iredell, S. Saha, S. White, J. Woollen, Y. Zhu, M. Chelliah, W. Ebisuzaki, W. Higgins, J. Jandwiak, K. C. Mo, C. Ropelewski, J. Wang, A. Leetma, R. Reynolds, R. Jenne and D. Joseph, The NCEP/NCAR 40-year reanalysis project, Bull. Amer. Meteor. Soc., 77, 437±471, 1996.
Lambeck, K., The Earth's variable rotation: geophysical causes and consequences, Cambridge Univ. Press, Cambridge, 1980. Lambeck, K., Geophysical geodesy: the slow deformation of the
Earth, Clarendon Press, Oxford, 1988. Fig. 4. Latitude±height distribution of contributions to the global
AAM trend. The ordinate is height in kilometers (km). Positive contributions are colored from green to red, negative contributions from blue to white
Munk, W. H., and J. F. MacDonald, The rotation of the Earth, a geophysical discussion, Cambridge Univ. Press, Cambridge, 1960.
Nicholls, N., G. V. Gruza, V. Jouzel, T. R. Karl, L. A. Ogallo, and D. E. Parker, Observed climate variability, in The science of climatic change, ed. by Cambridge Univ. Press, Cambridge, 133±192, 1996.
Parker, D. E., P. D. Jones, C. K. Folland, and A. Bevan, Interdecadal changes of surface temperature since the late nineteenth century, J. Geophys. Res., 99, 14373±14399, 1994. Peixoto, J. P., and A. H. Oort, Physics of Climate, American
Institute of Physics, 1992.
Peltier, W. R., and X. Jiang, Glacial isostatic adjustment and Earth rotation: re®ned constraints on viscosity of the deepest mantle., J. Geophys. Res., 101, 3269±3290, 1996.
Rosen, R. D., and D. A. Salstein, Variations in atmospheric angular momentum on global and regional scales and length of day, J. Geophys. Res., 88, 5451±5470, 1983.
Salstein, D. A., D. M. Kann, A. J. Miller, and R. D. Rosen, The sub-bureau for atmospheric angular momentum of the international earth rotation service: a meteorological data center with geodetic applications, Bull. Amer. Meteor. Soc., 14, 67±80, 1993. Satoh, M., and S. Yoshida, Response of the atmospheric angular momentum and the length of the day to the surface temperature increase for an aqua planet model, Geophys. Res. Lett., 23, 2569±2572, 1996.
Stefanick, M., Interannual atmospheric angular momentum vari-ability 1963±1973 and the Southern Oscillation, J. Geophys. Res., 87, 428±432, 1982.
Stephenson, F. R., and L. V. Morrison, Long-term ¯uctuations in the Earth's rotation: 700 BC to AD 1990, Phil. Trans. R. Soc. A, 351, 165±202, 1995.
Takahashi, M., Simulation of the stratospheric quasi-biennial oscillation using a general circulation model, Geophys. Res. Lett., 23, 661±664, 1996
Wahr, J. M., The Earth's rotation, Ann. Rev. Earth Planet. Sci., 16, 231±249, 1988.