UNIVERSITÉ DE MONTRÉAL
DEVELOPMENT OF PHASE-SHIFTING PROFILOMETRY FOR 3D BRAIN CAVITY RECONSTRUCTION AND IN VIVO DETECTION OF INTRINSIC FLUORESCENCE
THROUGH A NEUROSURGICAL MICROSCOPE
LETICIA ANGULO RODRIGUEZ INSTITUT DE GÉNIE BIOMÉDICAL ÉCOLE POLYTECHNIQUE DE MONTRÉAL
THÈSE PRÉSENTÉE EN VUE DE L’OBTENTION DU DIPLÔME DE PHILOSOPHIÆ DOCTOR
(GÉNIE BIOMÉDICAL) JUIN 2018
UNIVERSITÉ DE MONTRÉAL
ÉCOLE POLYTECHNIQUE DE MONTRÉAL
Cette thèse intitulée:
DEVELOPMENT OF PHASE-SHIFTING PROFILOMETRY FOR 3D BRAIN CAVITY RECONSTRUCTION AND IN VIVO DETECTION OF INTRINSIC FLUORESCENCE
THROUGH A NEUROSURGICAL MICROSCOPE
présentée par : ANGULO RODRIGUEZ Leticia
en vue de l’obtention du diplôme de : Philosophiæ Doctor a été dûment acceptée par le jury d’examen constitué de : Mme SANTATO Clara, Doctorat, présidente
M. LEBLOND Fréderic, Ph. D., membre et directeur de recherche M. DEHAES Mathieu, Ph. D., membre
DEDICATION
With immense gratitude and love to my parents, my parents-in-law, my husband and our beloved baby for being a source of motivation and strength in my life
ACKNOWLEDGEMENTS
I would like to express my gratitude to my supervisor, Prof. Frederic Leblond, for accepting me as his first PhD student at Polytechnique Montreal, and for always being open for discussion and to exchange ideas and views. In addition, I thank you for all your help and guidance.
I thank my committee members: Prof. Clara Santato, Prof. Mathieu Dehaes, Prof. Jacques de Guise and Prof. Sofiane Achiche for evaluating my thesis and providing their valuable feedback.
A big thank you to Dr. Kevin Petrecca, Chief of Neurosurgery and head of the Brain Cancer research group at the Montreal Neurological Institute, for testing the device developed in this PhD during brain cancer surgeries, and for continuously giving me inputs on the project at the end of each surgery so I could improve my device further. Thanks as well to the nursing staff at the Montreal Neurological Institute for helping me in every possible way during the late evenings and weekends that I spent there trying to make things work.
Thanks to all my colleagues at the Laboratory of Radiological Optics for sharing their knowledge with me. Catherine St-Pierre, thank you not only for the times you lent me a hand with math and programming but also for allowing me to know more about the culture and language of Quebec. And thanks to all the students that worked with great motivation under my supervision at the lab, especially Youmna Badawy.
I also want to use this opportunity to express my sincere thanks to the technicians in the Department of Engineering Physics: Jean-Paul Levesque, Francis Boutet and Evgueni Babian for helping me build the device that is presented in this thesis piece by piece and for always being available to talk through the device design.
In addition, I would also like to thank the expert scientists Samuel Belanger and Mathias Strupler from whom I learned a lot about optical design and image analysis; thank you Sam and Mathias for helping me and sharing your experience with me since the beginning of my PhD. Besides, I would like to express my appreciation to Mrs. Amal Bennani, Student Records Officer at the Institute of Biomedical Engineering, who looked after me and helped me complete the graduation requirements for the PhD degree.
Last but not least, I dearly thank the good friends from all around the world that I made in Montreal for being a family when we were thousands of miles away from home. And also thanks to the old friends and family that always sent me words of encouragement. I thank with all my heart my loving parents, Leticia and Emilio, for working so hard to give me and my brother the best education and for instilling values in us, particularly for teaching us the importance of integrity, dedication and hard work; thank you mom for inspiring me and for giving me the confidence to dream big! Also, I would like to extend my deepest gratitude to my biggest supporter, my husband Alexis, for being with me throughout all my graduate studies and for believing in me and at the same time pushing me to reach my goals and do better! And to my parents-in-law: thank you so much, Beatrice and Daniel, for supporting me through the difficult moments as if I was your own daughter. Finally, thanks for the life of my baby girl that came into my life at the end of my PhD; one day you will know how much you encouraged me to write and defend my thesis and how much I have loved you since then.
RÉSUMÉ
Les microscopes neurochirurgicaux ont été conçus pour détecter la fluorescence produite par des tissus biologiques ; de plus, la spectroscopie optique peut être utilisée pour guider une opération chirurgicale telle que la résection d’une tumeur du cerveau. Néanmoins, les microscopes actuels n’ont pas de capacité hyperspectrale, ce qui les empêche d’évaluer quantitativement les propriétés optiques des tissus (absorption et diffusion). Ils ne peuvent utiliser ces marqueurs pour réaliser une correction d’atténuation qui permettrait d’obtenir des valeurs quantifiées de fluorescence. Une première étape importante permettant d’évaluer précisément les propriétés d’absorption et de diffusion des tissus biologiques est la détermination de la forme géométrique de l’échantillon. Cette thèse présente un système hyperspectral intégré dans un microscope neurochirurgical commercial. Un tel système est capable de réaliser deux fonctions : (a) extraire le profil 3D du cerveau ; et, (b) détecter la signature spectrale de l’auto-fluorescence des tissus du cerveau. Ce sont des développements initiaux essentiels en vue de la création de nouveaux équipements qui permettront de quantifier la fluorescence intrinsèque des tissus durant une opération chirurgicale. Ceci dans le but de détecter des anomalies sans ambiguïté.
Un système d’imagerie a été développé et consiste en un Projecteur Digitale de Lumière associé avec un microscope neuro chirurgical permettant à la lumière structurée d’être projetée sur une cavité chirurgicale. La détection est réalisée en utilisant un système hyperspectral de haute sensibilité qui est également couplé avec le microscope à travers un port optique libre. La projection de lumière structurée est utilisée pour réaliser une reconstruction 3D. Elle a été évaluée en utilisant une structure de la forme d’une pyramide avec plusieurs marches, ce qui permet de déterminer l'exactitude et la précision du système de la profilométrie. L'exactitude et la précision moyennes pour toutes les reconstructions de hauteurs des marches des pyramides (de 1.5 à 30 mm) étaient respectivement de 0.3 mm et 0.6 mm. Des mesures de profilométrie à différents angles ont également été effectuées en tournant une plate-forme de ±15, 30 et 45. L’erreur de reconstruction moyenne pour tous les angles a été de 1.94 degrés (σ = 1.2 degrés). En outre, un fantôme optique de la forme d’un cerveau avec des propriétés optiques dans des échelles de valeurs physiologiques réalistes a été fabriqué. Son profil a été reconstruit avec une exactitude comparable au test avec des pyramides.
Pour la détection de la fluorescence, le même système de détection a été utilisé mais le Projecteur Digitale de Lumière a été remplacé par une source bleue venant d’un microscope chirurgical. Une technique a été développée pour récupérer la fluorescence intrinsèque des tissus du cerveau et la méthode a été testée in vivo durant des opérations de résection de gliome à l'Institut et hôpital neurologique de Montréal. La méthode comprend une calibration technique pour corriger les données de fluorescence hyperspectrale dans le but d’enlever la réponse spectrale et spatiale de l’instrument d’imagerie. Ensuite, un algorithme a été développé pour corriger l’effet de l’atténuation de la lumière sur les propriétés optiques du tissu en normalisant la fluorescence avec des images de réflectance de lumière blanche dans le but de produire des données d’imagerie spécialement reliées à la fluorescence émise par les molécules du tissu. Les données préliminaires d’un cas clinique ont permis de révéler que les tissus en bonne santé ont une fluorescence avec une intensité plus grande que celle des tumeurs, hypothèse qui se retrouve également dans la littérature.
En conclusion, le système d’imagerie développé comme partie intégrante de cette thèse est capable de fournir une hauteur pixel par pixel dans la cavité chirurgicale (profil 3D) et une carte de l’auto-fluorescence de la surface du cerveau.
ABSTRACT
Neurosurgery microscopes have been developed to detect fluorescence associated with biological tissue; in addition, optical spectroscopy can be used to guide surgical procedures including the resection of brain tumors. However, current microscopes do not have hyperspectral capabilities, which prevents these systems from quantitatively evaluating tissue optical properties (absorption and scattering) and use these values to implement an attenuation correction leading to quantified values of fluorescence. An important first step allowing to accurately assessing the absorption and scattering properties of biological tissue is the determination of the geometric shape of the sample. Here we present a hyperspectral system integrated onto a commercial neurosurgical microscope that is capable of supporting two functionalities: (a) extracting the 3D profile of the brain, and (b) detecting the spectral signature of brain tissue autofluorescence. These functionalities represent critical initial advancements towards the development of new devices that will be able to quantify intrinsic tissue fluorescence during surgical procedures in order to unambiguously detect abnormalities.
An imaging system was developed that consists of a Digital Light Projector coupled to a neurosurgical microscope allowing structured light to be projected on the surgical cavity. Detection is achieved using a high sensitivity hyperspectral system also coupled to the microscope through a free optical port. The projection of structured light is used to perform a 3D reconstruction, which was evaluated using a phantom in the shape of a pyramid with multiple steps allowing determining the accuracy and precision of the profilometry system. The average accuracy and precision for all reconstructions of pyramid step heights (from 1.5 to 30 mm) was 0.3 mm and 0.6 mm, respectively. Profilometry measurements at different angles were also acquired by rotating a platform by ±15, 30 and 45. The mean reconstruction error for all angles was 1.94 (STD = 1.2). Additionally, a brain-shaped phantom with optical properties within the range of realistic physiological values was fabricated and its profile was reconstructed with accuracies comparable with the pyramid step phantom.
For fluorescence detection, the same detection system was used but the Digital Light Projector was replaced with the wide-field blue source from a fluorescence neurosurgical microscope. A technique was developed to recover intrinsic brain tissue fluorescence and the
method was tested in vivo during glioma resection procedures at the Montreal Neurological Institute and Hospital. The method includes a calibration technique to correct hyperspectral fluorescence data in order to remove the spectral and spatial response of the imaging instrument. Then, an algorithm was developed to correct for the light attenuation effect of tissue optical properties by normalizing the fluorescence with white light reflectance images with the objective to produce imaging data specifically related to fluorescence emitted by tissue molecules. Preliminary data from a clinical case suggested that healthy tissue has higher fluorescence intensity than tumor, which is in line with the literature.
In conclusion, the imaging system developed as part of this thesis is able to provide pixel-by-pixel heights within the surgical cavity (3D profile) and autofluorescence maps of the brain surface.
TABLE OF CONTENTS
DEDICATION ... iii ACKNOWLEDGEMENTS ... iv RÉSUMÉ ... vi ABSTRACT ... viii TABLE OF CONTENTS... xLIST OF TABLES ... xiv
LIST OF FIGURES ... xv
LIST OF SYMBOLS AND ABBREVIATIONS ... xxi
LIST OF APPENDICES ... xxiii
CHAPTER 1 INTRODUCTION ... 1
1.1 Motivation ... 1
1.2 Objectives and summary of technology developments ... 3
1.3 Overview of thesis ... 3
CHAPTER 2 REVIEW OF LITERATURE ... 5
2.1 Profilometry ... 5
2.1.1 Basic principles ... 5
2.1.2 Profilometry techniques... 5
2.1.2.1 Passive methods: the two camera case ... 5
2.1.2.2 Active methods: structured light ... 8
2.1.2.3 Four step phase-shifting profilometry algorithm ... 8
2.1.2.4 Advantages and disadvantages of reconstruction methods... 10
2.2 Tissue autofluorescence ... 11
2.2.1 Fluorescence properties ... 11
2.2.2 Light propagation in biological tissue ... 12
2.2.3 Endogenous and exogenous fluorescence ... 15
2.2.4 5-aminolevulinic acid-induced protoporphyrin IX ... 17
2.2.5 Fluorescence detection during neurosurgery ... 18
2.2.5.1 Neurosurgical probes to allow point-by-point autofluorescence detection ... 18
2.2.5.2 Modified surgical microscopes in fluorescence imaging ... 22
2.2.6 Instrumentation of a fluorescence imaging system ... 23
2.2.7 Required characteristics of a intraoperative fluorescence imaging system ... 25
CHAPTER 3 SYSTEM DESIGN ... 28
3.1 Description of system components and overall functionalities ... 29
3.2 Profilometry ... 39
3.2.1 Hardware ... 39
3.2.1.1 Adapter for image detection on the microscope ocular ... 39
3.2.1.2 Adapter for image projection on the microscope ocular ... 40
3.2.1.3 Evaluation of the illumination uniformity with a fiber-coupled single mode laser vs. a multimode fiber-coupled laser ... 42
3.2.1.4 Assessment of the imaging system etendue ... 45
3.2.1.5 Overall light loss of the projection system through the microscope ... 48
3.2.2 Data acquisition software ... 48
3.3 Autofluorescence ... 51
3.3.1 Hardware: system characterization ... 51
CHAPTER 4 BRAIN SURFACE PROFILOMETRY ... 57
4.1 Methods ... 57
4.1.1 Profilometry measurements at different heights ... 57
4.1.2 Profilometry measurements at different angles ... 58
4.1.3 Tissue-like phantom measurement ... 58
4.2 Results ... 59
4.2.1 Profilometry measurements at different heights ... 59
4.2.2 Profilometry measurements at different angles ... 62
4.2.3 Tissue-like phantom measurement ... 64
CHAPTER 5 MEASUREMENT OF TISSUE AUTOFLUORESCENCE ... 65
5.1 Methods ... 65
5.1.1 Image analysis ... 65
5.1.1.1 Spatial and spectral calibration ... 65
5.1.1.2 Fluorescence normalization algorithm ... 68
5.1.2 Protocol for clinical cases for in vivo detection of autofluorescence ... 69
5.1.3 Mechanical integration of the hyperspectral system for intraoperative use ... 70
5.1.4 Intraoperative optical data acquisition parameters ... 72
5.1.5 Multimodality imaging for fluorescence and structural rendering of the surgical cavity 73 5.1.6 Data quality assessment: contrast-to-noise ratio (CNR) ... 73
5.2 Results ... 75
5.2.1 Spatial and spectral calibration ... 75
5.2.1.1 Phantoms ... 75
5.2.2 Fluorescence quantification algorithm applied to clinical data ... 82
5.2.3 Contrast-to-Noise Ratio (CNR) ... 85
CHAPTER 6 DISCUSSION ... 87
6.1 Profilometry ... 87
6.1.1 Profilometry measurements at different heights ... 87
6.1.2 Profilometry measurements at different angles ... 89
6.1.3 Tissue-like phantom measurement ... 90
6.2 Tissue autofluorescence ... 90
6.2.1 Spatial and spectral calibration ... 90
6.2.2 Fluorescence normalization technique ... 91
6.2.3 Evaluation of contrast-to-noise ratio during neurosurgical procedures ... 92
6.3 Limitations of the imaging system and possible improvements ... 93
6.4 Future applications ... 96
CONCLUSION ... 97
BIBLIOGRAPHY ... 99
APPENDICES... 116
LIST OF TABLES
Table A-1: Technical specifications of the NUVU camera [180]. ... 116 Table A-2: Technical information of the single mode laser source coupled to the projector. ... 117 Table B-1: Depth measurements obtained from patterns projected by a single mode laser. ... 118 Table B-2: Reconstruction of steps with different heights using a multimode source for the
LIST OF FIGURES
Figure 2-1: In the rectification process, there is a rearrangement in position to place the two images on the same image plane that is parallel to the baseline [39]. ... 6 Figure 2-2: The triangulation principle using two cameras consists in defining the depth (Z) of a
point (P) by forming similar triangles [37]. The change in the pixel location between the two images is in inverse proportion to Z. ... 7 Figure 2-3: Ia denotes the mean intensity value of a sine wave and Ib the peak-valley half
intensity. The axis labeled “# pixel” corresponds to the x-axis... 9 Figure 2-4: Schematics showing different light-tissue interaction mechanisms [59]. ... 13 Figure 2-5: Absorption spectrum of main chromophores in tissue along a broad range of
wavelengths [64]. ... 14 Figure 2-6: PpIX spectra of human glioblastoma tissue. The PpIX excitation maximum is shown
in blue at 410 nm and the main emission peak appears in red at 635 nm with a smaller bump at 710 nm [89]. ... 17 Figure 2-7: Molecules that emit fluorescence in brain tissue when they are excited at 375 nm
(left) and 405 nm (right) [73]. ... 20 Figure 2-8: Fluorescence of different types of tumor and of control tissue (epileptic) with
excitation at 375 nm and 405 nm [4]. ... 21 Figure 2-9: Typical light sources found in operating rooms: tungsten and halogen lamps, LEDs
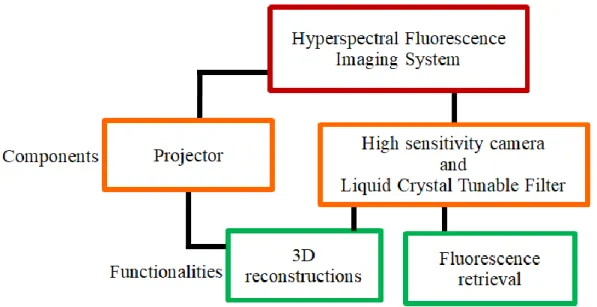
and fluorescent lights [88]. ... 27 Figure 3-1: Chart presenting the different components and functions of the system that were
developed as part of this PhD thesis. ... 28 Figure 3-2: Two different side views of the optical system developed to perform 3D
reconstruction of the brain surface through a neurosurgical microscope: a Digital Light Projector is coupled to a microscope ocular by means of an optical adapter and an imaging
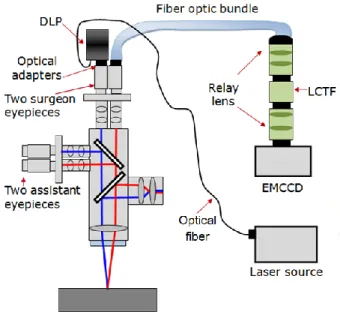
fiber optic bundle is connected to a different microscope ocular using a custom-made optical adapter. ... 29 Figure 3-3: Imaging system used during a neurosurgical procedure. The LCTF is connected to a
camera. The camera system is located at the proximal end of the bundle outside of the sterile surgical field. ... 30 Figure 3-4: Functionality 1: Imaging system design for 3D surface reconstruction of the brain by
connecting a DLP and a fiber optic bundle to the stereovision port of the neurosurgical microscope. The projector utilizes a laser source at 638 nm to project structured light onto the interrogated surface. ... 33 Figure 3-5: Functionality 2: Imaging system design for autofluorescence brain imaging. A
coherent bundle transmits images to a LCTF and a high sensitivity camera leading to the acquisition of hyperspectral images. The internal microscope blue light acts as the excitation source for tissue autofluorescence. ... 34 Figure 3-6: (A) Spectrum of the microscope blue source used to excite tissue autofluorescence.
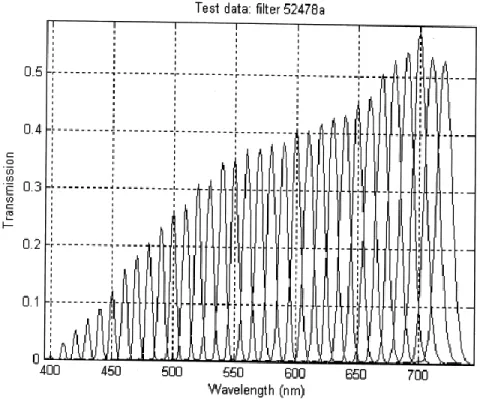
(B) The logarithmic plot of the spectrum in (A). ... 34 Figure 3-7: Imaging bundle with length of 2.7 m and a sensor format of 800 x 1000 fibers, where
each fiber measures 10 µm [126]. ... 36 Figure 3-8: Light transmission of the LCTF per wavelength. Image taken from technical
documentation of the LCTF (VariSpec). ... 37 Figure 3-9: The DMD chip (right) is formed by a micromirror array that is positioned on top of a
CMOS memory (left) that controls the tilt angle of each mirror [128]. ... 38 Figure 3-10: Left: micromirror in ‘on’ state tilted at +12 degrees. Right: ‘off’ micromirror at -12
degrees [129]. ... 38 Figure 3-11: The bundle adapter is connected to one of the microscope oculars and it captures an
Figure 3-12: Instrumentation schematics for the projector adapter. The optical components to illuminate the DMD with a magnified collimated beam are shown; and also the projection lenses to reflect the image from the DMD towards the microscope ocular. ... 42 Figure 3-13: (A) Shows an example of one of the theoretical patterns that was uploaded into the
projector. (B) The sine wave is created from gray intensity pixel values along the horizontal dotted red line traced on the pattern in (A). ... 43 Figure 3-14: Experimental setup to run a preliminary analysis for the errors associated with using
single mode vs. multimode sources. ... 44 Figure 3-15: (A) Signal created with the average intensity of each column of a sine wave pattern
produced by a single mode source. (B) Signal formed with the mean intensity of each column of an image projected by a multimode source. ... 45 Figure 3-16: The etendue is determined by the emission area of a source and the solid angle of
the light cone. For example, 100% of the light would pass from one section of the system to the next one if the ratio of their etendues (E2/ E1) was 1. ... 45
Figure 3-17: Schematic depiction of the light trajectory when illuminating the DMD. Left: first, light travels from the optical fiber to the DMD. The fiber acts as an illumination source and the DMD as a system that receives light for the calculation of a first etendue ratio. Right: light then goes from the DMD to the ocular, and a new etendue ratio should be calculated between these two elements. From this point forward, the DMD acts as a source and the microscope ocular as a system. ... 47 Figure 3-18: Sketch representing the transmission of light by every optical component in the
projection system, indicating how much light is lost at every stage. ... 48 Figure 3-19: Interface developed to synchronize projections and image acquisitions for
profilometry and to coordinate the LCTF with the EMCCD camera to save hyperspectral images for autofluorescence measurements. A live image is displayed in the right window. ... 50 Figure 3-20: The finest details that the imaging system can resolve correspond to group 1-3 of an
Figure 3-21: Each dataset corresponds to optical phantoms made with a pair of values for μa and
μ’s and a range of PpIX concentrations between .1 ng and 10 µg. The plot is linear till ~10-1
ng/ml (~40 ng/ml) suggesting that this is the detection threshold of PpIX for the new system. ... 54 Figure 3-22: The system response (H) of the through-microscope imaging system obtained with a
NIST calibration lamp. ... 56 Figure 4-1: Left: platform rotates along the x-axis. Right: platform rotates along the y-axis. ... 58 Figure 4-2: (A) Measured height of different pyramid steps as a function of the real step height.
(B) Reflectance image of one of the pyramid phantoms. The cross section of the first step is outlined; the height of this step is 4 mm. (C) The transversal area of the step selected in (B) is sketched showing the low height variability across the step. (D) The 3D-surface map of the pyramid shown in (B). ... 60 Figure 4-3: Step reconstructions with a multimode laser source. The real step height represents
the physical measurement of every pyramid step that was 3D-printed. The calculated step height is the value given by the reconstruction. ... 61 Figure 4-4: Left: pyramid that was reconstructed from patterns projected by a single mode laser.
Right: pyramid reconstructed with a multimode laser as the illumination source. The color bar represents the computed height of every step... 62 Figure 4-5: Reconstruction of side-tilt maps after rotating the platform along the x-axis. ... 62 Figure 4-6: Reconstruction of front-tilt maps built when the platform rotated along the y-axis. .. 63 Figure 4-7: Measured tilt angles as a function of the expected real angles. ... 63 Figure 4-8: (A) A solid phantom simulating the optical properties of brain tissue was made and it
was then illuminated by fringe projections of 4 by 3 cm. (B) The 3D reconstruction of the selected region in (A) is shown. ... 64 Figure 5-1: Spectrum of the microscope white lamp (Io) measured with a spectrometer. ... 66
Figure 5-2: Longpass emission filter with cut-on wavelength = 442 nm [143] to eliminate blue excitation light in fluorescence measurements. ... 68
Figure 5-3: (A) The fiber bundle is attached along the microscope arm and the microscope is draped before the procedure. (B) Hyperspectral system mounted onto an optical table at the back of the microscope for use in the operating room during surgery. (C) The bundle is long enough to achieve the proper range of rotation and motion needed with the microscope. (D) A pair of oculars with no moving parts but same optical characteristics as a Zeiss OPMI Pentero ocular pair was used as a replacement to facilitate balancing the surgical microscope. ... 71 Figure 5-4: The diagram shows that the contrast is the intensity range between the background
noise and a signal from an object under study such as a lesion. The lesion is easier to detect when the contrast between lesion and background is clearly higher than the noise variations [145], [146]. ... 74 Figure 5-5: (A) Flat block on which the calibration algorithm was tested. (B). Uncorrected image
of the flat block under white light excitation. (C) Corrected image of the flat block under white light excitation. (D) Uncorrected image of the flat block under blue excitation. (E) Corrected image of the flat block under blue excitation. ... 76 Figure 5-6: (A) Uncorrected image of PpIX in petri dish. (B) Corrected image of PpIX. (C) A
theoretical spectrum of PpIX emission together with calibrated and uncalibrated spectra retrieved from regions of 20 x 20 pixels in images of a PpIX sample. ... 77 Figure 5-7: (A) Uncalibrated reflectance image of a calf brain. (B) White light reflectance
spectrum obtained from the square region in (A). (C) Calibrated image of a calf brain in white light reflectance mode. (D) Filtered reflectance spectrum recovered from the red square in (C). ... 79 Figure 5-8: (A) Uncalibrated fluorescence image of a calf brain. (B) The average spectrum (20 x
20 pixels) of the red square region in (A). (C) Calibrated fluorescence image of a calf brain. (D) The corresponding spectrum of the square region in (C). ... 80 Figure 5-9: (A) White light diffuse reflectance image of white and gray matter in a calf brain and
the same image in RGB format. (B) Calibrated fluorescence spectra of white and gray matter. (C) Calibrated white light reflectance spectra of white and gray matter. ... 81
Figure 5-10: (A) Grayscale reflectance image when tumor is exposed at the beginning of the surgery (left) and its corresponding RGB image. (B) Overlay of autofluorescence (green) and white light reflectance recovered at the beginning of the surgery. (C) The tissue autofluorescence recorded at the beginning of the surgery is highlighted in red (left) and nine corrected autofluorescence spectra are displayed from different locations all over the highlighted area. (D) Grayscale reflectance image of brain tissue after tumor has been removed at the end of the surgery (left) and the same image converted into RGB. (E) Overlay of autofluorescence and white light reflectance detected at the end of the surgery. (F) Nine corrected spectra obtained at different points in the red-colored area (at the left) indicating the autofluorescence signature of tissue at the end of the surgery. ... 84 Figure 5-11: Images representing the sum of fluorescence intensities at all wavelengths from
which areas representing lesions (blue squares) and backgrounds (red) were selected for the calculation of the CNR. (A) Image from the beginning of the surgery with tumor exposed. (B) Image from the end of the surgery after tumor removal. ... 86 Figure C-1: The plot represents nine signals for different image coordinates of a Spectralon when
it was under blue illumination with the microscope source. These signals indicate the amplitude and spectral shape of bleed-through from the excitation source that could possibly be present in in vivo autofluorescence signals of the brain. ... 134
LIST OF SYMBOLS AND ABBREVIATIONS
ALA Aminolevulinic acid CNR Contrast-to-noise ratio CT Computer tomography DLP Digital Light Projector DMD Digital Micromirror Device EM Electron multiplication
EMCCD Electron multiplying charge-coupled device FAD Flavin adenine dinucleotide
FGS Fluorescence-guided surgery FOV Field of view
FWHM Full width at half maximum GBM Glioblastoma multiforme HbO Oxyhemoglobin
HbR Deoxyhemoglobin
H&E Hematoxylin and eosin stain ICCD Intensified charge-coupled device
IR Infrared
LED Light-emitting diode
LCTF Liquid Crystal Tunable Filter LRO Laboratory of Radiological Optics
Neuro Montreal Neurological Institute and Hospital MRI Magnetic resonance imaging
NA Numerical aperture
NADH Reduced nicotinamide adenine dinucleotide
NIR Near infrared region of the electromagnetic spectrum
nm Nanometers
ns Nanoseconds
OIR Optical index ratio PpIX Protoporphyrin IX
qFI Wide-field quantitative fluorescence imaging REB Research Ethics Board
Redox Reduction-oxidation RMSE Root Mean Square Error ROx Reduction-oxidation ratio
SFDI Spatial frequency domain imaging UV Ultraviolet
µa Absorption coefficient
µ’s Reduced scattering coefficient
LIST OF APPENDICES
Appendix A – Technical specifications of system components... 116 Appendix B – Height measurements with a single mode vs. a multimode laser ... 118 Appendix C – In vivo tissue autofluorescence ... 120
CHAPTER 1
INTRODUCTION
1.1 Motivation
In the United States, 70% of new cases of malignant primary brain tumors correspond to malignant gliomas [1]. Glioblastoma multiforme (GBM) is a type of glial tumor (grade IV) that constitutes 60-70% of malignant gliomas; only 3.3% of people who suffer from it survive 5 years and the average survival time is 1 year [1]–[3]. Meningioma is another type of tumor (WHO grade from I to III) that accounts for 20% of intracranial tumors [2].
Surgery is the most widespread treatment to treat a brain tumor [4]. The degree of tumor resection, for example, is an important factor for the evolution of a patient with a glioblastoma or meningioma [2], [5]–[11]; however, to completely remove a tumor, the boundary of the tumor region should be identified [4]. Nevertheless, gliomas infiltrate into healthy tissue making complete removal of all cancer tissue very difficult to achieve [12].
Neuronavigation systems are used to guide the surgeon during neurosurgery by showing the same brain structures that are seen in the microscope field of view (FOV) on the preoperative magnetic resonance (MRI) or X-ray (CT) images [13]. CT and MRI can be very useful for the location of a tumor and subsequent removal [14]; the drawback, however, is their lack of sensitivity to trace tumor boundaries, since cancer cells are often found outside the detected tumor margins [15]. In addition, there is an accuracy error of at least 1 cm between the recorded dimensions of the brain in preoperative images and its subsequent deformation due to craniotomy, the use of a retractor and the continuous removal of brain tissue [16]–[18].
Therefore, new tools are needed to assist surgeons in recognizing tumor margins in real time, such as fluorescence-guided surgery (FGS) [19]. Intraoperative fluorescence images can offer high contrast between healthy and cancerous tissue, as well as being safe for the patient since imaging is done using non-ionizing radiation [20], [21]. In addition, accurate delineation of the tumor can help avoid damage to healthy tissue, nerves and blood vessels [19].
Several fiber optic probes have been built for the intraoperative detection of fluorescence and to provide a means to estimate fluorophore concentrations [22], [23]. However, using a probe changes the surgical workflow, i.e., there is disruption in the procedure. Besides, probes
interrogate the tissue of interest at a single point, being unable to assess the entire resection cavity. Therefore, a wide-field imaging system integrated to a surgical microscope was presented by Valdes et al. [24]. This system takes spectral images of protoporphyrin IX (PpIX) fluorescence that results from the administration of exogenous 5-aminolevulinic acid (5-ALA).
However, even if PpIX has received increasing attention over the last decade after demonstrating preferential expression in high-grade gliomas following 5-ALA injection [5], [25]–[29], its use had not been approved in Canada at the time the research reported in this thesis was conducted. For that reason, as part of this PhD project, an imaging device, software and image analysis algorithms were developed to guide the resection of tumors during neurosurgeries through the detection of tissue autofluorescence that does not require administration of exogenous fluorescent chemical compounds. This choice, rather than putting the emphasis on PpIX detection, was not only done to ensure in-human testing of the new techniques in the thesis time-frame but also because tissue autofluorescence presents certain advantages in terms of practicality and eventual clinical use since it avoids potential problems related with regular approval of a drug in conjunction with a medical device.
The system presented in this thesis images tissue in the visible part of the electromagnetic spectrum and does so by acquiring spectroscopic data, more specifically hyperspectral datasets. This means the system is capable of creating a spectral cube of images (spatial and spectral dimensions) of the brain taken over several separate wavelength ranges, in order to capture the autofluorescence signature of brain tissue. The system design was done to ensure adaptation to one of multiple stereovision ports of a commercial clinical neurosurgical microscope also allowing the development of hardware and software for 3D reconstructions of the brain cavity. Although the fluorescence and 3D surface information were not used together as part of this thesis, their combination is essential for the quantification of fluorescence based on hyperspectral data because surface curvature is one of the factors that affect how light reflects off of biological tissue [30]. Approaches to use the 3D surface profile to correct the fluorescence intensity map of the tissue surface were developed elsewhere [22], [30] and are the subject of other projects in the Laboratory of Radiological Optics (LRO).
In summary, although the methods developed in the context of this project are applicable to other medical applications, the scope of this project is limited to do 3D reconstructions and to detect fluorescence through a microscope for neurosurgery.
1.2 Objectives and summary of technology developments
The main objective of this project is to develop a spectroscopic imaging system that allows generating the 3D shape of the cerebral cavity during surgery and to detect tissue autofluorescence through a neurosurgical microscope with minimal alteration to the standard surgical procedure for brain tumor resection. The system is versatile and it can be connected to one of the free stereovision ports of at least two different Carl Zeiss microscopes: the OPMI Pentero 900 used during neurosurgeries at the Montreal Neurological Institute and Hospital (Neuro) and the NC-4 model used for laboratory tests at the LRO, where most of the experimental work is carried out.
The different components of the system are fully controlled by a computer using a custom user interface. The interface allows the user to manipulate different image acquisition parameters and to control the projection of structured light (patterns of light specified by the user) onto the tissue, in addition to the visualization and registration of the images. Optical and mechanical design software is used to model every hardware component in order to build the system in the most optimal way.
Next, each mechanical and optical component are purchased, assembled and characterized to perform laboratory tests on tissue-simulating phantoms specially designed to quantify system performance in preparation for eventual clinical use. Then, the system is used for in vivo imaging of brain cancer in human patients at the Neuro. Finally, algorithms for spectral-spatial calibration of hyperspectral data and subsequent image analysis are developed to perform 3D reconstructions of tissue surface and recover autofluorescence.
1.3 Overview of thesis
This thesis reports on the work carried out as part of a PhD in Biomedical Engineering at the Laboratory of Radiological Optics at Polytechnique Montreal, under the direction of Professor Frederic Leblond (Department of Engineering Physics).
Following this introductory chapter, chapter 2 includes a review of literature presenting the main theoretical concepts necessary to understand the project. This includes a description of basic principles behind surface profilometry and a presentation of different profilometry methods with advantages and disadvantages. A review is provided relating to the use of profilometry in medical applications. For autofluorescence, the basic principles are presented together with an introduction to light propagation in tissue and a description of exogenous and endogenous fluorescence in clinical applications. Then, an overview is given of the current technologies for fluorescence-guided surgery, along with the key elements that fluorescence imaging systems require to detect fluorescence in the operating room.
The system design is presented in chapter 3. The technical characteristics of the optical and mechanical design of the new imaging system are described here, followed by the explanation of how the image acquisition software was programmed.
Chapter 4 explains the algorithms implemented to perform profilometry as well as each experiment that was planned to test the ability of the instrument to create three-dimensional images of structures through the neurosurgical microscope. The results for each profilometry experiment are also set out in this chapter.
Next, chapter 5 describes in detail each of the experiments carried out and the image analysis algorithms that were developed and tested to detect autofluorescence through the neurosurgical microscope. In addition, lab and clinical results are presented, the latter obtained during brain cancer surgeries.
Finally, in chapter 6 we find a critical discussion of the results obtained with the imaging system developed during this PhD. To conclude, this chapter presents the limitations of the system, possible improvements and future applications.
CHAPTER 2
REVIEW OF LITERATURE
2.1 Profilometry
2.1.1 Basic principles
3D reconstruction is the process of creating the 3D shape of an object. This process can be divided into two categories depending on the nature of the information used to retrieve heights pixel-by-pixel: (a) passive and (b) active methods [31].
Stereovision is considered a passive method, because in order to create three-dimensional images, it only needs 2D images taken by two cameras (stereo pair) placed at different viewpoints [32], [33]. 3D information is obtained from the difference or disparity (measure of the displacement of a point of interest) between the pair of images [34].
On the other hand, active methods are based on the projection of structured light (usually fringe patterns) onto a surface [31]. The fringe pattern will be deformed by the geometry of the object when it is seen from an angle that is different than that associated with the line-of-sight between the light source and the surface. The information pertaining to the shape of the object can be retrieved from the distorted light pattern [35].
2.1.2 Profilometry techniques
2.1.2.1 Passive methods: the two camera case
To perform a 3D reconstruction of an object using the passive method, one needs to first identify pixels with similar characteristics in two images of the same object acquired from cameras seeing the object from different angles. This process is called image matching [32], [36]. To simplify this task, a rectification method is applied. Rectification is the repositioning of stereo images in the same image plane, parallel to a baseline, as shown in Figure 2-1. The figure also shows that a baseline is the distance between the optical centers (point of intersection of light rays to form an image) of the two cameras [37]. This facilitates image matching because now the images have a common image plane [32] and pixel-to-pixel matching is done in just one dimension [38] given
that both pixels have, at this point, the same vertical (y-axis) location, as it is also shown in Figure 2-1.
Figure 2-1: In the rectification process, there is a rearrangement in position to place the two images on the same image plane that is parallel to the baseline [39].
3D reconstruction can be carried out by the triangulation method once rectification of the stereo pair and image matching have been done [32], [40]. As shown in Figure 2-2, to implement the triangulation technique, suppose that two images are captured by two cameras (CL and CR) with
optical centers parallel to each other. The two cameras have the same focal length (f) that corresponds to the distance from the camera lens to the focus point on the camera sensor; and the two cameras are separated from each other by a baseline (b, distance between the two cameras). The two pixels (pL and pR) of the cameras that capture the same 3D point of an object (P) are
aligned with each other; this means that same pixel rows in the two stereo images capture the same object details. Taking into account that each pixel has coordinates x (xL and xR) on a camera
sensor, and that the object is located at a horizontal distance (X) from the left camera, one can calculate the depth or vertical distance (Z) from the object to the location of the cameras by forming similar triangles [37]. From the triangles, we obtain:
and . (2-1)
Then, the disparity (d = xR - xL) between the two pixels is inversely proportional to depth [37]. If
the disparity is calculated pixel-to-pixel between the two images, one can create a disparity map that contains information about the depth of each pixel.
(2-2)
Figure 2-2: The triangulation principle using two cameras consists in defining the depth (Z) of a point (P) by forming similar triangles [37]. The change in the pixel location between the two
2.1.2.2 Active methods: structured light
As mentioned before, image matching consists in finding a pixel in the two images from different cameras that capture the same object's surface detail. This, however, is a challenge [31] because based on pixel characteristics (such as texture features and intensity) one pixel can match many other pixels [41]. The active method uses a projector to project structured light onto a sample and a camera takes an image from an angle to recover 3D-depth without having to form matching pairs. The structured light pattern with sine-shaped intensity gradients is deformed by the geometry of the sample due to the angle between camera and projector. The deformation of the light pattern due to the shape of the object is represented by a change in the phase of the sine wave intensity profile. Thus, the phase of the sine wave contains information of the height of the object. Next, the phase is computed for each pixel using the arctangent function, and this value is proportional to the surface height at an individual measurement point [35].
2.1.2.3 Four step phase-shifting profilometry algorithm
For this project, it was decided to implement the structured light method and a profilometry algorithm based on the projection of sine-wave patterns with four phase shifts instead of three. This method is called four step phase-shifting profilometry algorithm [138]. Even though a 3D image can be created from the projection of only three images, in practice more images need to be acquired, i.e., three more reference images on a flat reference surface [139]. The four step phase-shifting profilometry algorithm is less error-prone than the profilometry algorithm with three phase shifts since the averaging of four images instead of three helps to reduce noise in the 3D maps [139]. As a result, with this algorithm it is not necessary to acquire, for each reconstruction, reference images on a flat surface. This is expected to facilitate use in an operating room environment where it is impractical to take reference images as it is critical not to interrupt the flow of the surgery and to maintain a sterile surgical field.
To reconstruct a surface, four sinusoidal-intensity fringe patterns with relative π/2 radians phase shifts are projected on a surface. The resulting deformed patterns that are detected can be modeled with the following equations:
(2-4) (2-5)
(2-6) where I1, I2, I3 and I4 are the light intensities for pixel locations x and y associated with the
different phase shifts: 0, π/2, π, -π/2. Ia is a constant term or mean intensity for the four fringe
patterns and Ib is half of the peak-to-peak amplitude of the sinusoidal fringes of the four patterns
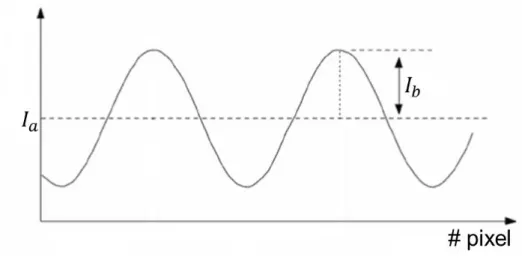
with phase ϕ. The terms Ia and Ib are illustrated in Figure 2-3.
Figure 2-3: Ia denotes the mean intensity value of a sine wave and Ib the peak-valley half
intensity. The axis labeled “# pixel” corresponds to the x-axis.
The simplification (obtained based on Eqs. 2-3 to 2-6) shown in Eq. (2-7) relate the phase (ϕ) at each pixel with the intensity of each of the four images. However, even if the phase can take any real value, it is limited to a 2π interval (between -π and +π) when the arctangent function is used to calculate it. One must then apply a phase unwrapping algorithm by means of which multiples of 2π are added to the phase in order to reconstruct the continuous phase that is not constrained between -π and +π [138]. For this project, the phase information was recovered after running a 2D phase unwrapping function in Matlab presented by Gdeisat et al. [140].
(2-7)
In order to convert pixels detected on the camera sensor to centimeters, the size of the projected pattern is measured accurately with a ruler along the x-axis to obtain an individual conversion factor (kx). Then, knowing the total length of the illuminated region along the x-axis (Lx), it is
possible to determine the length of each projected oscillation in centimeters (p):
(2-8)
where ꙍ is an integer representing the number of fringes.
Then, the height (h) is determined by multiplying the phase (ϕ) by the variable p and by a scaling factor (c) that is found with a calibration unit of known depth dimensions, like a step:
(2-9)
2.1.2.4 Advantages and disadvantages of reconstruction methods
The advantage of the structured light method over the two camera approach is that in structured light one of the two cameras is replaced by a projector. Therefore, it’s not necessary to create matching pairs like with the two camera technique. Matching pairs of images can be challenging and computationally demanding. However, the difficulty of structured light is interpreting the pattern under difficult photometric conditions, i.e., when projecting a pattern with low illuminating power [31].
Additionally, with a single structured light setup, other structured light techniques can be implemented, for example, modulated imaging [42] to calculate the optical properties of biological tissue. Indeed, it has been published that the projection of structured light with a single instrument serves two purposes: 3D reconstruction of tissue structures and retrieval of its optical properties [30]. The imaging system developed in this thesis also aims to be able to provide information on the tissue optical properties; such functionality will be addressed by another research project at the LRO.
2.1.3 Profilometry in clinical applications
In the past, some profilometry systems have been developed for clinical applications, for example, to 3D reconstruct facial gestures to relate them with signs of diseases, such as facial paralysis [43]–[45]; also to capture the movement of the heart in order to have a better understanding of problems with heart prostheses and the functioning of heart valves [46]. Moreover, 3D reconstruction techniques have also been applied to 3D endoscopy to measure cavities in biological organs [47] and in 3D otoscopy to perform quantitative measurements of the inflammation of the eardrum and thus detect middle ear disorders [48].
In addition, in the area of neurosurgery, a profilometry system has been reported in open spinal surgery to make an accurate registration between intraoperative images and the preoperative CT scan to achieve precise screw fixation for spinal fusion [49]. This system comprises two cameras mounted onto the stereovision port of a neurosurgical microscope. The same setup has been exploited to estimate brain deformation after dura opening taking as reference the preoperative MRI images [18]. The accuracy of this system is 2.21±0.31 mm in spinal surgeries [49] and 0.9–1.1 mm for the assessment of brain deformation [50]. To achieve 3D reconstructions, this setup employs the passive method where two cameras take an image of the same object from two different observation points; then, the same features in the two images are matched.
2.2 Tissue autofluorescence
2.2.1 Fluorescence properties
Luminescence is the process of emitting light when a molecule passes from a higher state of energy to a lower one. When a photon initiates the light emission process, this event is called photoluminescence. Fluorescence and phosphorescence are both in this category [51]; in both processes, a molecule is excited by incident radiation from an external light source that is absorbed by the sample [52]. The difference between fluorescence and phosphorescence lies in the timescale on which the emission occurs, being in the order of nanoseconds (ns) for fluorescence and much longer (> seconds) for phosphorescence [51]. On the contrary, when the
emission of light is triggered by a chemical reaction catalyzed by an enzyme, it is called bioluminescence; this is a special quality of living organisms [53].
Fluorescent molecules (fluorophores) are characterized by excitation and emission spectra [54]. The excitation spectrum (also called extinction coefficient) represents the relative intensity of light that is absorbed by the fluorophore at each wavelength (usually expressed in nanometers (nm) or wavenumber shifts (cm-1) with respect to the excitation wavelength) [55]. The unit of measure for the excitation spectrum at a given wavelength is cm-1 M-1, where the molarity, M, is the number of moles per liter of a fluorescent solution. The emission spectrum is independent of the excitation wavelength and represents the fluorescence intensity as a function of wavelength. In addition, the Stokes shift is the separation in frequency between the maximum point of the excitation and emission spectra of a fluorophore [54]; a small Stokes shift means that the excitation and emission occur at frequencies close to each other.
Fluorescent molecules are also characterized by their quantum efficiency (between 0 and 1), which is a measure of the relative fraction of photons absorbed by a molecule that induces fluorescence events instead of, e.g., being transformed into heat or reemitted as light through elastic or inelastic scattering [54]. Another property of fluorophores is photobleaching which is the irreversible process leading to conformational molecular changes rendering the molecules non-fluorescent after being repeatedly excited [56]. Finally, a fluorescent substance is also characterized by its lifetime. The lifetime of a fluorophore is the average time that the molecule remains in an excited state. This time scale is usually of the order of nanoseconds for both organic and inorganic fluorophores [54].
2.2.2 Light propagation in biological tissue
A number of interactions occur when light enters and propagates through biological tissue, as the composition of tissue is heterogeneous with a range of different optical properties within its volume [57], [58]. Light can be either directly reflected from the surface of the sample or it can be absorbed or scattered, as illustrated in Figure 2-4. The optical properties of the tissue are generally described by the refraction index, the absorption and scattering coefficients [59].
Figure 2-4: Schematics showing different light-tissue interaction mechanisms [59].
Scattering occurs because of changes in the refractive index of tissue [58] caused by heterogeneities associated with varying density and size of cells, organelles as well as properties of the extra-cellular matrix [59], [60]. Scattering can be either elastic or inelastic. During elastic scattering, the scattered photons keep the same energy as that of the incident photon as observed in the case of Rayleigh scattering. In inelastic scattering, such as Raman scattering, the photons interact with the vibrational modes of the molecules resulting in a loss of energy for the reemitted photons [59]. At the cellular level, the most important scatterers are the subcellular organelles, e.g., mitochondria [61].
Light penetration depth in biological tissue depends on the relative amount of light being absorbed or diffused by the tissue. The absorption of light by the tissue depends on its molecular composition, i.e., on the concentration of the main tissue absorbers usually referred to as chromophores. In the visible spectrum (390-700 nm), the most important chromophores are blood (oxy- and deoxyhemoglobin) and melanin, with absorption coefficients generally decreasing as the wavelength increases, as shown in Figure 2-5. Ultraviolet (UV, < 390 nm) absorbers are mainly proteins and amino acids, and in the infrared (IR) region, water is the dominant absorber [62]. Water absorbs light weakly in the visible and becomes increasingly important as the wavelength increases in the near-infrared (NIR) region of the electromagnetic spectrum that lies from 700 to 1200 nm. Water absorption becomes dominant at mid-infrared wavelengths (maximum at 2940 nm) [63].
Figure 2-5: Absorption spectrum of main chromophores in tissue along a broad range of wavelengths [64].
In the brain and also for most types of tissues, the most important chromophores are oxy- and deoxyhemoglobin [65]. Within the so-called therapeutic window (600-1300 nm), there is low absorption in most tissues, because hemoglobin absorption (either oxy or deoxy) decreases by several orders of magnitude from blue to red and into the NIR, as it is shown in Figure 2-5. The region where blood absorbs the least light is above 600 nm, allowing greater effective light penetration depth. In that region, scattering dominates over absorption and light becomes mostly diffuse [58]. The light absorbed by the tissue can be dissipated as heat, it can be emitted in the form of fluorescence or it can be of use in photochemical reactions [58]–[60], [66]. Each molecular process is associated with a different quantum mechanical interaction probability, with, e.g., selective absorption typically being several orders of magnitude more probable than fluorescence.
This emission of light at the same wavelength as tissue excitation is known as diffuse reflectance [61]. The reflectance signal represents a weighted average of the light having traveled at different depths and, consequently, it is an average measurement of the tissue properties within a specific volume. Diffuse reflectance provides information relating with both tissue scattering
and absorption; and alterations in tissue morphology and functional status (size and shape, concentration and oxygenation status of blood) can be used as a surrogate marker to differentiate tissue types, e.g., normal vs. cancer tissue [67]. For example, as cancer progresses, angiogenesis (formation of new blood vessels [68]) and tissue hypoxia (low oxygen in tissue [69]) affect the concentration of oxy- and deoxyhemoglobin, which in turns affect absorption; thus, optical measurement of hemoglobin through diffuse reflectance images can be also used as a surrogate measure of, e.g., angiogenesis and hypoxia. Consequently, reflectance images can detect local changes of tissue absorption and scattering; whereas, when tissues are in disease states, such as cancer, they have different biochemical composition than healthy tissues (changes in the structure of lipids, fatty acids, carbohydrates and proteins) and also altered metabolism levels [70], which results in a different fluorescence spectrum [58]. Therefore, fluorescence signals can detect changes in the biochemical composition of tissue [71].
2.2.3 Endogenous and exogenous fluorescence
In general, fluorescence techniques for the detection of brain tumors can be separated into: (a) intrinsic fluorescence (autofluorescence); and, (b) exogenous fluorescent agents targeting specific cellular processes suitable for human use, e.g., the ALA-PpIX system whereby injection of the ALA molecule triggers the preferential accumulation of the fluorescent molecule PpIX in some tumor types including glioblastoma and meningioma [72].
The fluorescence associated with endogenous tissue fluorophores is called autofluorescence [61]. In brain tissue, endogenous fluorescence is mainly due to concentrations of molecules that are involved in cell metabolism, e.g., reduced nicotinamide adenine dinucleotide (NADH) [73], lipopigments [4] and flavin adenine dinucleotide (FAD) [74].
Intrinsic fluorophores are generally excited in the wavelength range including blue and UV light where light penetration is low due to the large absorption to elastic scattering ratio. The wavelength at 375 nm, for instance, can be used to efficiently excite NADH and FAD due to their high absorption at this wavelength. In addition, the wavelength at 405 nm is useful to excite NADH, FAD and other sources of endogenous fluorescence in the brain including lipopigments, porphyrins and chlorins [4]. Despite the fact that at these excitation wavelengths autofluorescence only provides information for superficial tissue layers, fluorescence is generated without the
administration of any chemical compound, thus avoiding potential medical complications or side effects, and allowing researchers to by-pass the complexity associated with regulatory approvals for new drugs [72].
By measuring the autofluorescence spectrum, one can obtain the emission intensities of brain tissue fluorophores as well as information relating with their relative concentration allowing, e.g., to calculate metrics as the oxidation-reduction states, which can be useful for cancer detection [75]. However, an important difficulty in autofluorescence detection for in vivo brain tissue is the absorption associated with large concentrations of hemoglobin. Another challenge – when compared to using exogenous targeted markers – is that autofluorescence levels are typically much lower, namely up to 3-4 orders of magnitude in the case of the ALA-PpIX system for gliomas [51]. As a result, recovering autofluorescence signals require more sensitive light detection systems and typically longer integration times than with exogenous agents, hindering the prompt delivery of information during neurosurgery [72]. Moreover, the emission of light from biomolecules present in a variety of tumors still needs to be studied through experiments in clinical research [51], [76]. Furthermore, surprisingly, there are not enough results of human tissue autofluorescence [77], [78]; in contrast, autofluorescence in rats, mice, pigs and kidney tissue is well reported in the literature [79], [80].
Alternatively, fluorescence contrast to identify specific cells in vivo can also be produced by exogenous fluorescent molecules that are administrated to the patient. Even though exogenous markers are often easier to detect because they have distinctive emission peaks, a key design feature for exogenous fluorescent molecules that can be very challenging is their specificity to associate with diseased cells [65], [81]. When there is no specificity of association, the contrast in the image provided by a fluorophore doesn’t give useful information for identifying unhealthy tissue [81].
Finally, the accuracy of fluorescence imaging systems to detect cancer can be improved by quantifying fluorophore concentration, and this could promote the use of these instruments for the early detection of cancer [51]. This process consists of correcting the attenuation of the fluorescence signal by the different layers of tissue, the effect of light scattering and the absorption of blood to make the signal specific to concentration of fluorescent markers. Within this context, since the autofluorescence spectrum is composed of a superposition of multiple
fluorescent molecules, it is very difficult to interpret [72], and its quantification is harder than for exogenous fluorescent agents.
2.2.4 5-aminolevulinic acid-induced protoporphyrin IX
Several studies have shown that the oral or intravenous administration of 5-aminolevulenic acid (5-ALA) leads tumor tissue to accumulate higher levels of the fluorophore Protoporphyrin IX (PpIX) when compared to normal adjacent tissue [5], [82]–[85]. In addition, a multicenter Phase III clinical trial showed that PpIX helped to remove brain cancer more completely [5] and it has been demonstrated as a tool for identifying tumor boundaries [12]. However, although PpIX has apparently good sensitivity, its lack of tumor specificity has limited its general adoption in surgery, because there is evidence that PpIX also accumulates in other types of abnormal as well as normal tissue [25], [86], [87]. In addition, the main emission peak of PpIX occurs in the visible region and therefore its signal has a contribution from tissue autofluorescence [88]. Figure 2-6 shows the excitation and emission spectra of PpIX of a sample of cancerous tissue.
Figure 2-6: PpIX spectra of human glioblastoma tissue. The PpIX excitation maximum is shown in blue at 410 nm and the main emission peak appears in red at 635 nm with a smaller bump at
2.2.5 Fluorescence detection during neurosurgery
The pioneers of fluorescence neurosurgery were Japanese and German neurosurgeons, exploiting capabilities of fluorophores such as PpIX [12], together with research laboratories that worked in the conception of fluorescence-guided surgery systems [88]. Fluorescence produced through biochemical compounds can be monitored during neurosurgeries by: (a) spectroscopic probes that perform single point measurements; (b) modified surgical microscopes or independent systems developed in research laboratories [12].
2.2.5.1 Neurosurgical probes to allow point-by-point autofluorescence detection
Ideally, in neurosurgery applications it is preferable to have microscopy instruments that avoid directly contact with the tissue; however, probes that provide point measurements have a higher sensitivity to light detection since they can capture more light [90]. The depth of sampling [91], the volume of tissue to be analyzed [92] and the spatial resolution are determined by the design of the optical fiber probe [72]. To be able to quantify information, i.e., the tissue optical properties, some probes have been designed limiting their size to less than a scattering distance; while other designs take measurements at different wavelengths to eliminate the background signal from the tissue [93], [94].
Until now, perhaps, the most complete in vivo research study for the observation of tumors by means of autofluorescence also includes white light reflectance measurements by a spectroscopic probe that was used during surgery in 26 patients [95]–[97]. The procedure consisted in recording the background signal from the environment, followed by the acquisition of the emission spectrum of tissue autofluorescence with excitation at 337 nm, and the white light diffuse reflectance signal was also acquired along with biopsies in the region of interest for which histopathology analysis were performed. The analysis of the information was made post-operatively, and the fluorescence and reflectance spectra were evaluated separately. The purpose of the study was to distinguish the boundaries of infiltrated tumor into healthy tissue (100% sensitivity; 76% specificity) and to detect also high-grade tumors (sensitivity and specificity of 80% and 89%, respectively) and low-grade gliomas (sensitivity and specificity of 94% and 93%, respectively).
On the other hand, in [4] a probe was also employed for the interrogation of different types of tumors: glioblastoma, meningioma and diffuse glioma, in addition to central nervous system metastasis and epileptic tissue. Autofluorescence spectra were acquired in these tissues using excitation sources at 405 and 375 nm with the objective of calculating the ratio between the emission intensity of different molecules in order to know the metabolic reaction [98]–[100] and associate it with cancer.
As mentioned before, the brain tissue is composed of many fluorescent molecules, including: NADH [101], FAD [102], porphyrins [103], [104], lipopigments, and chlorins [4]. In [4] and [73], the contribution of each fluorophore in the emitted signal from brain tissue was estimated using a least-square approach whereby detected spectra were projected on a basis spectra associated with the individual tissue fluorophores:
(2-10) where:
St(λ): the whole measured spectrum
i: fluorophore index (i = 1 to N, with N the number of fluorophores considered in the analysis) Si(λ): individual emission spectrum of each fluorophore
fi: the factor weighting the relative contribution of each fluorophore
Figure 2-7 (right) shows that for excitation at 405 nm, five main fluorophores can be considered in the autofluorescence signal of brain tissue: NADH, flavin, lipopigments, porphyrins and chlorins. Alternatively, for excitation at 375 nm, the two primary contributions to the autofluorescence spectrum of brain tissue are NADH and flavin. However, in the total spectrum, the emission of flavin is less than 5% the emission of NADH. Therefore, for an excitation of 375 nm, most of the spectrum corresponds to NADH [73], as it can be seen in Figure 2.7 (left).
Figure 2-7: Molecules that emit fluorescence in brain tissue when they are excited at 375 nm (left) and 405 nm (right) [73].
When calculating the integral under the curve of the emission spectrum of NADH, FAD and porphyrins, two different ratios can be obtained [98], [104]: (a) the reduction-oxidation (redox) ratio (ROx), and (b) the optical index ratio (OIR). The ROx can be calculated considering the fluorescence emission of FAD and NADH [4], [105]:
(2-11)
where:
IFAD: the area under the curve of FAD emission
INADH: the area under the curve of NADH emission
The OIR can be obtained with the emission of NADH and porphyrins [4]:
(2-12)
where:
![Figure 2-1: In the rectification process, there is a rearrangement in position to place the two images on the same image plane that is parallel to the baseline [39]](https://thumb-eu.123doks.com/thumbv2/123doknet/2323101.29538/29.918.232.703.210.642/figure-rectification-process-rearrangement-position-images-parallel-baseline.webp)
![Figure 2-2: The triangulation principle using two cameras consists in defining the depth (Z) of a point (P) by forming similar triangles [37]](https://thumb-eu.123doks.com/thumbv2/123doknet/2323101.29538/30.918.290.641.429.827/figure-triangulation-principle-cameras-consists-defining-forming-triangles.webp)
![Figure 2-5: Absorption spectrum of main chromophores in tissue along a broad range of wavelengths [64]](https://thumb-eu.123doks.com/thumbv2/123doknet/2323101.29538/37.918.213.705.131.475/figure-absorption-spectrum-chromophores-tissue-broad-range-wavelengths.webp)
![Figure 2-7: Molecules that emit fluorescence in brain tissue when they are excited at 375 nm (left) and 405 nm (right) [73]](https://thumb-eu.123doks.com/thumbv2/123doknet/2323101.29538/43.918.176.745.142.360/figure-molecules-emit-fluorescence-brain-tissue-excited-right.webp)
![Figure 2-8: Fluorescence of different types of tumor and of control tissue (epileptic) with excitation at 375 nm and 405 nm [4]](https://thumb-eu.123doks.com/thumbv2/123doknet/2323101.29538/44.918.111.809.359.608/figure-fluorescence-different-types-control-tissue-epileptic-excitation.webp)
![Figure 2-9: Typical light sources found in operating rooms: tungsten and halogen lamps, LEDs and fluorescent lights [88]](https://thumb-eu.123doks.com/thumbv2/123doknet/2323101.29538/50.918.219.703.133.517/figure-typical-sources-operating-tungsten-halogen-fluorescent-lights.webp)