HAL Id: dumas-00965667
https://dumas.ccsd.cnrs.fr/dumas-00965667
Submitted on 25 Mar 2014HAL is a multi-disciplinary open access archive for the deposit and dissemination of sci-entific research documents, whether they are pub-lished or not. The documents may come from teaching and research institutions in France or abroad, or from public or private research centers.
L’archive ouverte pluridisciplinaire HAL, est destinée au dépôt et à la diffusion de documents scientifiques de niveau recherche, publiés ou non, émanant des établissements d’enseignement et de recherche français ou étrangers, des laboratoires publics ou privés.
Effects of chronic ingestion of sugar-sweetened drinks on
feeding behavior in obesity-prone and obesity-resistant
mice
Simon Benoit
To cite this version:
Simon Benoit. Effects of chronic ingestion of sugar-sweetened drinks on feeding behavior in obesity-prone and obesity-resistant mice. Sciences agricoles. 2013. �dumas-00965667�
Mémoire de Fin d'Études*
Diplôme d’Ingénieur de l’Institut Supérieur des Sciences Agronomiques,
Agroalimentaires, Horticoles et du Paysage
*Année universitaire* : 2012- 2013 Spécialité* : M2 Nutrition et Santé
Spécialisation ou option* : Microbiote intestinal
Effects of chronic ingestion of sugar-sweetened drinks on feeding behavior in obesity-prone and obesity-resistant mice.
Par : Simon BENOIT
Volet à renseigner par l’enseignant responsable de l’option/spécialisation* Bon pour dépôt (version définitive) ou son représentant
Date : …./…/… Signature Autorisation de diffusion : Oui Non
Devant le jury : Soutenu à Paris le* : 4 juillet 2013 Sous la présidence de* :
Maître de stage* : Nicolas DARCEL Enseignant référent : Daniel TOME
Autres membres du jury (Nom, Qualité) : Mme Claire Gaudichon et Mr Pierre BRIOZZO, Responsables du Master
"Les analyses et les conclusions de ce travail d'étudiant n'engagent
AGROCAMPUS OUEST CFR Rennes* 65 rue de Saint-Brieuc CS 84215 F-35042 Rennes cedex AgroParisTech
16, rue Claude Bernard 75005 PARIS
Physiologie de la Nutrition et du Comportement Alimentaire (PNCA) INRA UMR 914
16, rue Claude Bernard 75231 PARIS CEDEX 05
Forewords and acknowledgements
First, I would like to thank, Prof. Daniel TOME, and Prof. Gilles FROMENTIN, for having welcomed me in the UMR 914.
I would like to thank Nicolas DARCEL, Marion JOURNEL, Gilles FROMENTIN and Catherine CHAUMONTET for their supervision, their support, their patience and their sympathy during my internship.
I also would like to thank Sandra THEATE, Corrine DELTEIL, Patrick EVEN, Anne-Marie DAVILA, Pierre-Henri BENETTI, Olivier RAMPIN and Bierte NIELSEN for their help and advices for my work and everything else.
Finally I would like to thanks the others trainees, like Isma, Charles, Elodie, Amélie, Laure, Phédra, Juliette, and Tim, for their help, their support and motivation.
Great thanks to everybody in the laboratory for the good work and atmosphere that allowed me to have a very great time working here.
Table of contents
Forewords and acknowledgements ... 3
Table of contents ... 5
List of abbreviations ... 7
List of figures and tables ... 9
Introduction ... 11
Materials and methods ... 19
Animals ... 19
Procedure ... 19
Measurements of food and drink intake, body weight and body composition ... 21
Glucose tolerance Tests after 8 weeks of treatment ... 21
Statistical analysis ... 21
Results ... 25
Effect of the consumption of SSW for 12 weeks on weight gain ... 25
Effects of the consumption of SSW for 12 weeks on fat gain, lean gain and adiposity ... 27
Effect of the access to SSW for 12 weeks on total energy intake ... 29
Effect of the consumption of SSW on glycaemia and insulinemia ... 31
Discussion ... 33
Conclusion ... 39
References ... 41
List of abbreviations
DEXA: Dual Energy X-ray Absorptiometry DIO: Diet-Induced Obesity
HFD: High Fat Diet OP: Obesity Prone OR: Obesity Resistant
SSB: Sugar-Sweetened Beverage SSW: Sugar-Sweetened Water WD: Western Diet
List of figures and tables
Figure 1. Planning of one day of experiment. ... 18 Figure 2. Planning of the experiment ... 20 Figure 4. Effects of SSW access and WD sensitivity on body weight gain after 12 weeks. .... 24 Figure 5. Effects of SSW access and WD sensitivity on lean mass, fat mass and adiposity. ... 26 Figure 6. Effects of SSW access and WD sensitivity on total energy intake after 12 weeks.
No significant differences were observed. ... 28 Figure 7. Effects of SSW access and WD sensitivity on glycaemia after a glucose
force-feeding. Effects of drink (p<0.05), sensitivity to obesity (p<0.05) and time (0.001). ... 30 Figure 8. Effects of SSW access and WD sensitivity on plasma insulin after a glucose
force-feeding. Effects of drink (p<0.05) and time (p<0.001). ... 30 Table 1. Detailed composition of the Western Diet (WD). ... 18
Introduction
Energy intake (i.e. food intake) and energy expenditure are highly correlated to each other in long term studies [1]. This suggests that energy intake is a highly regulated physiological pathway. Moreover, humans’ food signaling pathways and thus food regulation evolved with food scarcity. For instance, our body used to need to store fat in case of lack of food [2]. Nowadays, the abundance of food and the reduction of physical activities has triggered an increase of body fat storage, and, ultimately, lead to an increase of the prevalence of obesity. Obesity has reached high levels worldwide, carrying multiple diseases such as diabetes, cardiovascular diseases, hypertension, stroke and neuropathies [3]. The ingestion of an excess of nutrient is prevented by a nutrient-sensing pathway, which detects nutrients during a meal and develops an adequate response to reduce food intake. This balance seems to be deregulated in obese patients [4], and identification of potential molecules regulating food intake has developed new target for drug development in the treatment of obesity [5].
However, it has become very clear that the ingestion of a high-fat diet (HFD) did not necessarily induce obesity in humans and in animal models. Different rodent models of predisposition and resistance to obesity have been set. Animals with a predisposition for obesity triggered by a HFD are often described as Obesity Prone animals (OP), while others do not gain more weight with an obesogenic diet compared to a “control” diet, and are described as Obesity Resistant animals (OR) [6]. Recently, Even et al. showed that rats could exhibit different phenotypes on obesity resistance in the case of a fat diet and of a high-carbohydrate diet [7]. Enriori et al. showed that after only 3 weeks of consuming a high-fat diet, OP C57BL6 mice had gained more weight than OR C57BL6 mice [8].
In recent decades, consumption of sugar-sweetened beverages (SSBs) has increased around the world. Sugar-sweetened beverages are beverages that contain added, naturally derived caloric sweeteners such as sucrose or high-fructose corn syrup. These beverages are tasty, available everywhere and inexpensive nowadays. In the United States, from 1989 to 2008, calories from sugary beverages increased by 60% in children aged 6 to 11, from 130 to 209 calories per day, and the percentage of children consuming them rose from 79% to 91% [9]. If dentists often advise patients against consumption of carbonated drinks such dietary habits may above all be linked with wider health problems. Indeed, the consumption of SSB has been linked to rising rates of obesity. Ludwig & al. (2001) found that the risk of becoming
obese in childhood was increased 1.6 fold for every sugar-sweetened drink consumed per day [10]. Moreover, in 2002, Raben & al. showed that the bodyweight of subjects who consumed large amounts of sucrose, mostly as beverages, increased [11]. This might not be surprising given the amount of sugar a can of SSB may contain (between 40 and 50 grams of sugar).
To explain how SSBs may promote obesity, different mechanisms have been suggested, including direct caloric increases, appetite stimulation, decrease of satiety signals, or adverse metabolic effects.
Sugar-Sweetened Beverages and caloric intake
First of all, SSB consumption would increase total caloric intake. Indeed, a typical 12-oz can of sugar-sweetened drink contains up to 12 or 15 teaspoons of sugar and upwards of 150 calories. If drinking SSBs leads to a decrease in food energy intake, body composition wouldn’t be changed. However, people drinking WWBs do not feel as full as if they had eaten the same amount of calories from solid food and do not compensate by eating less solid food [12], [13]. A study showed that repeated ingestions of sweetened caloric beverages (1L /day) did not induce a downward energy adjustment, even after one-month exposure [14]. Moreover, Di Meglio and Mattes, in 2000, gave men and women 450 calories a day of either soda or jellybeans for a month, then switched them for the next month and kept track of total consumption. Candy eaters ate less extra food, compensating for the extra calories from the jellybeans. On the other hand, soda drinkers did not, so they ate more calories than usual [13].
Sugar-Sweetened Beverages and satiety
Satiety is formally defined as the time interval between two meals. As mentioned before, there is a persistent notion that liquids, as compared to solids, fail to trigger physiological satiety mechanisms [13], [15], leading to a loss of control over appetite and overeating. Most studies looking at the satiety induced by beverages have measured the short-term effect of a caloric preload, ingested in the laboratory, on hunger and satiety ratings and on energy intake at the next meal. The drawback of these methods is that they may not translate dietary patterns measured in the long term. Furthermore, in many of those studies, energy adjustments after ingestion of a preload were influenced by subject characteristics, preload volume, nutrient composition, and by the interval between the preload and the test meal. These factors were often more important than whether the preload was liquid or solid [16]. At the same time, other studies suggest that solids fail to trigger satiety mechanisms, and also
lead to overeating [17]. As a result, solid fast foods [18] and beverages containing energy have been blamed, separately and together, for the obesity epidemic.
Sugar-Sweetened Beverages and body weight
However, even if some studies have been made to found the impact of SSBs on weight gain and body fat mass in mice, their results are conflicting. Some researchers report an increase in body weight associated with sucrose consumption [11], [19], [20], whereas other reports no significant impact of soft drinks consumption on body weight and fat mass [21]. In fact, the effects of sugary drinks seem to be very dependent of their mode of access, the concentration and type of sugar they contain, the duration of the study, and the complexity of associations is an emerging question, which is only partially answered yet.
Objectives
In a previous study, researchers from the lab found that C57BL/6 mice drinking sugar-sweetened water (SSW) in a restricted access (2h/day, 5days/week) for 6 weeks lead to changes in dietary behavior and to weight gain, depending on the type of diet. Mice eating a normal-fat diet and drinking SSW in a limited access didn’t gained more weight than mice eating the same diet and drinking only water. However, mice eating a high-fat diet (enriched in lard) and drinking SSW in a limited access, gained more weight than control high-fat mice drinking water. C57BL/6 mice have specific characteristic including a natural tendency to obesity, including hyperglycemia, hyperinsulinemia and hyperlipidemia [22–24]. In the same strain, Obesity-Prone and Obesity-Resistant mice can be found [8]. A new approach was to set up a new model of SSW consumption, studying its effects on Obesity Prone and Obesity Resistant mice, on a longer period of time.
Our objectives were to answer to the following questions:
- Are the effects of a restricted access to SSW consumption different in Obesity Prone and Obesity Resistant mice?
- Do the mice drinking SSWs with a restricted access eat less to compensate for the liquid energy intake?
- Would Obesity Resistant mice be able to better compensate for this liquid energy than Obesity Prone mice?
- What are the effects of SSW consumption 2h/day on food and drink consumption, on body composition?
18
Table 1. Composition of the Western Diet (WD)
Ingredients g, brut (g/kg) % of energy Milk proteins 170 13.5 Starch 254 40.8 Sucrose Soy oil 10 45 Lard 215 Mineral salts 35 0.8 Vitamins 10 Cellulose 5 Choline 2.3 Total 1000 100
Materials and methods
Animals
120 male C57Bl/6J mice (Harlan, France) aged 7 weeks and weighing 19.2±0.4 g at the beginning of the experiment, were used. Animals were housed individually in standard laboratory cages, in a temperature-controlled (22±1°C) room maintained on a reversed 12:12-hour light-dark cycle (lights from 9:30pm to 9:30am, dark from 9:30am to 9:30pm).
All animal experiments were approved by the Animal Experimentation Board at INRA Jouy-en-Josas/AgroParisTech and carried out according to the guidelines of the European Convention of Vertebrate Animals Used for Experimentation; under European Council Directive 86/609/EEC dates November 1986.
Selection
During the first week, mice had ad libitum access to standard chow and water. For the next 3 weeks, mice received a Western-Diet (WD) (Proteins: 14%, Carbohydrates: 41%, Lipids: 45%) (Table 1), served in small glass cups that contained approximately 10g of diet in form of semi-liquid to minimize the spillage. WD and water were only accessible from 9:30am till 5:30pm (Figure 1). Mice were weighed twice a week.
After this 3 weeks period, three groups of mice were defined, according to the weight they gained during this time. On 120 mice, we selected 30 Obesity Prone (OP) mice, gaining the more weight and 30 Obesity Resistant (OR) mice, gaining the less weight. The 60 other mice were used in a different experiment.
Procedure
After the selection, mice were randomly divided into four weight-matched groups: two groups of 10 mice (one of OP mice and one of OR mice) and two groups of 20 mice (one of OP mice and one of OR mice) (Figure 2).
Each group of 10 mice had access to only water (OP_Water and OR_Water). Each group of 20 mice had access to water and sugar-sweetened water (SSW) 2 hours a day during the feeding period (OP_SSW and OR_SSW). The SSW was a 12.6% weight/volume sucrose solution in water and was given randomly during the day to avoid a habituation effect.
20
Acclimatization period
Selection
period Phase 1 Phase 2 Groups
1 week 3 week 8 weeks 4 weeks
Chow diet and water Western Diet (WD) (120 mice) Obesity Prone (OP) (30 mice) SSW SSW OP_SSW (10 mice) Water OP_SSW_Water (10 mice)
Water Water OP_Water
(10 mice) Obesity Resistant (OR) (30 mice) SSW SSW OR_SSW (10 mice) Water OR_SSW_Water (10 mice)
Water Water OR_Water
(10 mice)
After an 8 weeks period, the two SSW groups were again split into two different groups. 10 mice had still access to SSW 2 hours a day. However, the 10 remaining mice were deprived of SSW and had only access to ad libitum water (OP_SSW_Water and OR_SSW_Water).
Measurements of food and drink intake, body weight and body composition Food and beverage intake of all mice were measured twice per week throughout the study. Body weight of each mouse was measured two times per week. Body composition (percentage of fat mass, percentage of lean mass) was measured using dual energy X-ray absorptiometry (DEXA) (Lunar Piximus, GE Medical System, Madison, WI, software version 1.4x Lunar) every 4 weeks. During DEXA measurement, mice were anesthetized with isoflurane.
Glucose tolerance Tests after 8 weeks of treatment
After an overnight fast (18h), samples were obtained in the morning from the tail. Blood glucose was measured using a glucometer (ONE TOUCH Vita, Life Scan Europe 6300 Zag Switzerland) at 0, 15, 30, 60 and 120 min after a glucose gavage (2mg/g). Samples (30µl of blood) were obtained at each time point to check for insulin levels by ELISA (Mercodia Mouse Insulin ELISA).
Body composition at the end of the experiment
The morning of the last day 30 mice were given a small meal in the morning (600µL of SSW). After 90 min, mice were anesthetized with Isoflurane and killed by decapitation. Another 30 mice were decapitated in a fasted state. Lungs, spleen, heart, brain, kidneys, liver and annex glands were weighed, along with fat pad and lean tissues. Brains were rapidly removed to extract hypothalamus, which was conserved and frozen in Trizol, in order to make further studies of mRNA expression. A small piece of liver was snap frozen in liquid nitrogen. All samples were stored at -80°C.
Statistical analysis
All values are expressed as mean ± SEM. Data were analyzed by two-way analysis of variance (ANOVA) for body weight change over time and food and drink intake over time. One-way ANOVA was used for final body weights, total calorie intake, feeding efficiency,
followed by Tukey’s Multiple Comparison Test. Body weight change correlation was analyzed using linear regression test. For glucose tolerance tests, areas under the curve (AUC) were calculated by trapezoid analysis and were compared by one-way ANOVA. p values inferior to 0.05 were considered statistically significant. Analyses were performed with statistical software (R).
24
Obesity-Prone mice Obesity-Resistant mice
a
a,b
b
a
a,b
b
0 2 4 6 8 10 12SSW SSW_Water Water SSW SSW_Water Water
Drink
1
2
-w
e
e
ks
w
e
ig
h
t
g
a
in
(g
)
Figure 4. Effects of SSW access and WD sensitivity on body weight gain after 12 weeks.
Effects of the sensibility to obesity (p<0.05) and of the drink (p<0.05).
Obesity-Prone mice Obesity-Resistant mice
0.0 2.5 5.0 7.5 10.0 1 2 3 4 5 6 7 8 9 10 11 12 1 2 3 4 5 6 7 8 9 10 11 12 Week W e ig h t g a in (g ) Drink SSW SSW_Water Water
Figure 3. Effects of SSW access and WD sensitivity on body weight gain over 12 weeks.
Results
Effect of the consumption of SSW for 12 weeks on weight gain
Concerning body weight gain, there was a statistical effect of the sensibility to obesity (p<0.001), of the drink (p<0.001) and of the time (p<0.001) (Figure 3). All groups of mice gained weight during the study.
After 12 weeks, the OP mice gained more weight than the OR mice (p<0.05), all drinks confounded. The results showed a greater weight gain for the SSW group compared to the two other groups in the two different types of sensibility to obesity (Figure 4). However, there is only a statistical difference between the SSW and the Water group (p<0.05).
The SSW_Water group had the same weight evolution as the SSW group during the 8 first weeks of the study. After the 8th week, when the restricted access to SSW was removed, the weight gain of this group slowed down and got closer to the Water group.
26
Obesity-Prone mice Obesity-Resistant mice
19 20 21 22 23 24 4 8 12 4 8 12 Week L e a n (g ) Drink SSW SSW_Water water
B
Obesity-Prone mice Obesity-Resistant mice
a
b
b
3 6 9 12 4 8 12 4 8 12Week
F
a
t
(g
)
DrinkSSW SSW_Water waterC
Obesity-Prone mice Obesity-Resistant mice
a
b
b
0.2 0.3 0.4 0.5 4 8 12 4 8 12 Week Ad ip o si ty (F a t ma ss / L e a n ma ss) Drink SSW SSW_Water waterFigure 5. Effects of SSW access and WD sensitivity on lean mass, fat mass and adiposity.
(A) Effect of time (p<0.001). No effects of the drink and of the sensibility to obesity. (B) Effects of the drink (p<0.05) of the sensibility to obesity (p<0.05) and of time (p<0.001). (C) Effects of the drink (p<0.05) of the sensibility to obesity (p<0.05) and of time (p<0.001).
Effects of the consumption of SSW for 12 weeks on fat gain, lean gain and adiposity
The whole mice gained lean and fat mass during the experiment, due to the diet.
Concerning body lean gain, there was an overall type effect (p<0.001) and a time effect (p<0.001). However at the end of the study, no significant differences were observed between the different groups (Figure 5A).
Concerning body fat gain, there was an overall statistical effect of the sensibility to obesity (p<0.001) and of the time (p<0.001), but no drink effect was observed. At the end of the study, drink (p<0.05) and sensibility to obesity (p<0.01) had an effect on fat gain, OP mice gaining more fat than OR mice and OR mice drinking SSW gaining more fat than OR mice having access to water (Figure 5B). A tendency is also observed for the OP mice but the difference was not significant.
Adiposity was calculated as the ratio of body fat mass, to body fat mass plus body lean mass. It’s a good indicator of obesity and weight gain, representing the percentage of fat in the body. Time (p<0.001) and sensibility to obesity (p<0.01) had an effect on adiposity. After 12 weeks of WD access, OP mice were fatter than OR mice (p<0.01) and OR mice drinking SSW were also fatter than the two other OR groups (p<0.05) (Figure 5C). Once more, the effect of drink was not significant for the OP mice.
28
Obesity-Prone mice Obesity-Resistant mice
0 20 40 60 80
Water SSW_Water SSW Water SSW_Water SSW
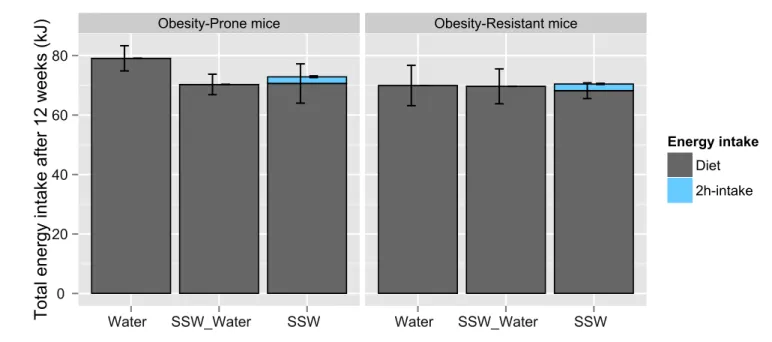
T o ta l e n e rg y in ta ke a ft e r 1 2 w e e ks (kJ) Energy intake Diet 2h-intake
Figure 6. Effects of SSW access and WD sensitivity on total energy intake after 12 weeks. No significant differences were observed.
Effect of the access to SSW for 12 weeks on total energy intake
Concerning the total energy intake, there was a statistical effect of the drink (p<0.001) and of the type (p<0.001) but no effect of time. Mice directly regulated their energy intake from the beginning of the study and no variation over time was observed.
However, at the end of the study, there were no statistical differences between groups (Figure 6). This means that all mice tended to eat the same amount of calories no matter the access to SSW and OP mice did not eat more than OR mice.
Moreover, no differences were observed concerning specifically food intake at the end of the study. Energy coming from the access to SSW seemed to represent a small part of the whole energy intake.
30
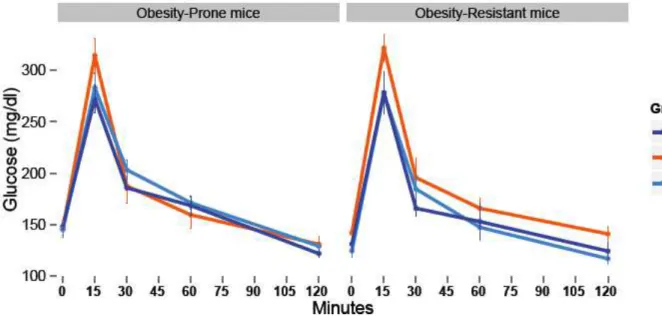
Figure 7. Effects of SSW access and WD sensitivity on glycaemia after a glucose force-feeding. Effects of drink (p<0.05), sensitivity to obesity (p<0.05) and time (0.001).
Figure 8. Effects of SSW access and WD sensitivity on plasma insulin after a glucose force-feeding. Effects of drink (p<0.05) and time (p<0.001).
Effect of the consumption of SSW on glycaemia and insulinemia
Concerning plasma glucose, there was a significant difference between the OP and the OR groups, as basal OP mice glycaemia was higher than OR mice. SSW drinking mice had a significant higher glycaemia all types of mice confounded. A tendency was observed for the SSW_Water groups but the difference was not significant. All groups had the same reaction to the oral force-feeding of glucose: glycaemia was two times higher after 15 minutes and then get back to the basal glycaemia value (Figure 7).
The consumption of SSW 2h a day also had an effect on plasma insulin values (p<0.05). Basal plasma insulin was significantly higher for the OP_SSW mice group than the two other OP groups. This difference was not significant for the OR groups. Moreover, plasma insulin was significantly higher after the force-feeding for the mice groups which had access to SSW than the two others (Figure 8). 15 minutes after the force-feeding, the plasma insulin rate of the SSW groups was almost 3 times higher than the rates of the group having only access to water. Basal plasma insulin is also significantly higher, and 2h after the force-feeding, insulin did not get back to 0mg/dL for the SSW groups compared to the Water groups.
Discussion
The goal of this study was to understand the effects of a Western Diet and a restricted access to Sugar-Sweetened Water on the feeding behavior of Prone and Obesity-Resistant mice.
During this study, all mice gained weight (coming from both lean and fat mass gain). We did not use a control-diet group in this study (mice that would have had access to a standard diet and only water), because this study focused on the effect of sugar-drinks in the context of an obesity already induced by a “western” diet. However, another study done in the same time in the lab showed that mice eating the WD gained more weight than mice eating a normal-fat diet. This seems reasonable, as the WD is known to be an obesogenic diet, and this confirms that our mice were already in an “obesogenic” environment. Despite the obvious effect of the WD, other factors seemed to have strong effects on weight gain and feeding behaviour. Indeed we found an effect of both the sensibility to the WD and the access to SSW.
Results of the selection period
This study showed that a selection period of 3 weeks with access to a Western Diet is sufficient to separate mice into two groups: Obesity-Prone and Obesity-Resistant mice, regarding to their differences in the evolution of fat and weight gain. This is in accord with a study from Enriori, who also showed that a period of 3 weeks was long enough to separate mice having different sensitivity to a high-fat diet [8].
Our selection was not only based on weight gain, but also on fat gain, using DEXA and MRI results (data not shown). This might explain why some OR mice weighed heavier than some OP mice (cf. Appendix 1). Indeed, these OP mice took more adipose tissue during the selection period, which justified that they were considered as sensitive to the WD, even if they took less weight than some OR mice. However, during the study, some mice that were considered as resistant to obesity during the selection period took more weight than mice considered sensitive to the WD, with the same nutritional treatment. Thirty more mice will be included in the study and some adjustments of the OP/OR groups might be done at the end of the study.
Effects on weight gain and body composition
The first observation was that the sensibility to obesity had an impact on body weight gain. Indeed, OP mice gained more weight and fat than OR mice. Even & al (2011) found that the difference between weight gain of Obesity Resistant and Obesity Prone rats under a high-fat diet was greater than the difference between these weight gains under a high-carbohydrate diet [7]. Thus, we chose to use a high-fat and high-carbohydrate diet to be under strong under strong obesogenic conditions so that we could see stronger differences between the weight gains of the two types of mice.
Moreover, the access to SSW had an impact on weight gain. Indeed, mice drinking SSW gained more weight than mice drinking water. This is consistent with previous results [11], [25]. Another interesting result is that the effects of SSW seemed reversible. Actually, after the first period of the study (8 weeks), half of the mice drinking SSW did not have access to SSW anymore. This seemed to rapidly slow down the weight gain, which got closer to the mice that have had only access to water since the beginning of the study, but did not completely get back to it after the end of the second period (4 weeks). Perhaps a longer period of SSB withdrawal would have shown different results.
Neither the sensibility to obesity, nor the drink access had an effect on lean mass gain. However, both types and drinks had an effect on fat mass gain and thus on adiposity. This may explain the differences of weight gain at the end of the study. Indeed the whole OP mice and the mice drinking SSW (OP_SSW and OR_SSW) might store an excess of calories due to the diet or the SSW access in the form of adipose tissue. This hypothesis will be confirmed or countered with the analysis of the energy intake. The type of adipose tissue (subcutaneous or visceral) will be next analyzed with MRI data.
Effects on energy intake
There was no difference of total energy intake between mice drinking SSW and mice drinking water, neither in OP nor in OR groups of mice. Thus, additional calories coming from SSW intake did not lead to a more important energy intake. This result could be explained by the low caloric intake provided by the drink (only 3% of the total energy intake) or by the ability of mice drinking SSW to eat less than mice drinking water to “compensate” these additional calories.
This result is in contradiction with the results of previous studies. In fact, Pan & al (2011) found that some energy from liquids may be compensated for at subsequent meals but the compensation being incomplete, it leads to an increase in total long-term energy intake [12]. The same conclusion was found by DiMeglio and Mattes (2000) who showed that liquid carbohydrate promotes positive energy balance [13]. It will be interesting to continue this experiment to see if consumption of SSW will lead, over a longer time, to an increase of total energy intake in OP and OR mice.
This countered the hypothesis mentioned before. As previously stated, the whole OP mice and mice drinking SSW (OP_SSW and OR_SSW) gained more weight in the form of fat, but did not eat more in term of calories. So, SSW consumption and sensibility to obesity might have some metabolic consequences. Further studies would confirm or counter this hypothesis.
Effects on glycaemia and insulinemia
OP mice had a higher basal glycaemia than OR mice (all drinks confounded). Mice drinking SSW also had a higher glycaemia (both sensitivity to WD confounded).
Moreover, OP mice drinking SSW had a higher basal rate of plasma insulin. This effect was not observed for the OR mice. However SSW consumption triggered higher rates of plasma insulin after glucose gavage. Sensitivity to obesity and SSW consumption might trigger a sort of insulin resistance. These effects of SSW consumption have also been reported on previous studies [26]. What is really interesting here is what seems to be a reversibility of this resistance if the access to SSW in removed.
Conclusion
The objective of this study was to determine the effects of a combined access to a Western Diet and to SSW, in a model of Obesity-Prone and Obesity-Resistant mice. A period of selection of 3 weeks was sufficient to separate mice into these two groups. However, some adjustments might be done at the very end of the study.
Moreover, total energy intake was not different between all groups. It can be explained by the ability of mice drinking SSW to eat less than mice drinking water to “compensate” these additional calories.
However, due to the higher gain of adipose tissue in both SSW groups (OP_SSW and OR_SSW) and for the whole OP mice, and the small contribution of SSW to the whole energy intake, we could make the hypothesis that SSW consumption and sensibility to obesity might have some adverse metabolic consequences.
Sensitivity to obesity (OP mice) and SSW consumption seemed to trigger a small insulin resistance.
Overall, SSW consumption seemed to have less effects on OP mice than on OR mice. In that way, the effects of SSW consumption appeared to be more important in the OR group, as the OP phenotype might reduce the effects of the SSW consumption due to its high weight gain. At last, the effects of the consumption of SSW seemed to be reversible over time in both OP and OR groups. Actually, SSW_Water mice were halfway between SSW and Water group after only 4 weeks of SSW starvation, in terms of weight gain and fat gain, and suppression of SSW access seemed to undo the insulin resistance. More time could be interested to see if SSW_Water came back to the control mice feeding behavior.
This experiment will be continued and the global metabolism of all mice will further be studied with calorimetric measurements. These measurements could show, for example, if consumption of SSW can lead to a phenomenon of hyperphagia (mice would maybe eat more after having access to SSW). At last, quantifying the expression of mRNA receptors of some neurotransmitters in the central nervous system may bring more precise information on how the chronic ingestion of all 2h-meal had an impact on the feeding central systems.
References
[1] O. G. Edholm, “Energy balance in man studies carried out by the Division of Human
Physiology, National Institute for Medical Research.,” Journal of human nutrition, vol. 31, no. 6, pp. 413–31, Dec. 1977.
[2] H. J. Grill, “Leptin and the systems neuroscience of meal size control.,” Frontiers in
neuroendocrinology, vol. 31, no. 1, pp. 61–78, Jan. 2010.
[3] C. Blouet and G. J. Schwartz, “Hypothalamic nutrient sensing in the control of energy homeostasis.,” Behavioural brain research, vol. 209, no. 1, pp. 1–12, May 2010.
[4] C. T. Montague, I. S. Farooqi, J. P. Whitehead, M. A. Soos, H. Rau, N. J. Wareham, C. P. Sewter, J. E. Digby, S. N. Mohammed, J. A. Hurst, C. H. Cheetham, A. R. Earley, A. H. Barnett, J. B. Prins, and S. O’Rahilly, “Congenital leptin deficiency is associated with severe early-onset obesity in humans.,” Nature, vol. 387, no. 6636, pp. 903–8, Jun. 1997.
[5] M. W. Schwartz, S. C. Woods, D. Porte, R. J. Seeley, and D. G. Baskin, “Central nervous system control of food intake.,” Nature, vol. 404, no. 6778, pp. 661–71, Apr. 2000.
[6] M.-A. Cornier, A. K. Salzberg, D. C. Endly, D. H. Bessesen, D. C. Rojas, and J. R. Tregellas, “The effects of overfeeding on the neuronal response to visual food cues in thin and reduced-obese individuals.,” PloS one, vol. 4, no. 7, p. e6310, Jan. 2009.
[7] P. C. Even, N. a Nadkarni, C. Chaumontet, D. Azzout-Marniche, G. Fromentin, and D. Tomé, “Identification of behavioral and metabolic factors predicting adiposity sensitivity to both high fat and high carbohydrate diets in rats.,” Frontiers in physiology, vol. 2, no. December, p. 96, Jan. 2011.
[8] P. J. Enriori, A. E. Evans, P. Sinnayah, E. E. Jobst, L. Tonelli-Lemos, S. K. Billes, M. M. Glavas, B. E. Grayson, M. Perello, E. a Nillni, K. L. Grove, and M. a Cowley, “Diet-induced obesity causes severe but reversible leptin resistance in arcuate melanocortin neurons.,” Cell
metabolism, vol. 5, no. 3, pp. 181–94, Mar. 2007.
[9] G. Lasater, C. Piernas, and B. M. Popkin, “Beverage patterns and trends among school-aged children in the US, 1989-2008.,” Nutrition journal, vol. 10, no. 1, p. 103, Jan. 2011.
[10] D. S. Ludwig, K. E. Peterson, and S. L. Gortmaker, “Relation between consumption of sugar-sweetened drinks and childhood obesity: a prospective, observational analysis.,” Lancet, vol. 357, no. 9255, pp. 505–8, Feb. 2001.
[11] A. Raben, T. H. Vasilaras, a C. Møller, and A. Astrup, “Sucrose compared with artificial sweeteners: different effects on ad libitum food intake and body weight after 10 wk of supplementation in overweight subjects.,” The American journal of clinical nutrition, vol. 76, no. 4, pp. 721–9, Oct. 2002.
[12] A. Pan and F. B. Hu, “Effects of carbohydrates on satiety: differences between liquid and solid food.,” Current opinion in clinical nutrition and metabolic care, vol. 14, no. 4, pp. 385–90, Jul. 2011.
[13] D. P. DiMeglio and R. D. Mattes, “Liquid versus solid carbohydrate: effects on food intake and body weight.,” International journal of obesity and related metabolic disorders : journal of the
International Association for the Study of Obesity, vol. 24, no. 6, pp. 794–800, Jun. 2000.
[14] V. Van Wymelbeke, M.-E. Béridot-Thérond, V. de La Guéronnière, and M. Fantino,
“Influence of repeated consumption of beverages containing sucrose or intense sweeteners on food intake.,” European journal of clinical nutrition, vol. 58, no. 1, pp. 154–61, Jan. 2004. [15] R. Mattes, “Fluid calories and energy balance: the good, the bad, and the uncertain.,”
Physiology & behavior, vol. 89, no. 1, pp. 66–70, Aug. 2006.
[16] E. Almiron-Roig, Y. Chen, and a Drewnowski, “Liquid calories and the failure of satiety: how good is the evidence?,” Obesity reviews : an official journal of the International Association
for the Study of Obesity, vol. 4, no. 4, pp. 201–12, Nov. 2003.
[17] E. Almiron-Roig, S. Y. Flores, and A. Drewnowski, “No difference in satiety or in subsequent energy intakes between a beverage and a solid food.,” Physiology & behavior, vol. 82, no. 4, pp. 671–7, Sep. 2004.
[18] a M. Prentice and S. a Jebb, “Fast foods, energy density and obesity: a possible mechanistic link.,” Obesity reviews : an official journal of the International Association for the Study of
Obesity, vol. 4, no. 4, pp. 187–94, Nov. 2003.
[19] R. B. Kanarek and N. Orthen-Gambill, “Differential effects of sucrose, fructose and glucose on carbohydrate-induced obesity in rats.,” The Journal of nutrition, vol. 112, no. 8, pp. 1546–54, Aug. 1982.
[20] V. S. Malik, M. B. Schulze, and F. B. Hu, “Intake of sugar-sweetened beverages and weight gain: a systematic review.,” The American journal of clinical nutrition, vol. 84, no. 2, pp. 274– 88, Aug. 2006.
[21] H. Jürgens, W. Haass, T. R. Castañeda, A. Schürmann, C. Koebnick, F. Dombrowski, B. Otto, A. R. Nawrocki, P. E. Scherer, J. Spranger, M. Ristow, H.-G. Joost, P. J. Havel, and M. H. Tschöp, “Consuming fructose-sweetened beverages increases body adiposity in mice.,” Obesity
research, vol. 13, no. 7, pp. 1146–56, Jul. 2005.
[22] C. C. Hu, K. Qing, and Y. Chen, “Diet-induced changes in stearoyl-CoA desaturase 1 expression in obesity-prone and -resistant mice.,” Obesity research, vol. 12, no. 8, pp. 1264– 70, Aug. 2004.
[23] M. G. Kolonin, P. K. Saha, L. Chan, R. Pasqualini, and W. Arap, “Reversal of obesity by targeted ablation of adipose tissue.,” Nature medicine, vol. 10, no. 6, pp. 625–32, Jun. 2004. [24] J. G. Lewis, D. G. Graham, W. M. Valentine, R. W. Morris, D. L. Morgan, and R. C. Sills,
“Exposure of C57BL/6 mice to carbon disulfide induces early lesions of atherosclerosis and enhances arterial fatty deposits induced by a high fat diet.,” Toxicological sciences : an official
journal of the Society of Toxicology, vol. 49, no. 1, pp. 124–32, May 1999.
[25] A. Lindqvist, A. Baelemans, and C. Erlanson-Albertsson, “Effects of sucrose, glucose and fructose on peripheral and central appetite signals.,” Regulatory peptides, vol. 150, no. 1–3, pp. 26–32, Oct. 2008.
[26] W. Nseir, F. Nassar, and N. Assy, “Soft drinks consumption and nonalcoholic fatty liver disease.,” World journal of gastroenterology : WJG, vol. 16, no. 21, pp. 2579–88, Jun. 2010.
Appendix 1: Selection period results
Figure A. Effect of the sensitivity to obesity on the evolution of weight during the selection period.
Figure B. Comparison of body weight before and after the selection period.
Diplôme : Ingénieur agronome Spécialité : M2 Nutrition et Santé
Spécialisation / option : Microbiote intestinal Enseignant référent : Daniel TOME
Auteur(s) : Simon BENOIT
Date de naissance* : 10/12/1990
Organisme d'accueil : Laboratoire de Physiologie de la Nutrition et du Comportement Alimentaire (PNCA), INRA UMR 914
Adresse : AgroParisTech, 16 rue Claude Bernard 75231 PARIS CEDEX 05
Maître de stage : Nicolas DARCEL Nb pages : 48 Annexe(s) : 1
Année de soutenance : 2013
Titre français : Effets de la consommation répétée de boissons sucrées sur le comportement alimentaire de souris résistantes ou non à l’obésité.
Titre anglais : The effects of chronic ingegstion of sugar-sweetened beverages on feeding behavior in obesity-prone and obesity-resistant mice.
Résumé (1600 caractères maximum) :
La consommation de boissons sucrées a fortement augmenté au cours des deux dernières décennies, ce qui pourrait expliquer l’augmentation de la prévalence à l’obésité dans les pays développés. Différents mécanismes peuvent expliquer les effets des boissons sucrées comme une prise calorique directe, une stimulation de la prise alimentaire, une diminution de la satiété ou des effets métaboliques adverses. Cependant, seul peu d’études se sont intéressées aux effets de la consommation de boissons sucrées sur la prise de poids et la prise de tissu adipeux, ces études présentant des résultats conflictuels. L’objectif de cette étude était de comprendre quelles pouvaient être les conséquences d’une consommation chroniques d’eau sucrée sur un modèle de souris résistante à l’obésité (souris obesity-prone/obesity-resistant).
Abstract (1600 caractères maximum) :
Consumption of soft drinks has increased markedly in the past two to three decades, and this could explain partly the prevalence of obesity in developed countries. There are different mechanisms by which soft drinks may promote obesity, such as increased caloric intake, appetite stimulation, decreased satiety signals or adverse metabolic effects. However, there is just few studies examining the effects of sugar-sweetened drinks consumption on body weight and body fat mass, and these reports have conflicting results. The objective of this study was to understand the consequences of chronic sugar-sweetened water consumption on a model of mice sensitive to obesity (Obesity-Prone/Obesity-Resistant mice).
Mots-clés :
Appetite, weight gain, binge eating, homeostatic control, animal models
*Élément qui permet d’enregistrer les notices auteurs dans le catalogue des bibliothèques universitaires