Copyright © IFAC Mathemalical and Conlrol Applications in Agriculture and Horticulture, Ihmnover, Gennany, 1997
THE QUALITY OF 'GOLDEN DELICJOUS' APPLES UY COLOUR COMPUTER VISION
V. Leemans - H. Magein - M.··F. Oestain
Faculté universitaire des Sciences agronomiques de Gembloux Passage des déportés, 2 B-S030 Gembloux Belgium
Abstract : A colour machine VISIon system was developed to form a basis for COIOUl' grading and defect inspection of 'Golden Delicious' apples. The criteria were based on European Union standards and took into account commerciai practices which add suhclasses to the basic categories. The system was able ta grade correctly more than 90% of the apples for colour (94% by using three colorimetrie p<-.rameters R,G,B or H,S,I and 91 % by using the single canonicaJ variate) and ensmed good nefect detection (russet, seah, fungi attack, etc.).
Keywords : Image ana.lysis, Image segmentation, AUlomatic recognition, Fruits, Grading.
J. rNTRODUCTION of apple images, Yang (1994) treated the detection of patch-like defects as one of catchment basin detection The classification of fruits on the basis of external in apple grey-Ievel landscape. A flooding algorithm quality requires themeasurement of colour and the was developed and completed by a snake algorithrn detection of defects (Yang and Marchand, 1995). Heineman et al. (1995) used the mean hue value to distinguish russeted and The first problem is generally ;nvestlgated by colour goud aprlë~.
machine vision. Most often, the whok info;mation
contained in the three RGB (red, green, blue) sensors The main objective of this study is to develop of the cameras is not taken into account and only one algorithms with potential to c1assify 'Golden or two channels are used to perfonn image analysis. Delicious' <'pples according to the European Singh et al. (1992) evaluated peach maturity by using standards (classes Extra, l and II). Furthermore, we Rand G values, as they estimate that B values were are interested in separating the apples into subclasses small with little variation from one peach colour class on the basis of colour as indicator of ripeness degree, to another. Tao et al. (1995) classified potatoes as it is usually performed in commercial practices. (good or green) and apples (yellow or green) by using The aim is also to detect defects. Measurements are hue feature. They transformed ,hus three perfonned with colour machine vision and it is made dimensional RGB space to one-dimensiom.ll-i space. use of the inherent correlation that exists between red,
2. THE COLOUR SPACES
Images are taken under diffuse illumination provided by two fluorescent tubes, positioned in the lower part of a horizontal reflector cylinder. The interior surface of the cylinder is painted flat white. A window at the top of the cylindrical chamber is made so that the 3-CCD camera can equire an image of the upper part of the fruit. A dark conveyor belt is chosen to provide a high contrast between the fruit and the background.
The camera acquîres colour images with three sensors R, G, B whose spectral response curves peak in the red, green and blue regions of the spectrum. The R, G, B signaIs may be transformed into HSI coordinate system. This representation is widely used since it is close to that of human perception : hue (H) is the colour frequency, saturation (S) measures the amount of grey in the colour and 1 is the luminance. Furthermore, the hue has a very important characteristic related to inspection applications because it is invariant tochanges in light intensity. Ir is obvious that colour systems carry more information than monochromatic cameras. In each case, luminance can be extracted. Furthennore, information can be obtained about the relative amount of spectral components (RGB space colour) or about the human perception of a co lour (HSI space). On the other hand, a co tour system requires processing three separate frames.
3. COLOUR DlSCRIMINATION
Grading on colour basis was studied on four lots of twenty apples taken out of storage in May 1996 and belonging respectively to categories A++, A+, A and Ar : this nomenclature is used in Belgium to differentiate apples within categories 1 into four sub classes according to their ground colour, from the greenest (A++) 10 the yellowesl (Ar). Four images of each apple were taken perpendicularly to the stalk calyx axis. The tirst image was randomly chosen and the other with 900
increments. The RGB values were measured and the image treatment may be described as follows. The resolution was reduced by three in the two orthogonal directions of the plane: one fruit corresponds thus to \0.000 to 15.000 pixels. A median tilter with a square window (5*5) was applied to remove unwanted noise (Ienticels, .. ). The background was suppressed by a threshold on the R channeL The outer part of the fruit which appears darker due to the fruit curvature was removed by erosion. This also allowed to suppress the stem. The HSI colour space was computed.
a. Population Category
=
Apple•
It~
~ Image/!:3=~
••
Pixel iiiFigure 1 : Different Jevels for the variability.
In a tirst stage, the statistical characteristics of the fruits were analysed to judge the ability of colorimetrie parameters to operate good discrimination. In the RGB or HSI space, the coloUT of a fruit is a multidimensional distribution and the colour dispersion is represented by the variances and covariances matrix.
Several levels from an image to the population have to be considered to analyse the colour variability (Fig. 1). Each of them is characterized by its mean value and by its dispersion matrix noted L. Limlapple, Lapplelea" LeatlpoP respectively represent the Lpilim, variability of the pixels within an image, the images within a fruit, the fruits within a category or the categories within the whole population. To ensure a good discrimination, the variance of the parameter musl increase as the level becomes highcr. Wilhin this scope, R, H, S,lare good parameters, since aR2,
2 2
al as . al increase from the applelcat level to the
cat!pop one. As examples, the numerical values of LappleleBI and LCBllPoP are given in Table 1.
Table 1 : Dispersion matrix - RGB and HSI coloUT spaces Matrix name RGB HSI ( 1.18 -2.21 70 53 45]
-L91~
meanr
53 51 431-2.21
16.8 7.44 LOPPlca' ~45 43 47 l-1.91 7.44 37.9, 446 184 -46 -36] 60: 184 87 32 178 139 [ 60 32 20 139 124250 200 150 100 " 50 0 R G B H S
Figure 2 : Mean and standard deviation for RGB and HSI colom parameters of the apples within the categories.
It can be seen that O'R2 equals 70 when considering
the apple within the categories and reaches 446 for the categories in the whole population,
The validity of R, H, Sand 1 as colour indicators appears also when looking at Fig, 2 which shows the evolution of the RGB and HSI parameters according to the categories, It rriay be noticed that the evolution of R, H, Sand 1is monotone, as the colour of the fruit moves from green (A++) to yeJlow (Ar). During fruit ripeness, the red colour increases as concentration in chlorophyll a decreases, This pigment is characterized by an absorption at a wavelength of 670 run, namely in the R channel frequency response spectrum, The hue value H, which designates the colour, decreases,
In a second stage, linear discriminant functions were computed to sort the fruit in the different categories A++ to Ar, according to the cla;sification performed by human operators, Either one, two or three parameters defined in both colour spaces were taken into account. The percentage of apples correctly classified is given in Figure 3,
1 0 0 , - - - ,
<- -
1 - , ~ 00 +---,,,,---r,,,,;,-f'ilI--1 t o 8) 4----1'l)'f-K:lf---l!' H' ~ 70 H1---l~I-N- .- -,11-4'1--11'1-1.1-' - ' -, ,-n
00 '1 ".lt-':-:-' . _ 1 __ ' _~ SJ +-J'A'-li:'!-=~I!i"""'lt,,' H;'Hthl:f-m--nl---IIf-J~-I~H\r~Hfll
o
~ 40 Hl:~f--j?,j~H:ilt-t~HIi'l-ii1-11*,-W-I'lr--i':H
%
:Il HU-1l,1f-tliHii;H\lH'i'I-;-t11-f'IIg- a:> ; - f -
;f( 10 ~I,-I,'••I--1' J- frll--I:'I--m--t
o"Ll:J.+l!<!L...L-4LJL.IU4-JU...kL,,=~-+,--LU::"+'-'L-=-",-,,-,.J..U
R G B H S I C R R G H H S R H V G B B S I I G S
B 1
Figure 3 : Amount of apples correctly classified with one, two or three parameters,
When considering one of the three basic parameters of the RGB space, il
appears that R is the best. This
confirms the validity of the statistical analysis presented above. The H and S considered individually are more efficient th an R for fruit grading, while 1 is somewhat worse. When considering two parameters, the precision increases in the classification, the best combinations are RB and Hl which are obtained by associating low correlated parameters, By using simultaneously the three parametersR, G, B
orH, S,l,
the percentage of fruit correclly classified reaches 94%, whatever the chosen col our space,As the R, G, B values are not independant, a canonical analysis was performed to make easier the classification (Dagnelie, 1975). The canonical variables were computed as the eigenvectors of the matrix A
where F is the factorial sum of square and products of deviates matrix, representing the variability between the categories, while E is the residual sum of square and products of deviates matrix, representing the variability within the categories, The first canonical variable CV which maximize the ratio of the variance between categories 'to the variance within the categories is used to classify the fruits, It appears that 91 % of the apples are correctly graded using this single value, Even if the accuracy is somewhat smaller than that obtained with 3 parameters (RGB or l-ISI), titis result is' very interesting, Indeed, in automatic operations, it would be easier to change the setting of a machine by adjusting one parameter rather than three,
4, DEFECT SEGMENTATIüN
The defect segmentation is based on the following princip le, ln a first slep, a model describes the normal colour of healthy apple tissues, taking into account the existing variability. In a second step, each pixel of a fruit is anaJysed : if the difference between its colour and that of the model is too high, the pixel is considered as defect.
Eighty fruits with different ripeness degrees were used to establish the modeL The resolution was reduced as in the colour study and one pixel correspond to about 0.28 mm2• A principal
component analysis wasperfonned on the whole set of data, A new coordinate system (X, Y, Z) was thus found, in which al! col our parameters were uncorrelated, These new features are linear combination of the old features and are eigenvectors of the covariance matrix of ail the pixels of the population ~pilpop' The corresponding eigenvalues are
R
B
/ 1
1/
Figure 4 : RGB space - Mean of the 320 images First two principal components.
Fig. 4 indicates the mean experimental points of each image in the RGB space and the two first principal axes X and Y; the third axis being almost perpendicular to the view is not represented.
In a further stage, a volume including ail of these points was computed. Thanks to the principal component analysis, this latter was mod~lled as_ a parallelepiped centred on the mean point ( r,
g,
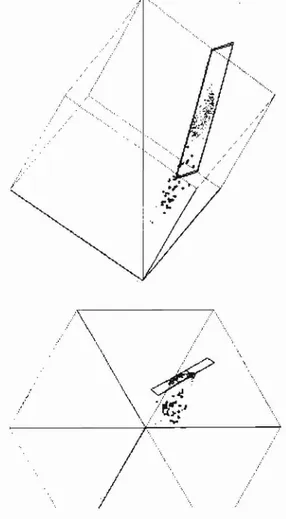
b) having its lengths proportional to the three standard deviations. Along X, Y and Z, the lengths are respectively equal to 2*c*CJx, 2*c*CJy and 2*c*CJz,where c is a coefficient that has to be adjusted. To find the most suitable value of c, a set including 33 apples affected by various defects was considered. Most defects were scars, russet, insect holes, sun scabs and bruises. The RGB coordinates of ail the pixels were transferred into the new coordinate system XYZ. After that, the value of c was chosen so that the defects pixels would be outside of the parallelepiped, as indicated on Fig. 5.
The proposed method has been tested on eighty Belgian 'Golden Delicious', containing healthy fruits and apples affected by various defects such as insects bites, scabs, russet, etc. Each coordinate of ail the pixels (x, y, z) was compared to a threshold value computed as c multiplied by the corresponding standard deviation.
If:
Ixl>
CJx * c or'Iyl
> CJy*
Cor
Izi
> CJz*
cthen the pixel is a defect. Otherwise it is sound tissue. ...' \ ..i"·'
\ /
i \ .:,.... 1\\
".~'
!i "/J",., \. ../ tl,)o:'':
...
...• i / , ....Figure 5 : RGB space with the parallelepiped including the sound tissue and excluding the bad one; left : view perpendicular to the first two principal component; right view from the l axis.
The brightest part of the fruit may be erroneously segmented as defect. This was corrected by applying a threshold on the R channel. After the segmentation, small dots like lenticels are eliminated by a morphological close filter.
Sorne results are presented in Fig. 6, where the left part is the original image, and the right part is the result of the segmentation. The damages are a scab (6a), a fungi attack (6b) and sorne russeting(6c). These blemishes are of different size"hapes and contrasts.
--Figure 6 : Samples ofapples with various defects, segmented \Vith the general model; a - scab attack; b -fungi attack; c - russeting
The main defects are correctly segmented. The patch-like defects caused by scab and the spotty defects resulting from fungi attack are identified with good accuracy. Diffuse defects presenting a irreguJar and blurred bOW1dary wich includes pixels having a colour close ta that of healthy tissue may lead ta an under segmentation. ·For example, in Fig 6c, the blemish areas due t<ri1isset are somewhat smaller than what the eye see. In ail the cases, the stalk-calyx region is identified as a defect. This problem could be solved 'in further studies by applying particular techniques of image' analysis su ch as pattern recognition.
5. CONCLUSION
Classification of 'Golden Delicious' apples reaches 94% when performing linear discriminant analysis involving the 3 R, G, 8 or H, 5, 1 parameters. The accuracy is somewhat lower (91 %) when making use of the first canonical' variate but easier machine grading settings could be obtained witll this single parameter.
Efficient defects (scabs, russet, fungi attack, ... ) segmentation is obtained by modelling sound tissues as a volume in the principal coordinate system and considering that ail defects are located outside this volume. Using this technique, further tests can be performed to classify the apples taking into account the size, shape and number of defects.
Acknowledgement
The research is founded
by
Federal Ministry ofAgriculLure of Belgium. Projeel nO D1I4
612115703 A
REFERENCES
Dagnelie P., [1975], "Analyse statistique à plusieurs variables". Les presses agronomiques de Gembloux, Gembloux.
Heinemann P.H., Varghese Z.A., Morrow CT, Sommer III H.J., Crassweller KM., [1995], "Machine vision inspection of Golden Delicious apples". Applied Engineering in Agriculture, ASAE Il (6),901-906.
Journal of European Community nO L97/19, "Norme de qualité des pommes et poires de tables" réglement CEE 920/89. 11-04-89.
Singh N., Delwiche M. 1., Johnson R.S., Thompson
J.. [1992], "Peach maturity grading with color computer vision". i992 international Summer Meeting - ASAE meeting presentation, Paper 92 3029.
Tao Y. Heinemann P.H., Varghese Z.A., Morrow C.T., Sommer III H.J., [1995J, "Machine vision inspection of potatoes and apples". Trans. of the ASAE, 38(5) /555-1561.
Yang Q., [1994J, "An approach to apple surface feature detection by machine vision". Computers and
Electronics in Agriculture II, 249-264.
Yang Q., Marchant 1. A., [1995], "Accurate blemish detection with active contour model". Computers and Eleclronics in Agriculture 14, 77-89.
![Table 1 : Dispersion matrix - RGB and HSI coloUT spaces Matrix name RGB HSI ( 1.18 -2.21 70 53 45] -L91~ mean r 53 51 43 1-2.21 16.8 7.44 LOPPlca' ~45 43 47 l-1.91 7.44 37.9, 446 184 -46 60: -36] 184 87 32 178 139 [ 60](https://thumb-eu.123doks.com/thumbv2/123doknet/6618628.180195/2.892.445.777.825.1093/table-dispersion-matrix-rgb-colout-spaces-matrix-lopplca.webp)