ScienceDirect
Procedia Engineering 199 (2017) 3109–3114
1877-7058 © 2017 The Authors. Published by Elsevier Ltd.
Peer-review under responsibility of the organizing committee of EURODYN 2017. 10.1016/j.proeng.2017.09.575
10.1016/j.proeng.2017.09.575
© 2017 The Authors. Published by Elsevier Ltd.
Peer-review under responsibility of the organizing committee of EURODYN 2017.
1877-7058 Procedia Engineering 00 (2017) 000–000
www.elsevier.com/locate/procedia
X International Conference on Structural Dynamics, EURODYN 2017
Real-scale observations of vortex induced vibrations of stay-cables
in the boundary layer
Vincent Deno¨el
a,∗, Thomas Andrianne
baStructural & Stochastic Dynamics, Department of Urban and Environmental Engineering, University of Li`ege, B-4000, Li`ege Belgium bWind Tunnel Lab, Department of Mechanical Engineering, University of Li`ege, B-4000, Li`ege Belgium
Abstract
This paper shows some records and analysis of evidences of vortex induced vibrations of very long stay cables in the atmospheric boundary layer. The considered structure is a 254-m high telecommunication antenna whose structural system is made of a light flexible metallic truss, approx. 10×10m square, which is stayed at five different levels by a set of 20 pairs of stay-cables. The exposure of this antenna is category I with a low-turbulence wind flow which results in a high sensitivity to vortex induced vibrations.The fundamental frequency of the longest cable is 0.3 Hz so that several dozens of regularly spaced natural frequencies could be observed with a sampling frequency of 500 Hz. Sufficiently long recordings allowed to distinctly observe the separate peaks corresponding to the various modes of the cables. Among them many are excited by the detachment of vortices, taking place at different frequencies (because of different cable diameters and the change of wind velocity along the height of the antenna) in the range 35-55 Hz. Referring to the so-called spectral model proposed by Vickery and Clark, the detachment of vortices takes place in a certain bandwidth, whose extent is not completely understood yet. This bandwidth is clearly observed with our long stay-cables because of the large density of mode shapes in the range [0, 200] Hz and because of their regular spacing in the spectral domain. To the author’s knowledge this constitutes a first attempt at identifying this parameter of the Vickery and Clark model from full-scale measurements.
© 2017 The Authors. Published by Elsevier Ltd.
Peer-review under responsibility of the organizing committee of EURODYN 2017.
Keywords: Type your keywords here, separated by semicolons ;
1. Introduction
Figure 1 shows some pictures and a schematic representation of a 254-m high telecommunication antenna. The antenna is made of a truss tower which is stabilized by means of 20 stay cables, arranged in five layers of four pairs of stay-cables. The five layers correspond to different fixing heights (47m, 95m, 143m, 185m, 227m). Each cable is doubled so that 40 stay-cables in total are installed in this structure. Acoustic nuisances have been reported for this antenna and a first experimental campaign has revealed that these were due to high frequency vibrations of the stay-cables. An experimental campaign has then been conducted in order to better quantify the rate of occurrence
∗Corresponding author. Tel.: +32-(0)-43662930
E-mail address: v.denoel@ulg.ac.be
1877-7058 © 2017 The Authors. Published by Elsevier Ltd.
Peer-review under responsibility of the organizing committee of EURODYN 2017. Procedia Engineering 00 (2017) 000–000
www.elsevier.com/locate/procedia
X International Conference on Structural Dynamics, EURODYN 2017
Real-scale observations of vortex induced vibrations of stay-cables
in the boundary layer
Vincent Deno¨el
a,∗, Thomas Andrianne
baStructural & Stochastic Dynamics, Department of Urban and Environmental Engineering, University of Li`ege, B-4000, Li`ege Belgium bWind Tunnel Lab, Department of Mechanical Engineering, University of Li`ege, B-4000, Li`ege Belgium
Abstract
This paper shows some records and analysis of evidences of vortex induced vibrations of very long stay cables in the atmospheric boundary layer. The considered structure is a 254-m high telecommunication antenna whose structural system is made of a light flexible metallic truss, approx. 10×10m square, which is stayed at five different levels by a set of 20 pairs of stay-cables. The exposure of this antenna is category I with a low-turbulence wind flow which results in a high sensitivity to vortex induced vibrations.The fundamental frequency of the longest cable is 0.3 Hz so that several dozens of regularly spaced natural frequencies could be observed with a sampling frequency of 500 Hz. Sufficiently long recordings allowed to distinctly observe the separate peaks corresponding to the various modes of the cables. Among them many are excited by the detachment of vortices, taking place at different frequencies (because of different cable diameters and the change of wind velocity along the height of the antenna) in the range 35-55 Hz. Referring to the so-called spectral model proposed by Vickery and Clark, the detachment of vortices takes place in a certain bandwidth, whose extent is not completely understood yet. This bandwidth is clearly observed with our long stay-cables because of the large density of mode shapes in the range [0, 200] Hz and because of their regular spacing in the spectral domain. To the author’s knowledge this constitutes a first attempt at identifying this parameter of the Vickery and Clark model from full-scale measurements.
© 2017 The Authors. Published by Elsevier Ltd.
Peer-review under responsibility of the organizing committee of EURODYN 2017.
Keywords: Type your keywords here, separated by semicolons ;
1. Introduction
Figure 1 shows some pictures and a schematic representation of a 254-m high telecommunication antenna. The antenna is made of a truss tower which is stabilized by means of 20 stay cables, arranged in five layers of four pairs of stay-cables. The five layers correspond to different fixing heights (47m, 95m, 143m, 185m, 227m). Each cable is doubled so that 40 stay-cables in total are installed in this structure. Acoustic nuisances have been reported for this antenna and a first experimental campaign has revealed that these were due to high frequency vibrations of the stay-cables. An experimental campaign has then been conducted in order to better quantify the rate of occurrence
∗Corresponding author. Tel.: +32-(0)-43662930
E-mail address: v.denoel@ulg.ac.be
1877-7058 © 2017 The Authors. Published by Elsevier Ltd.
3110 Vincent Denoël et al. / Procedia Engineering 199 (2017) 3109–3114
2 V. Deno¨el and T. Andrianne / Procedia Engineering 00 (2017) 000–000
1 2 3 4 5
Fig. 1. Schematic representation and pictures of the pylon with the four sets of stay cables, connected at five different levels.
of these vibrations, their energy content, their risk against fatigue failure, and finally to suggest mitigation means, if required. Neat vortex-induced vibrations of the stay cables have been observed in very high modes which caused the acoustic emission in the frequency range [200 − 2000] Hz.
In smooth laminar flows, vortex-induced vibrations are known to happen when there is a matching of a structural natural frequency fiand the shedding frequency, defined as
fs= USt
D (1)
where U is the mean wind speed, D is the cable diameter and St is the Strouhal number, equal to 0.2 for a circular cross-section [1,2]. The very long stay cables are such that many modes appear with the natural frequencies { fi}
corresponding to the integer multiples of the fundamental frequency. This densely populated comb of natural fre-quencies makes the matching with the Strouhal frequency rather simple, no matter the wind velocity. This explains why vortex-induced vibrations are often observed, with matching in different frequency bands, depending on the wind speed.
In turbulent flows, such as the atmospheric boundary layer, the turbulence of the atmospheric boundary layer disfavors the locking of the vortex detachment frequency to some natural frequencies. Turbulence is therefore known to reduce the occurrence of vortex-induced vibrations. Similarly, short wavelengths in the mode shape onto which the shedding frequency is locked forces the alternate detachment of vortices in phase opposition along the adjacent portions of the cable between the nodes of a mode shape. This is also known to delay the occurrence of vortex induced vibrations. In turbulent flows, vortex-induced vibrations actually take the form of random vibration, since the flow conditions are not constant nor deterministic over time and space. A seminal model, proposed by Vickery and Clark [3], then revisited in the following years [4,5] models this stochastic loading as a more or less narrow banded process in the neighborhood of the shedding frequency. The bandwidth parameter, classically noted B, takes on values around 0.3 for vertical (possibly slightly tapered) cylindrical structures. It seems that no information is available concerning long stay cables in the atmospheric boundary layer. Nevertheless, the large number of mode shapes over the possible range of vortex induced vibrations is such that they allow a very clear identification of the bandwidth parameter B, i.e. the frequency band which is excited by the vortex induced vibrations.
2. Cable properties and measurement details
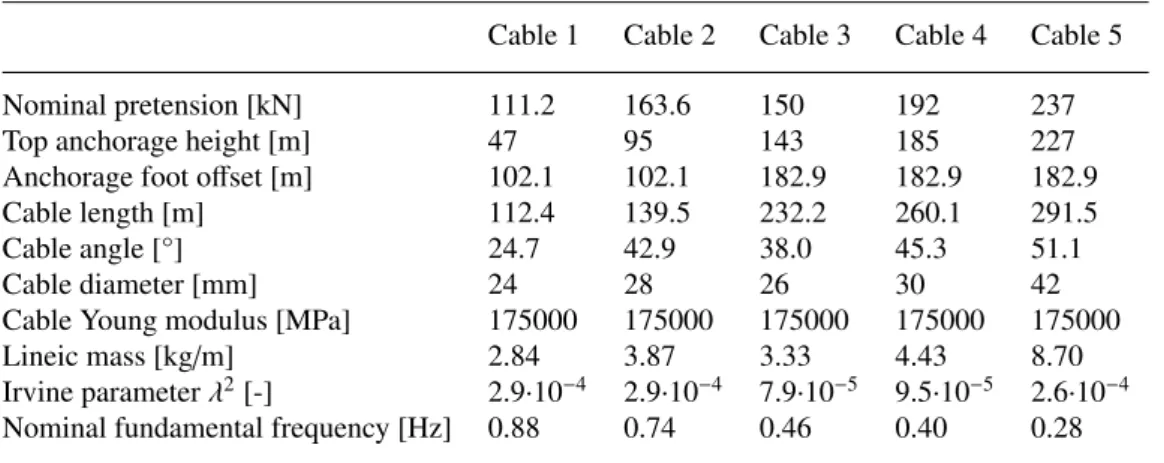
Table 1 summarizes the most important geometrical and mechanical properties of the four pairs of stay cables located in each layer of the considered antenna. Notably the diameters of the cable vary from 24mm to 42mm and the small Irvine parameters [6] of the cables indicate that they are relatively highly taught. The fundamental natural frequency, according to the string theory f1 = T/µ/(2 ) (with T the pretension, µ the mass per unit length and the cable length) ranges from 0.28 Hz to 0.88 Hz.
The ambient accelerations of the cables have been recorded by placing two mono-axial PCB sensors (Series 3711B11, 1000 mV/g, +/- 2 g) on each cable, approximately 2 meters away from the bottom anchorage, in such a way to measure the vibrations of the cable in the vertical and transverse directions, see Fig. 2. The accelerations are
Fig. 2. Sensor placement. Two PCB 3711B11 sensors are located on each anchorage of the cables. They measure the accelerations in the two directions perpendicular to the cable axis.
digitalized and logged with a National Instrument DAQ. The vibrations have been recorded during significant events but they were apparently not the most severe vibrations that the stay cables have ever supported (as reported by the operating team of the antenna). The measurements have be recorded in June 2015 under very light wind conditions and little sunshine. The data was acquired sequentially for each pair of cables. Acquisition is performed at 500 Hz.
Table 1. Main geometric and material properties of the stay-cables.
Cable 1 Cable 2 Cable 3 Cable 4 Cable 5 Nominal pretension [kN] 111.2 163.6 150 192 237 Top anchorage height [m] 47 95 143 185 227 Anchorage foot offset [m] 102.1 102.1 182.9 182.9 182.9 Cable length [m] 112.4 139.5 232.2 260.1 291.5
Cable angle [°] 24.7 42.9 38.0 45.3 51.1
Cable diameter [mm] 24 28 26 30 42
Cable Young modulus [MPa] 175000 175000 175000 175000 175000 Lineic mass [kg/m] 2.84 3.87 3.33 4.43 8.70 Irvine parameter λ2[-] 2.9·10−4 2.9·10−4 7.9·10−5 9.5·10−5 2.6·10−4
Nominal fundamental frequency [Hz] 0.88 0.74 0.46 0.40 0.28
3. Results
3.1. Modal identification of the stay cables
Figure 3 is a typical example of a time series recorded under ambient vibrations, without noticeable vortex induced vibrations, together with its power spectral density estimator. Results for two of the shortest cables (called left and right) of the same pair of cables connected at fixing height 1, 47m above ground level, are given. This example shows only one of the five 60-second time windows that have been used to provide this averaged periodogram (Welch’s method). The use of such long records offers a frequency resolution of 0.0167Hz, which is less than one tenth of the fundamental frequency of the cables. Each time window is therefore sufficiently long to resolve the different natural frequencies. Indeed, Figure 3 clearly shows the comb of closely and regularly spaced natural frequencies, which is typical of cable vibrations [7,8]. The more important peaks in the low-frequency range, below 5Hz, might be attributed to the buffeting action of wind. The slowly varying amplitude in the power spectral density peaks results from the position of the sensor with respect to the nodes and anti-nodes of the mode shapes. When ideal pinned-pinned boundary conditions are really materialized, analytical solutions allow compensating for this effect; in this case, this
3112 Vincent Denoël et al. / Procedia Engineering 199 (2017) 3109–3114
4 V. Deno¨el and T. Andrianne / Procedia Engineering 00 (2017) 000–000
Time 12:20:30 12:20:40 12:20:50 12:21:00 12:21:10 12:21:20 0 0.5 1 Accelerations - Layer 1 [g] Frequency [Hz] 0 20 40 60 80 100 120 10-5
Spectrum Left-yLeft-z
Right-y Right-z Frequency [Hz] 0 5 10 15 20 25 30 10-8 10-4 100 Zoom
Fig. 3. Typical example of recorded acceleration (sampling frequency=500 Hz) and averaged periodogram computed with 4096 points on the range [0,250] Hz.
compensation was not possible because of massive pieces of equipment located in the span which are responsible for the short boundary layers taking place close to the cable ends [9,10].
More than one hundred peaks are clearly identifiable in the power spectral density of the measured acceleration on these cables of the first layer, which provides are very robust identification of the natural frequency of each cable, by means of a simple average distance between two successive peaks. This operation is repeated for the cables of layers 1 to 5, and yields the results given in Table 2. The fundamental frequency of the longest cable is much lower so that almost four times more peaks are actually available to identify the fundamental natural frequency in cables of the fifth layer. Notice that the bottom plot in Figure 3 indicates a slight difference in the natural frequencies of the two cables of the same pair; only average values are given in Table 2.
Table 2. Average identified natural frequencies of the cables (no wind conditions) and Strouhal frequencies.
Cable 1 Cable 2 Cable 3 Cable 4 Cable 5 Natural frequency 1.04 Hz 0.81 Hz 0.48 Hz 0.35 Hz 0.28 Hz Strouhal frequency - n/a - - n/a - 53.8 Hz 46.7 Hz 33.3 Hz
3.2. Vortex-induced vibrations of the top 3 layers
Significant vortex induced vibrations were observed and measured for the top 3 layers. The vertical acceleration of the cable could reach 0.5g peak-to-peak for some cables of layers 3, 4 and 5. In Figure 4, the acceleration in the vertical plane (z) is much larger than in the horizontal plane (y), which is expected for vortex induced vibrations. The power spectral density shown in Figure 4 is an average of 10 periodograms obtained on 60-second windows each. Each cable exhibits significant vibrations in various frequency bands whose centers correspond to the Strouhal frequency of the cable, for instance between 30Hz and 35 Hz for cable 5. These frequencies are also reported in Table 2.
Fig. 4. Measured accelerations on Cables 3, 4 and 5 during vortex induced vibrations.
Notice that maximum recorded amplitudes in cable 5 reached 1 g peak-to-peak at 40 Hz, i.e displacements of 0.16 mm peak-to-peak. A video shot on the day after this measurement campaign showed vibrations with visible amplitude, probably of the order of a couple of millimeters.
Another way to represent the recorded vibration during these significant vortex induced vibrations, is to recourse to short time Fourier transforms, as shown in Figure 5. In this figure, 60 spectrograms on 60-second time windows are represented for scaled frequencies ranging on the interval [0; 3]. The frequency is reduced by a vortex shedding frequency (Equation 1) with St = 0.2, U = 7m/s and D corresponding to the cable diameter (Table 1). The choice of a constant velocity U, identical to all three cables, is to compensate for a lack of measurement on the site, during the vortex induced events. Nevertheless, it is seen in the spectrograms that, with this choice of equivalent/average frequency, the frequency content of the cable vibration is relatively well centered on a unit reduced frequency.
More importantly, the bandwith of the vortex induced vibration is clearly identifiable from those recordings. The cable being excited with very low amplitudes, the nonlinear coupling is expected to be negligible and the cable might be seen as a series of dozens of independent oscillators and, again, the visible peaks in Figure 5 are actually composed of a sequence of closely and uniformly spaced peaks. This wonderful sequence of observers, ready to be activated by the vortex induced vibration (or not), is the perfect way to identify the bandwidth in which the alternate detachment of vortices may interact with the cables. These plots indicate that the bandwidth in which vortex shedding occurs is approximately centered on the shedding frequency (the mistuning here might be attributed to the wind velocity, arbitrary chosen equal to 7m/s) and with a spread of approximately 25%-30% of the shedding frequency. This observation is very similar to the recommendation of Vickery and Clarck for slightly tapered chimneys [3].
4. Conclusions
This paper reports the clear evidences of vortex induced vibrations on several very long stay cables in the atmo-spheric boundary layer. Because of the presence of many natural modes with closely and uniformly spaced natural frequencies, such long stay cables are the perfect way to observe the limits of the bandwidth of the excitation asso-ciated with vortex-induced vibrations. In particular, these observations have revealed that the relative bandwidth was approximately equal to 30% of the vortex shedding frequency.
3114 Vincent Denoël et al. / Procedia Engineering 199 (2017) 3109–3114
6 V. Deno¨el and T. Andrianne / Procedia Engineering 00 (2017) 000–000
Fig. 5. Periodogram of the acceleration measured in cables 3, 4 and 5 over 60 1-minute time windows. The frequency axis is scaled by the Strouhal frequency of each cable as given in Table 2. The wide black zones indicate the bandwidth of the vortex induced excitation.
References
[1] Dyrbye, C., Hansen, S. O. (1997). Wind loads on structures. (J. W. & Sons, Ed.). Chichester, England: John Wiley & Sons. [2] Simiu, E., Scanlan, R. (1996). Wind Effects On Structures (3rd ed.). New-York: John Wiley and Sons.
[3] Vickery B.J., Clark A.W. (1972), Lift or across-wind response of tapereds tacks, ASCE J. Struc Div, ST1, 98, pp. 1-20.
[4] Vickery B.J., Basu R.I. (1983), Across-wind vibrations of structures of circular cross section, Parts I & 2, J. Wind Eng Ind Aero, 12, pp. 49-97 [5] Blackburn H.M., Melbourne W.H., (1991), Lift on an oscillating cylinder in smooth and turbulent flow, in Proc. 8th Int Conf Wind Eng., London
Ontario, paper 17-2.
[6] de Sa Caetano, E. (2007). Cable vibrations in cable-stayed bridges. (I. A. for B. and S. Engineering, Ed.) Structural Engineering Document. IABSE-AIPC-IVBH.
[7] Lilien, J. L. (2007). 7th International Symposium on Cable Dynamics. In ISCD (Ed.), 7th International Symposium on Cable Dynamics. Vienna (Austria).
[8] Lilien, J. L. (2009). 8th International Symposium on Cable Dynamics. In ISCD (Ed.), 8th International Symposium on Cable Dynamics. Paris (France).
[9] Canor, T., Deno¨el, V. (2013). Vibrations of cables with bending stiffness by an asymptotic approach. In Structural Engineering and Mechanics Conference (pp. 189–194). Cape Town, South Africa.
[10] Deno¨el, V., Detournay, E. (2010). Multiple Scales Solution for a Beam with a Small Bending Stiffness. Journal of Engineering Mechanics, 136 (1), p. 69-77.

![Fig. 3. Typical example of recorded acceleration (sampling frequency=500 Hz) and averaged periodogram computed with 4096 points on the range [0,250] Hz.](https://thumb-eu.123doks.com/thumbv2/123doknet/6547202.176469/4.816.186.639.102.425/typical-recorded-acceleration-sampling-frequency-averaged-periodogram-computed.webp)
![Fig. 3. Typical example of recorded acceleration (sampling frequency=500 Hz) and averaged periodogram computed with 4096 points on the range [0,250] Hz.](https://thumb-eu.123doks.com/thumbv2/123doknet/6547202.176469/5.816.166.656.109.459/typical-recorded-acceleration-sampling-frequency-averaged-periodogram-computed.webp)

