Characterization of Carotid Plaques with
Ultrasound Non-Invasive Vascular Elastography
(NIVE): Feasibility and Correlation with
High-Resolution Magnetic Resonance Imaging
par Cyrille Naïm
Programme de Sciences biomédicales Faculté de médecine
Mémoire présenté à la Faculté de médecine en vue de l’obtention du grade de
Maîtrise en Sciences biomédicales, option recherche
Mars, 2013
Faculté des études supérieures et postdoctorales
Ce mémoire intitulé :
Characterization of Carotid Plaques with Ultrasound Non-Invasive Vascular Elastography (NIVE): Feasibility and Correlation with
High-Resolution Magnetic Resonance Imaging
présenté par : Cyrille Naïm
a été évalué par un jury composé des personnes suivantes :
Alain Rivard, président-rapporteur Gilles Soulez, directeur de recherche
Guy Cloutier, co-directeur Oury Monchi, membre du jury
RÉSUMÉ
L’accident vasculaire cérébral (AVC) est une cause principale de décès et de morbidité dans le monde; une bonne partie des AVC est causée par la plaque d’athérosclérose carotidienne. La prévention de l’AVC chez les patients ayant une plaque carotidienne demeure controversée, vu les risques et bénéfices ambigus associés au traitement chirurgical ou médical. Plusieurs méthodes d’imagerie ont été développées afin d’étudier la plaque vulnérable (dont le risque est élevé), mais aucune n’est suffisamment validée ou accessible pour permettre une utilisation comme outil de dépistage. L’élastographie non-invasive vasculaire (NIVE) est une technique nouvelle qui cartographie les déformations (élasticité) de la plaque afin de détecter les plaque vulnérables; cette technique n’est pas encore validée cliniquement. Le but de ce projet est d’évaluer la capacité de NIVE de caractériser la composition de la plaque et sa vulnérabilité in vivo chez des patients ayant des plaques sévères carotidiennes, en utilisant comme étalon de référence, l’imagerie par résonance magnétique (IRM) à haute-résolution. Afin de poursuivre cette étude, une connaissance accrue de l’AVC, l’athérosclérose, la plaque vulnérable, ainsi que des techniques actuelles d’imagerie de la plaque carotidienne, est requise.
Trente-et-un sujets ont été examinés par NIVE par ultrasonographie et IRM à haute-résolution. Sur 31 plaques, 9 étaient symptomatiques, 17 contenaient des lipides, et 7 étaient vulnérables selon l’IRM. Les déformations étaient significativement plus petites chez les plaques contenant des lipides, avec une sensibilité élevée et une spécificité modérée. Une association quadratique entre la déformation et la quantité de lipide a été trouvée. Les déformations ne pouvaient pas distinguer les plaques vulnérables ou symptomatiques.
En conclusion, NIVE par ultrasonographie est faisable chez des patients ayant des sténoses carotidiennes significatives et peut détecter la présence d’un cœur
lipidique. Des études supplémentaires de progression de la plaque avec NIVE sont requises afin d’identifier les plaques vulnérables.
Mots-clés : Accident vasculaire cérébral (AVC), Plaque de l’artère carotidienne, Plaque d’athérosclérose, Élastographie, Ultrasonographie, Élastographie Non-invasive Vasculaire (NIVE), Imagerie par résonance magnétique (IRM), cœur lipidique.
ABSTRACT
Stroke is a leading cause of death and morbidity worldwide, and a significant proportion of strokes are caused by carotid atherosclerotic plaque rupture. Prevention of stroke in patients with carotid plaque poses a significant challenge to physicians, as risks and benefits of surgical or medical treatments remain equivocal. Many imaging techniques have been developed to identify and study vulnerable (high-risk) atherosclerotic plaques, but none is sufficiently validated or accessible for population screening. Non-invasive vascular elastography (NIVE) is a novel ultrasonic technique that maps carotid plaque strain (elasticity) characteristics to detect its vulnerability; it has not been clinically validated yet. The goal of this project is to evaluate the ability of ultrasound NIVE strain analysis to characterize carotid plaque composition and vulnerability in vivo in patients with significant plaque burden, as determined by the reference standard, high resolution MRI. To undertake this study, a thorough understanding of stroke, atherosclerosis, vulnerable plaque, and current non-invasive carotid plaque imaging techniques is required.
Thirty-one subjects underwent NIVE and high-resolution MRI of internal carotid arteries. Of 31 plaques, 9 were symptomatic, 17 contained lipid and 7 were vulnerable on MRI. Strains were significantly lower in plaques containing a lipid core compared to those without lipid, with high sensitivity and moderate specificity. A quadratic fit was found between strain and lipid content. Strains did not discriminate symptomatic patients or vulnerable plaques.
In conclusion, ultrasound NIVE is feasible in patients with significant carotid stenosis and can detect the presence of a lipid core. Further studies of plaque progression with NIVE are required to identify vulnerable plaques.
Keywords: Stroke, Carotid Artery Plaque, Atherosclerotic Plaque, Elastography, Ultrasound, Non-Invasive Vascular Elastography (NIVE), Magnetic Resonance Imaging (MRI), lipid core.
TABLE OF CONTENTS
RÉSUMÉ ... vi
ABSTRACT ... viii
TABLE OF CONTENTS ... x
LIST OF TABLES ... xiii
LIST OF FIGURES ... xv
LIST OF ABBREVIATIONS ... xxvi
DEDICATION ... xxx
ACKNOWLEDGEMENTS ... xxxi
SECTION I: Clinical Perspectives on Ischemic Stroke and Carotid Atherosclerosis ... 1
CHAPTER 1: Stroke, a Cerebrovascular Disease ... 3
1. Stroke, a cerebrovascular disease ... 4
1.1. Background ... 4
1.2. Anatomy and Physiology ... 4
1.3. Pathophysiology ... 9
1.4. Etiology ... 11
1.5. Epidemiology, Risk Factors, Prognosis, and Cost ... 16
1.6. Clinical Presentation ... 17
1.6.1. History... 17
1.6.2. Physical Examination... 19
1.7. Differential diagnoses ... 22
1.8. Workup ... 23
1.9. Treatment: Primary and Secondary Prevention ... 28
1.10. Carotid Atherosclerosis ... 29
1.10.1. Treatment limitations and current issues: a need for diagnostic tools in asymptomatic patients ... 33
CHAPTER 2: Atherosclerosis and the Vulnerable Plaque ... 37
2. Atherosclerosis and the Vulnerable Plaque ... 38
2.1. Overview ... 38
2.2. Epidemiology ... 38
2.3. Normal Structure and Function of Arteries ... 39
2.4. Pathogenesis of Atherosclerosis ... 42
2.4.1. Cellular interactions in atherosclerosis plaque progression ... 43
2.5. The Vulnerable Plaque ... 48
2.6. Clinical Consequences ... 53
2.7. Prevention ... 54
CHAPTER 3: Imaging Carotid Atherosclerotic Plaque ... 57
3. Imaging Carotid Atherosclerotic Plaque ... 58
3.1. Introduction to the manuscript ... 58
3.1.1. A brief overview of basic principles of ultrasound, CT, and MR imaging ... 58
a) Ultrasound ... 58
b) Elastography ... 59
c) Computed Tomography ... 60
d) Magnetic Resonance Imaging ... 62
3.1.2. Role of authors ... 64
3.2. Review article manuscript submitted to CARJ ... 65
a) Abstract ... 65
b) Introduction ... 66
c) The Vulnerable Atherosclerotic Plaque ... 67
d) Pathophysiology of atherosclerosis ... 70
i. Endothelial activation and leukocyte recruitment ... 70
ii. Atheroma formation ... 71
iii. Vulnerable Plaque: From Asymptomatic Atheroma to Culprit Plaque ... 71
e) US, MDCTA and MRI features of plaque vulnerability ... 72
i. Ultrasound ... 72
Two-Dimensional B-mode US imaging ... 73
Three-Dimensional B-mode US Imaging ... 78
Contrast-enhanced US ... 79
Non-Invasive Vascular Elastography by Ultrasound ... 81
ii. Multidetector computed tomography angiography (MDCTA) ... 84
Macrophage-Designed Nanoparticle Contrast Agents .... 88
iii. High-Resolution Magnetic Resonance Imaging (MRI) .... 89
MRI Technique and Reproducibility ... 94
Inflammation, Neovascularisation and Contrast-enhanced MRI ... 95
Molecular MRI ... 95
Clinical and future perspectives ... 96
SECTION II. Characterization of Carotid Plaques with Ultrasound Non-Invasive Vascular Elastography: Feasibility and Correlation with
High-Resolution Magnetic Resonance Imaging ... 99
CHAPTER 4: Characterization of Carotid Plaques with Ultrasound Non-Invasive Vascular Elastography (NIVE): Feasibility and Correlation with High-Resolution MRI ... 101
4. Characterization of Carotid Plaques with Ultrasound NIVE: Feasibility and Correlation with High-Resolution MRI ... 102
4.1. Introduction to manuscript ... 102
4.1.1. Role of authors ... 104
4.1.2. Thesis Format of Submitted Manuscript... 106
4.2. Manuscript submitted to European Radiology ... 107
Title Page ... 108 Abstract ... 110 Introduction ... 113 Methods ... 114 Results ... 123 Discussion ... 137 Acknowledgments ... 141 References ... 142
4.3. Further discussion and future perspectives ... 149
4.3.1. Study Methodology ... 149
4.3.2. Quadratic Correlation ... 155
4.3.3. Clinical Correlations ... 155
4.3.4. US Elastography Technical Optimization ... 156
4.3.5. Final Conclusion ... 157
SECTION III. REFERENCES ... 159
SECTION IV. APPENDICES ... xxxiii
Appendix 1: NIH Stroke Scale ... xxxiv Appendix 2: Modified Rankin Scale ... xl Appendix 3: Follow-up Questionnaires and Forms ... xli
LIST OF TABLES
Table I-I: Common Causes of Cerebral IschemiaTable I-II: Risk Factors for ischemic stroke
Table I-III: Differential diagnosis of acute ischemic stroke.
Table II-I: Modified AHA classification of atherosclerotic plaques
Table II-II: Criteria Defining Vulnerable Atherosclerotic Plaque. Presence of at least one major criterion qualifies a plaque as vulnerable. Adapted from data published in reference (33).
Table III-I: Criteria Defining Vulnerable Atherosclerotic Plaque
Table III-II: Modified AHA classification
Table III-III: Hounsfield values (HU) for each plaque component as determined by in-vivo MDCTA studies (mean ± SD)
Table III-IV: Modified AHA classification for MDCTA (123) and MRI (131)
Table III-V: Relative Signal Intensity of Plaque Components on MRI
Table IV-I: Population Clinical Characteristics
Table IV-III: Bivariate Associations between Strain Parameters and Clinical Factors
LIST OF FIGURES
Figure 1.1: Left lateral view of the brain. Each part of the brain identified serves a specific function. Adapted and modified from: Morton DA, Foreman KB, Albertine KH. The Big Picture: Gross Anatomy, 1st edition: www.accessmedicine.com.
Figure 1.2: A. Lateral and B. coronal views of extracranial and intracranial arteries. A: The common carotid artery bifurcates into the external and internal carotid artery. The external carotid supplies blood to the face. The internal carotid supplies the anterior part of the brain. The vertebral artery arises from the subclavian artery, and supplies the posterior part of the brain. B: The anterior and posterior circulations are linked through the posterior communicating artery (Post. Comm.), forming the Circle of Willis (highlighted in dark red). This architecture provides collateral circulation of blood in case of obstruction in one of the major intracranial arteries. The pink arrow demonstrates the direction of blood flow arising from the heart. ACA = Anterior cerebral artery; Ant. Comm.= Anterior communicating artery; MCA = Middle cerebral artery; PCA = Posterior cerebral artery; ICA = Internal carotid artery; ECA = External carotid artery; CCA = Common carotid artery; SCA = Superior cerebellar artery; AICA = Anterior Inferior cerebellar artery; PICA = Posterior inferior cerebellar artery; a.= artery. Figure 1.2A adapted and modified from Longo DL, Fauci AS, Kasper DL, Hauser SL, Jameson JL, Loscalzo J. Harrison’s Principles of Internal Medicine, 18th edition: www.accessmedicine.com. Figure 1.2B adapted and modified from: Andreoli TE, Carpenter CCJ, Griggs RC, Loscalzo J. Cecil Essentials of Internal Medicine, 6th edition: consulted on CD-ROM.
Figure 1.3: Blood supply to the brain by arterial territory. Adapted and modified from Longo DL, Fauci AS, Kasper DL, Hauser SL, Jameson JL, Loscalzo J. Harrison’s Principles of Internal Medicine, 18th edition: www.accessmedicine.com.
Figure 1.4: Coronal view of the brain showing the motor homunculus and blood supply areas of the precentral gyrus of the frontal lobe. Image modified and adapted from: Waxman SG. Clinical Neuroanatomy, 26th edition: www.accessmedicine.com.
Figure 1.5: Ischemic brain tissue downstream of arterial occlusion. Adapted from: www.neurologiaroma.it
Figure 1.6: Mechanisms of ischemic stroke. Adapted and modified from (9). Figure 1.7: Anatomy of cerebral arteries and sites of predilection of
atheromatous plaque. Blue arrows show direction of blood flow. Plaque has a tendency to form in areas of flow turbulence, such as bifurcations. Adapted and modified from: Andreoli TE, Carpenter CCJ, Griggs RC, Loscalzo J. Cecil Essentials of Internal Medicine, 6th edition: consulted on CD-ROM.
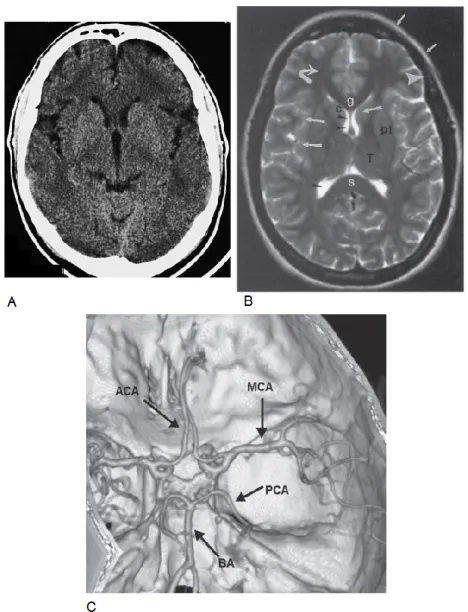
Figure 1.8: Signs of left middle cerebral artery (MCA) stroke. Right facial and upper limb weakness. Adapted and modified from (20). Figure 1.9: Normal brain images. A. Axial CT scan of the brain. Adapted
from: Moeller TB, Reif E. Normal Findings in CT and MRI, 1st edition, page 7. B. Axial T2-weighted MRI of the brain. MRI provides a good assessment of brain structures with differences in signal intensity. C. CT angiogram of intracerebral arteries with 3-dimensional volume rendering (axial and slightly oblique view). Gray matter (large white arrows), white matter (curved white arrow), lateral ventricles (black arrowheads), fat (small white arrows), and cortical bone (large arrowheads) on different pulse sequences. Structures identified are the genu (g) and splenium (s), caudate head (c), putamen (pt), and thalamus (T). For B and C,
images adapted from: Chen, Pope and Ott. Basic Radiology, 2nd edition, Chapter 12.
Figure 1.10: CT scan of a cerebral infarction in a 56 year old hypertensive and diabetic male who presented with left hemiparesis in the emergency department. A and B. Axial CT at 2 different levels without contrast injection showing a well-defined hypodense area in the right MCA territory (between white arrows) and a mass effect on the surrounding brain tissue (compression of right ventricle). The right MCA is brighter than the left (large white arrow head on B) and corresponds to an occluding thrombus. C. A 3-D volume rendering CT angiogram shows the occlusion in the superior branch of the right MCA. D. Axial CT with contrast injection shows decreased filling of blood vessels in the right MCA territory (between white arrows) compared to the left (black arrows). Images adapted from: Chen, Pope and Ott. Basic Radiology, 2nd edition, Chapter 12.
Figure 1.11: Axial CT scan without contrast of a 68 year old hypertensive female who was found unresponsive. There is a large bright (hyperdense) area consistent with hemorrhage in the right basal ganglia (black arrow), mass effect (small white arrows), bleeding into the ventricles (arrowheads), and entrapment of the left ventricle (large white arrow). This bleed is probably due to a vascular defect induced by chronic hypertension. Thrombolysis is contra-indicated, and immediate neurosurgical consultation is required for surgical decompression. Image adapted from: Chen, Pope and Ott. Basic Radiology, 2nd edition, Chapter 12.
Figure 1.12: Axial MR images of the patient with right MCA territory infarction shown in Figure 1.10. Images are at the same anatomic level. A. DWI demonstrating restricted movement of water in the infarcted area (increased signal intensity between white arrows). B. T2-weighted image demonstrating area of hyperintensity and
mass effect on surrounding structures. C. T1-weighted image with contrast injection showing enhancement of vasculature in the territory of infarction, corresponding to slow flow of intravascular contrast. Images adapted from: Chen, Pope and Ott. Basic Radiology, 2nd edition, Chapter 12.
Figure 1.13: Site of carotid plaque formation. It can cause significant obstruction of blood flow or rupture and embolize to a smaller vessel in the brain. Adapted from:
http://chicago.medicine.uic.edu/departments___programs/depart ments/neurosurgery/clinical_services/neurovascular_surgery/caro tid_disease/
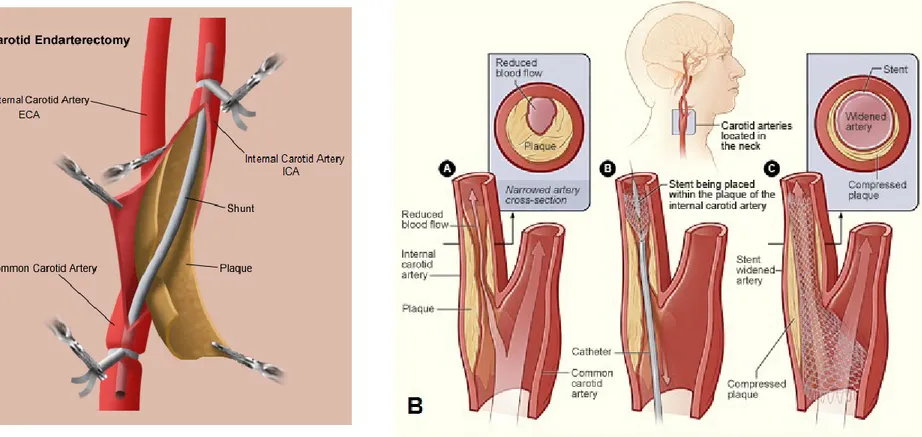
Figure 1.14: Two different criteria can be used to measure degree of carotid stenosis on angiography: NASCET and European Carotid Surgery Trial (ECST) criteria. Adapted and modified from (22). Figure 1.15: A. Carotid Endarterectomy (CEA) procedure. Adapted and
modified from:
http://stanfordhospital.org/clinicsmedServices/COE/surgicalServi ces/vascularSurgery/patientEducation/carotid.html
B. Endovascular carotid angioplasty (stenting) procedure. Adapted and modified from:
http://www.sfveincenter.com/images/stories/med_images/carotid _stent.jpg
Figure 2.1: Normal vascular architecture (A) and anatomy (B). A. General organization of vascular system. Arrows show the direction of flow. Modified and adapted from Kumar: Robbins&Cotran Pathologic Basis of Disease, Professional Edition, 8th ed. (2009). B. Structure of the arterial wall. Modified and adapted from: artery: transverse section of an artery. [Art]. Encyclopædia Britannica Online. Retrieved 17 April 2012, from
http://www.britannica.com/EBchecked/media/121565/Transverse -section-of-an-artery
Figure 2.2: Cellular interactions in atherosclerosis plaque progression. SMC, smooth muscle cell; MCP-1, monocyte chemoattractant protein 1; LDL, low-density lipoprotein; ox-, oxidized; PDGF, platelet-derived growth factor; M-CSF, macrophage colony-stimulating factor; MMP, matrix metalloproteinase. Adapted and modified from (39).
Figure 2.3: Different Types of Vulnerable Plaque. Adapted from (33).
Figure 2.4. Typical thin fibrous cap atheroma with a large lipid core, neovascularisation, intraplaque hemorrhage, and inflammatory macrophages in the shoulder of the cap. This plaque is considered a “rupture-prone” vulnerable plaque.
Figure 2.5: A stable plaque with a thick fibrous cap. This plaque is unlikely to rupture.
Figure 2.6: Expansive (outward) vessel remodeling with minimal change in lumen diameter.
Figure 2.7: How primary prevention could be effective in high-risk patients with no warning symptoms. If atherosclerosis is not detected at the subclinical phase, and a sudden rupture of a VP develops, for example at 60 years of age, a potentially fatal clinical ischemic event will occur. On the other hand, if screening for VP and effective preventative therapy are offered early (during the “blue” subclinical phase), the atheroma will be less likely to evolve into a thrombotic plaque, the risk of having a clinical ischemic event at the same age will be lower, and the patient will have a prolonged and better quality of life.
Figure 3.1: Scheme explaining relation between stress, strain and elastic modulus in an isotropic elastic material. A corresponding
stress-strain curve is plotted. Beyond a certain compression force (dot “2” on the graph), the material loses its elastic behaviour, i.e. it does not return to its original length. 1 = true elastic limit; 2 = elastic limit.
Figure 3.2: How a CT machine works. Adapted and modified from: http://www.bchsys.org/bchserv/Imaging/CT
Figure 3.2.1: Different Types of Vulnerable Plaque. (A) Rupture-prone plaque with a large lipid core, a thin fibrous cap and macrophages. (B) Ruptured plaque with a sub-occlusive thrombus and ruptured cap. (C) Erosion-prone smooth muscle cell-rich plaque with a proteoglycan matrix. (D) Eroded plaque with a sub-occlusive thrombus. (E) Intra-plaque haemorrhage from the vasa vasorum. (F) Calcified nodule protruding into the vessel lumen. (G) Chronic critically stenotic plaque with extensive calcification and an old thrombus. Adapted from Naghavi et al with permission (33).
Figure 3.2.2: Doppler ultrasound of carotid arteries of a 46-year-old woman with hypercholesterolemia and transient cerebral ischemia of the right middle cerebral territory. (a) Significant stenosis of the left internal carotid artery from an echogenic homogeneous plaque that narrows the vessel lumen. (b) 80% right internal carotid artery stenosis (in diameter reduction, according to criteria from (76)). The stenotic plaque is echolucent (soft plaque) likely because of its high lipid content, haemorrhage and low calcium content.
Figure 3.2.3: Doppler ultrasound of the left carotid artery of a 75-year-old asymptomatic man. (a) Sagittal reconstruction of the carotid artery lumen on MDCTA of the left ICA with a small calcified nodule (an inset of this image zoomed in on the lesion will be provided for article submission). (b) Doppler ultrasound
longitudinal image of the region of interest (red rectangle in a) showing 70% stenosis. The plaque meets criteria of vulnerability with plaque heterogeneity and a calcified nodule protruding into the vessel lumen. (c) Axial image centered on the calcified nodule. (d) A schematic representation of this plaque showing a calcified nodule protruding into the vessel lumen. Image (d) adapted and modified from (33) with permission.
Figure 3.2.4: Doppler ultrasound of the carotid artery of an 82-year-old male with amaurosis fugax and transient left MCA territory ischemia. (a) Ultrasound image showing 75% left internal carotid artery stenosis with ruptured plaque and a non-occlusive clot. (b) Enlargement of the region of interest (red rectangle in a) where heterogeneous plaque can be seen. The echo-lucent zone may reflect hemorrhage or a lipid core. (c) Axial Doppler image centered on the plaque where stenosis is maximal, showing plaque heterogeneity. (d) Schematic representation of plaque with a non-occlusive clot and ruptured cap may reflect the plaque features seen on ultrasound in this case. This patient has undergone CEA demonstrating a ruptured and thrombotic atheroma intraoperatively. (e) Doppler spectral analysis. Maximal systolic velocity is 295 cm/s. Image (d) adapted and modified from (33) with permission.
Figure 3.2.5: Carotid artery contrast-enhanced ultrasound. Hyperechoic foci within the plaque represent neovessels. Sonovue® is an aqueous suspension of stabilized sulfur hexafluoride (SF6) microbubbles (precontrast image currently unavailable for pre and post-contrast comparison). Courtesy of Christian Greis, Bracco Diagnostics. The color image is a schematic representation of vulnerable plaque with a normal cap and neovessels. Schematic inset adapted and modified from (33) with permission.
Figure 3.2.6: (a) CT scanner of carotid bifurcation showing a stenosis on the left side surrounded by calcifications. (b) B-mode image of the same plaque from reconstructed raw radiofrequency (RF) signals, used for vascular elastography. (c) Strain profile of segmented areas in (b). Rigid structures, such as calcifications, have stable cumulative strain values whereas soft plaque areas have increasing cumulative strain values. (d) For the same B-mode image, strain values can be displayed by colour code (elastogram). Dark zones represent calcifications with low strain values. (e) In a similar manner, shear stress (mechanical behaviour at the interface of 2 different structures) can be displayed by color code and help locate areas of high mechanical stress (white and dark areas). T=fibrous tissue; CA=calcification; L=lumen. Adapted from (113) with permission.
Figure 3.2.7: Patient with left-sided amaurosis fugax. (a) Sagittal reconstruction of the carotid artery lumen on MDCTA. Severe left internal carotid artery stenosis and a small ulceration. (b) and (c) Cross-sectional images from the regions of interest (red rectangle in a). (b) The plaque likely contains a lipid core with an ulcer because the contrast agent in the lumen has an irregular contour. (c) A large lipid core and a calcified nodule are found inferiorly to the image in (b).
Figure 3.2.8: Cross-sectional high-resolution MRI of an asymptomatic patient’s right internal carotid artery plaque. This patient has a 50% stenosis. (a) T1-weighted image showing a thick fibrous cap and large lipid core, easier to depict on the corresponding post-gadolinium injection T1-weighted image in (d). (b) A drop in relative signal intensity on this T2-weighted image (compared to other sequences) characterizes the presence of a lipid-rich necrotic core. (c) Proton density image shows an isointense core. (d) After gadolinium injection, plaque enhancement is observed in
the postero-medial aspect of the plaque, suggesting neovascularisation or inflammation.
Figure 3.2.9: High-resolution cross-sectional MRI of the right carotid bifurcation of an asymptomatic patient. (a) On T1-weighted acquisition of right internal carotid artery stenosis, the plaque appears to be heterogeneous. The external carotid artery lumen is observed (white arrow), and both vessel walls consist of heterogeneous signals reflecting fibro-calcific tissue. (b) and (c) T2-weighted and Proton Density images show a hyperintense area not clearly apparent on T1 pre and post contrast images. This hyperintense area likely represents loose matrix fibrous tissue. (d) There is no significant plaque enhancement after gadolinium injection, suggesting that there is no neovascularisation or inflammation.
Figure 4.1: Schematic depiction of ultrasound NIVE. Blood pressure from the systolic carotid pulse induces a compression (axial stress denoted by large red arrows) and a deformation (axial strain denoted by ∆L/L X 100) of the atherosclerotic plaque. This is a simplified depiction, because axial strain is calculated for each individual window (1.54 X 2.99 mm), after which mean axial strain for the entire segmented plaque is calculated.
Figure 4.2: Elastogram and strain curves of the left carotid plaque of a 70 year old man who presented with left-sided amaurosis fugax. (a) A two-dimensional longitudinal view B-mode image reconstructed from raw RF data showing the segmented plaque (red contour) on the anterior vascular wall of the internal carotid artery (ICA), and the same image with a superimposed elastogram (color map) representing cumulated axial strain at maximal systolic compression. The colors range from -20% (dark blue) to +20% (dark red), denoting areas of dilation and compression respectively. (b) A graph of instantaneous mean
axial strain is obtained from the strain difference between two consecutive image frames, thus representing the variation of mean axial strain over time. Peak systolic compression is denoted by red circles. Mean Strain at Peak Systolic Compression (MSPSC) is the average of these peak values over the number of cardiac cycles. Dotted vertical lines represent end-diastole, estimated from B-mode videos and M-mode images. (c) Strain Rate is the slope of the instantaneous strain in (b). Maximum Strain Rate (MaxSR) is the mean of the greatest strain rate occurring at end-diastole (green circles). Minimum Strain Rate (MinSR) is the mean of the lowest strain rate, occurring at the onset of diastole (purple circles). In other words, MaxSR represents greatest tissue compression over time, and MinSR represents greatest tissue dilation over time, which explains why MinSR is a negative value. (d) A graph of cumulated mean axial strains is derived from (b). Double-sided blue arrows represent strain amplitude for each cardiac cycle. Mean Strain Amplitude (MSA) is the average of these three amplitudes. The peak of the third cardiac cycle corresponds to the elastogram in (a).
Figure 4.3: High-resolution MRI of the left internal carotid artery plaque of a 65 year old man who presented with a left hemispheric stroke (axial view). This is a vulnerable-appearing lipid-rich hemorrhagic plaque. The external and internal carotid arteries are indicated with a white and black arrow, respectively. The segmentation using the QPlaque software is shown superimposed on the T1-weighted image (framed inset at the center). The green and red contours designate the outer and inner vascular wall contours of the internal carotid artery. Yellow represents lipid, pink represents hemorrhage, and purple represents inflammation. T1W = T1-weighted; T2W = T2-weighted; PDW = Proton Density-weighted; T1WC+ = T1-weighted post-contrast injection.
Figure 4.4: Flowchart of subject recruitment.
Figure 4.5: ROC curves for NIVE strain parameters to detect the presence of a lipid core.
Figure 4.6: Distribution of axial strain parameters by presence of symptoms. MSPSC = Mean Strain at Peak Systolic Compression; MSA = Mean Strain Amplitude; MaxSR and MinSR = Maximal and Minimal Strain Rates.
Figure 4.7: Scatter plots with curve fitting functions of the natural logarithm of strain parameters with (a) % Lipid volume and (b) % Calcium volume (bivariate analyses). Note that only for the MinSR parameter, 2 outliers were removed to normalize the distribution. For all other parameters, a natural logarithm was applied for normalization. MSPSC = Mean Strain at Peak Systolic Compression; MSA = Mean Strain Amplitude; MaxSR and MinSR = Maximal and Minimal Strain Rates. Note: red stars = symptomatic group, blue circles = asymptomatic group
Figure 4.8: Common issue of slice acquisition overlap between image sequences.
LIST OF ABBREVIATIONS
%Calcium volume, calcium percentage of total plaque volume %Lipid volume, lipid percentage of total plaque volume 2D, two-dimensional
3D, three-dimensional
ACA, anterior cerebral artery
ACAS, Asymptomatic Carotid Artery Trial
ACE-inhibitors, angiotensin-converting-enzyme inhibitors, ACST, Asymptomatic Carotid Stenosis Trial
ANS, Autonomic nervous system ARBs, angiotensin II receptor blockers ARFI, acoustic radiation force imaging ARIC, Atherosclerosis Risk in Communities ATP, adenosine triphosphate
AVC, Accident Vasculaire Cérébral CAT, computed axial tomography CBC, complete blood count CCA, common carotid artery CEA, Carotid Endarterectomy CEUS, contrast-enhanced ultrasound CHD, coronary heart disease
CI, confidence interval CNR, contrast-to-noise ratio CNS, Central nervous system cont’d, continued
CRP, C-reactive protein CT, computed tomography
CTA, computed tomography angiography CVA, Cerebrovascular accident
dBP, diastolic blood pressure DWI, Diffusion-Weighted Imaging E, Young’s elastic modulus
ECG, electrocardiogram ECM, extracellular matrix
ECST, European Carotid Surgery Trial FGF, Fibroblast growth factor
GSM, gray-scale median HDL, high-density lipoprotein HU, Hounsfield unit
Hz, Hertz
IBS, integrated backscatter ICA, internal carotid artery (ICA) ICC, intraclass correlation coefficient ICP, intracranial pressure
IPH, intraplaque hemorrhage
IRM, Image par résonance magnétique IVUS, intravascular ultrasound
LDL, low-density lipoprotein
LSME, Lagrangian Speckle Model Estimator MaxSR, Maximal Strain Rate
MCA, middle cerebral artery
M-CSF, macrophage colony-stimulating factors
MDCTA, multidetector computed tomography angiography MHz, megahertz
MinSR, Minimal Strain Rate MMP, matrix metalloproteinase MR, magnetic resonance
MRA, magnetic resonance angiography MRI, Magnetic Resonance Imaging MSA, Mean Strain Amplitude
msec, millisecond
MSPSC, Mean Strain at Peak Systolic Compression
n, number (as in number of subjects or number in sample population) NASCET, North American Symptomatic Carotid Endarterectomy Trial NIHSS, National Institutes of Health Stroke Scale
NIVE, Non-Invasive Vascular Elastography PDA, pixel distribution analysis
PDGF, Platelet-derived growth factor PDW, proton density-weighted PET, positron-emission tomography PNS, Peripheral nervous system
Post. Comm., posterior communicating artery PW, pulse wave
r, Pearson correlation coefficient
RBANS, Repeatable Battery for the Assessment of Neuropsychology Status RF, radiofrequency
ROC curve, Receiver Operating Characteristic curve ROI, region of interest
RR, relative risk
rs, Spearman correlation coefficient
rSI, relative signal intensity sBP, systolic blood pressure SD, standard deviation SMC, smooth muscle cell SNR, signal-to-noise ratio
SSWI, supersonic shear wave imaging T, Tesla
T1W, T1-weighted T2W, T2-weighted
TGF-β, Transforming growth factor Beta TIA, transient ischemic attack
TOF, Time-of-Flight US, Ultrasound
USPIO, ultra small superparamagnetic iron oxide
VCAM-1, ICAM, Vascular and Intercellular adhesion molecules VP, vulnerable plaque
VWV, vessel wall volume z, acoustic impedance
Ce n’est pas l’espèce la plus forte qui survit, ni la plus intelligente, mais bien celle qui s’adapte le mieux au changement
Charles Darwin
Advance, and never halt, for advancing is perfection.
Gibran Khalil Gibran
À ma mère, mon père, et mes deux frères
ACKNOWLEDGEMENTS
Je tiens tout d’abord à remercier Gilles Soulez pour m’avoir offert cette opportunité inégalée de travailler avec son équipe sur ce projet innovateur. Sa disponibilité, son empathie, et ses grandes qualités d’académicien m’ont guidée et permis de terminer ce travail avec succès. Il a été un mentor pour moi, et n’a jamais cessé de m’encourager et de croire en ma persévérance; je lui serai, pour toujours, sincèrement reconnaissante. Je remercie Guy Cloutier pour m’avoir accueillie au LBUM. Par sa rigueur scientifique et sa pédagogie, il a guidé notre équipe d’élastographie quasi-statique et m’a aidée à réaliser le travail présenté dans ce mémoire. Je souhaite également remercier Dr. Soulez et Dr. Cloutier pour m’avoir soutenue avec de nombreuses lettres de références et pour m’avoir accordé le temps nécessaire à mes études et applications aux études médicales post-doctorales. Leur soutien a porté fruit et a contribué à la poursuite de mon rêve de devenir radiologiste.
Merci à Elizabeth Mercure et Zhao Qin, collègues d’une gentillesse infinie, qui ont travaillé méticuleusement à l’obtention d’élastogrammes et qui sont demeurées disponibles pour répondre à mes nombreuses questions. Merci à Hasti « joon », mon amie proche depuis mes débuts au CRCHUM-LBUM, qui m’a encouragée à persévérer et avec qui j’ai passé de nombreux bons moments. Merci à tous les membres du LBUM et du département de recherche en radiologie pour leur support, travail d’équipe, et leur sourire quotidien. Je souhaite associer à ces remerciements Dr. Marie-France Giroux, Dr. François Guilbert, Andrée Cliche, Walid El-Abyad, Louise Allard, Danielle Blain, Claude Kaufman, Sofiane Hadjaj, Emmanuel Montagnon, Jonathan Porée, Julien Tripette, Stephan Muth, Boris Chayer, Marie-Hélène Roy-Cardinal, François Destrempes, Ali Traore, Cédric Schmitt, Anis Hadj Henni, et tous les étudiants et chercheurs que j’ai cotoyés. Ce fut vraiment agréable de travailler avec vous tous. Je tiens particulièrement à témoigner ma gratitude au Dr. Alain Rivard, qui a m’a fait l’honneur de présider le jury d’évaluation de mon
mémoire, et au Dr. Oury Monchi, qui a accepté d’être membre évaluateur du jury.
Je suis reconnaissante au CRCHUM, au programme de Sciences biomédicales de l’Université de Montréal, et à l’Association Canadienne de Radiologistes pour avoir valorisé mon travail en me décernant des bourses d’études de maîtrise et de recherche.
Un remerciement spécial à mes parents d’avoir mis tout le temps et l’énergie nécessaire à mon éducation, depuis mon enfance jusqu’à aujourd’hui, et sans qui je n’aurais pas pu poursuivre mes ambitions avec succès. Chaque jour je réalise combien ils ont donné par amour pour mes frères et moi afin que nous réussissions nos projets avec succès. Particulièrement, je remercie ma mère pour m’avoir écoutée et gâtée avec des repas équilibrés, mon père pour avoir été patient, travaillant et toujours à l’écoute, ainsi que mes frères, dont je me suis rapprochée énormément depuis les trois dernières années.
Enfin, je remercie le Bon Dieu pour chaque événement, heureux et malheureux, ainsi que pour chaque personne que j’ai rencontrée dans ma vie. Toutes ces expériences continuent d’accroître ma sagesse, mon bonheur, et m’enseignent, à mon tour, à soutenir les autres.
Section I
Clinical Perspectives on Ischemic Stroke
and Carotid Atherosclerosis
CHAPTER 1
1. Stroke, a Cerebrovascular Disease
1.1.
Background
Cerebrovascular disease is a term that designates a wide spectrum of disorders of the arterial and venous circulations of the central nervous system, including ischemic stroke, hemorrhagic stroke, and other cerebrovascular anomalies. A stroke, also called cerebrovascular accident (CVA), is a clinical syndrome1 characterized by the abrupt onset of a focal neurological deficit due to either inadequate blood flow (i.e. ischemia) or hemorrhage in the brain. Stroke is a major cause of mortality and morbidity worldwide, and it is frequently devastating for both the patient and family. Generally, there are two types of stroke: ischemic and hemorrhagic, accounting for 87% and 13% of all strokes, respectively [1].
This chapter will focus on understanding the clinical and pathological aspects of ischemic stroke and will provide a brief overview of hemorrhagic stroke. Current issues associated with ischemic stroke will be described, and the premise and objectives of the present research project will be explained.
1.2.
Anatomy and Physiology
The human nervous system is divided into three specialized sub-systems. The central nervous system (CNS) consists of the brain and spinal cord; it functions to initiate decisions and coordinate actions. The peripheral nervous system (PNS) consists of neurons coming out from the CNS; it is responsible for
1
Syndrome: a group of signs and symptoms that occur together and characterize a particular abnormality, such as a disease, psychological disorder, or other abnormal physiological condition. A syndrome is not synonymous with disease but merely describes a constellation of symptoms that may characterize a disease.
executing functions dictated by the brain in muscles and relaying sensory information from the skin back to the brain. Finally, the autonomic nervous system (ANS) consists of nerve cells overlapping in location between the CNS and PNS, and controls subconscious bodily functions such as blood pressure, heart rate and digestion.
The brain alone contains close to 100 billion nerve cells [2]. It is responsible for motor function, sensory perception, autonomic regulation, memory, learning, language, emotions, and thoughts, to name only a few. Hence, the brain is central to all bodily functions of the nervous system. Brain anatomy is complex and beyond the scope of this thesis, but a very basic knowledge of anatomy is provided here to help understand the clinical aspects of ischemic stroke.
The brain is divided into three main parts: cerebrum, cerebellum and brainstem (figure 1.1). The cerebrum consists of two cerebral hemispheres of folded tissue called cortex, each divided into 4 lobes that serve distinct functions. The cerebellum has a similar structure to the cerebrum, but is smaller. The brainstem is covered by the cerebral hemispheres, and extends inferiorly to become the spinal cord.
Figure 1.1: Left lateral view of the brain. Each part of the brain identified serves a specific function. Adapted and modified from: Morton DA, Foreman KB, Albertine KH. The Big Picture: Gross Anatomy, 1st edition: www.accessmedicine.com
Despite the extraordinary power of the brain, it is extremely fragile. Neuronal cells of the brain do not readily repair or regenerate after an injury or cell death. Therefore, a brain injury is often very serious with permanent sequelae, such as paralysis, cognitive changes, coma, and even death. Protection of the brain from external insults is provided by the skull, meninges2, and head gear for certain sports activities. On the other hand, function and survival of neuronal cells depends on a good and constant blood supply of oxygen and glucose, provided by 15 to 20% of the total cardiac output3 at rest and an effective networking of cerebral arteries, namely the Circle of Willis.
2
Meninges are layers of connective tissue that surround the brain, underneath the skull.
3
Cardiac Output is the amount of blood coming out of the heart per minute (mL/min). Cardiac Output = Heart Rate X Stroke Volume.
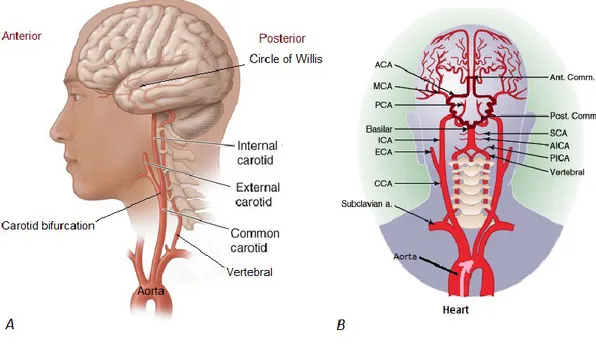
There are two main arterial supplies to the brain: the internal carotid artery and the vertebral artery (Figure 1.2). Two internal carotid arteries supply the anterior circulation of the brain, and two vertebral arteries supply the posterior circulation of the brain. The internal carotid artery (ICA) branches into the anterior cerebral artery (ACA), the middle cerebral artery (MCA), and the ophthalmic artery which supplies the retina. The vertebral arteries join to form the basilar artery, which further divides into two posterior cerebral arteries (PCA). Hence, three major pairs of arteries supply the cerebral hemispheres: ACA, MCA, and PCA. The anterior and posterior circulations are connected through communicating arteries of the Circle of Willis. Anatomy of these vessels is shown on figures 1.2 and 1.7.
Figure 1.2: A. Lateral and B. coronal views of extracranial and intracranial4 arteries.
A: The common carotid artery bifurcates into the external and internal carotid artery. The external carotid supplies blood to the face. The internal carotid supplies the anterior part of the brain. The vertebral artery arises from the subclavian artery, and supplies the posterior part of the brain. B: The anterior and posterior circulations are linked through the posterior communicating artery (Post. Comm.), forming the Circle of Willis
4
Extracranial: outside of the bony skull; Intracranial = inside the bony skull. The brain is intracranial.
(highlighted in dark red). This architecture provides collateral circulation of blood in case of obstruction in one of the major intracranial arteries. The pink arrow demonstrates the direction of blood flow arising from the heart. ACA = Anterior cerebral artery; Ant. Comm.= Anterior communicating artery; MCA = Middle cerebral artery; PCA = Posterior cerebral artery; ICA = Internal carotid artery; ECA = External carotid artery; CCA = Common carotid artery; SCA = Superior cerebellar artery; AICA = Anterior Inferior cerebellar artery; PICA = Posterior inferior cerebellar artery; a.= artery. Figure 1.2A adapted and modified from Longo DL, Fauci AS, Kasper DL, Hauser SL, Jameson JL, Loscalzo J. Harrison’s Principles of Internal Medicine, 18th edition:
www.accessmedicine.com. Figure 1.2B adapted and modified from: Andreoli TE, Carpenter CCJ, Griggs RC, Loscalzo J. Cecil Essentials of Internal Medicine, 6th edition:
consulted on CD-ROM.
Each main intracranial artery supplies specific areas of the brain (figures 1.3 and 1.4). In turn, each area of the brain has a different role in the nervous system (figures 1.1 and 1.4). Therefore, from the specific symptoms and signs of stroke that a patient has, a physician can localize the area of the brain that is deprived of oxygen before examining imaging studies.
Figure 1.3: Blood supply to the brain by arterial territory. Adapted and modified from Longo DL, Fauci AS, Kasper DL, Hauser SL, Jameson JL, Loscalzo J. Harrison’s Principles of Internal Medicine, 18th edition: www.accessmedicine.com
Figure 1.4: Coronal view of the brain showing the motor homunculus5 and blood supply
areas of the precentral gyrus of the frontal lobe. Image modified and adapted from: Waxman SG. Clinical Neuroanatomy, 26th edition: www.accessmedicine.com
1.3.
Pathophysiology
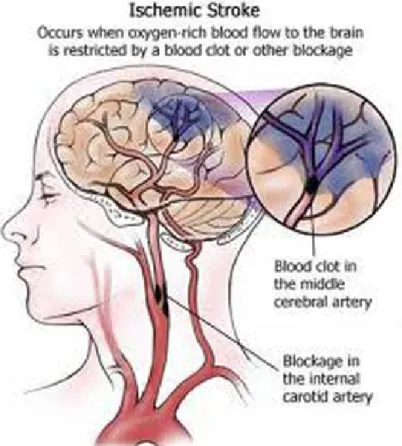
In ischemic stroke, a sudden interruption of blood flow in a blood vessel to the brain occurs, inhibiting neurons downstream from receiving oxygen and glucose (figure 1.5). The inadequate blood flow to the brain is termed cerebral ischemia, and results in cellular hypoxia6, depletion of adenosine triphosphate (ATP) molecules (i.e. loss of energy), and loss of normal cellular functions. Neuronal cells undergo a number of biochemical changes and can no longer maintain ionic gradients. Consequently, water passively shifts into cells, and they swell (cytotoxic edema). If blood flow is not immediately restored within
5
Motor homunculus: map of brain areas that control muscle movement. On figure 1-4, the map shows which brain part controls muscle movement of the limbs, hand, face, tongue.
6
a few minutes, cerebral ischemia evolves into cerebral infarction7. It only requires 4 to 10 minutes [3] of complete oxygen deprivation to cause cerebral infarction. The popular expression physicians say, “time is brain”, reflects how important it is to act very quickly to prevent as much neuronal cell death as possible.
Figure 1.5: Ischemic brain tissue downstream of arterial occlusion. Adapted from:
www.neurologiaroma.it
An ischemic stroke implies that cerebral infarction has occurred. Patients suffering a stroke have variable recovery afterwards. A transient ischemic attack (TIA) is clinically similar to an ischemic stroke, but the neurologic deficit lasts less than 24 hours, and there is full recovery of symptoms with no evidence of cerebral infarction on imaging studies. The mechanisms underlying an ischemic stroke are the same as those for TIA. However, in TIA,
7
the vascular obstruction does not last long enough to cause infarction, probably because the thrombus or embolus is small enough to spontaneously dissolve and allow timely reperfusion. Although harmless, a TIA is an important warning sign: it precedes 15% of all strokes [4], and it considerably increases the risk of developing a stroke within the next 90 days (9 to 20% risk), especially in the first 2 days (3 to 10% risk) [5-7]. Unfortunately, half of all patients who experience a TIA do not report it to their healthcare provider [8].
In hemorrhagic stroke, there is bleeding in the brain tissue. The focal area where bleeding is occurring produces a toxic effect on neuronal cells, vasospasm8 of blood vessels, and may produce a mass effect9 compressing surrounding vessels and brain tissue. Moreover, a breakdown of the vascular barrier can cause fluid to leak interstitially in the brain (vasogenic edema), which in turn can also cause a mass effect. These events can compromise blood flow, leading to ischemia and infarction, or cause brain herniation, leading to massive cellular death and loss of vital bodily functions.
1.4.
Etiology
10Cerebral ischemia may occur in a specific vascular territory as a result of a thrombotic or embolic occlusion of a major vessel, or it may occur globally because of decreased systemic blood pressure. Causes of focal and global cerebral ischemia are enumerated in Table I-I.
8 Vasospasm: contraction of muscular layer of blood vessels, causing decrease in lumen
diameter. Also called constriction.
9 Mass effect: compression of surrounding brain tissue due to the presence of a mass, such as
a collection of blood, swelling, or a tumour. A mass effect requires imminent treatment because it may cause deadly brain herniation, where the brain tissue is pressed and pushed away from its normal position inside the bony skull.
10
Table I-I: Common Causes of Cerebral Ischemia
Thrombosis is the formation of a thrombus (blood clot) in the blood stream. Hypercoagulability, stasis of blood circulation, and vessel wall injury are predisposing factors of thrombosis. Atherosclerotic plaque rupture is an injury of the diseased vessel wall. As a response to this injury, a thrombus forms at the site of rupture and may occlude the artery in situ or travel distally11 to a smaller vessel, at which point it is called an embolus. These concepts are important for understanding etiology and mechanisms of ischemic stroke (figure 1.6). Four common mechanisms are discussed below.
11
Distal: located further from the heart. Antonym = proximal.
Focal Cerebral Ischemia Global Cerebral Ischemia Disease of the Vascular wall
Atherosclerotic plaque with occlusive thrombosis in situ
Vasculitis (inflammation of blood vessels) Vasospasm (migraine or hemorrhage)
Mass effect (compression of cerebral vessels) Dissection of arterial wall
Other vascular disease (moyamoya, fibromuscular dysplasia)
Embolus
Cardiac origin (atrial fibrillation, cardiac tumour) Artery-to-artery (i.e. embolus from an upstream
atherosclerotic plaque)
Venous origin (paradoxical embolus due to cardiac defect)
Hyperviscosity of blood
Inflammatory disease (Lupus) Sickle cell disease
Inherited hypercoagulability
Medication-induced (e.g. oral contraceptive)
Hypoperfusion (e.g. massive hemorrhage, dehydration) Cardiac arrest Other cause of hemodynamic
compromise (e.g. septic, anaphylactic, or
cardiogenic shock states)
Figure 1.6: Mechanisms of ischemic stroke. Adapted and modified from [9].
1. Cardioembolic stroke causes up to 20% of all ischemic strokes [3]. A thrombus forms in the heart due to cardiac arrhythmia (e.g. atrial fibrillation), a structural cardiac defect, or valvular disease. Fragments of thrombi then detach and embolize to the brain. Emboli frequently lodge in the major arteries (MCA, PCA, ACA). Cardioembolic strokes may affect a single cerebral vascular territory or multiple vascular territories. The latter suggests “embolic showers” (multiple emboli), which are strongly associated with cardiac thromboembolism.
2. Large-vessel occlusion is another possible but less common mechanism of stroke. It involves total occlusion of the internal carotid artery due to an advanced atherosclerotic plaque that ulcerates and forms an obstructive thrombus in situ. A border-zone cerebral infarction (“watershed infarction”) ensues; this zone is located most distally and between major cerebral vascular territories. If collateral arterial circulation has sufficiently developed to bypass the severe carotid stenosis, then a total carotid occlusion could be completely asymptomatic and not cause any cerebral infarction.
3. Artery-to-artery embolus results from the formation of a thrombus at the surface of a ruptured atherosclerotic plaque, and distal embolization of it or of a fragment toward the brain. More about atherosclerosis is discussed in chapter 2. Sites with a predilection for developing atherosclerotic plaque include the ICA, carotid bifurcation, and aortic arch (figure 1.7). The proximal ICA and bifurcation are the most common sources of artery-to-artery embolus. An estimated 20% of all ischemic strokes are caused by carotid atherosclerosis alone [10]. Emboli from the ICA may go to any of its major branches. Other less common sources of emboli that go to smaller vessels in the brain include intracranial atherosclerosis (proximal MCA, ACA, or ophthalmic artery), and dissection of the carotid artery (traumatic or spontaneous).
Figure 1.7: Anatomy of cerebral arteries and sites of predilection of atheromatous plaque. Blue arrows show direction of blood flow. Plaque has a tendency to form in areas of flow turbulence, such as bifurcations. Adapted and modified from: Andreoli TE, Carpenter CCJ, Griggs RC, Loscalzo J. Cecil Essentials of Internal Medicine, 6th edition:
consulted on CD-ROM.
4. Small-vessel strokes are small infarctions in the territory of deep penetrating arteries of the brain, affecting areas of the basal ganglia (figure 1.3) and the brainstem. They are also termed “lacunar strokes”. Microvascular obstruction in situ occurs due to microatheroma or lipohyalinotic vessel wall thickening associated with hypertensive disease. Approximately 20% of all strokes are small-vessel strokes [3].
Causes of spontaneous hemorrhagic stroke include vascular diseases (hypertensive, amyloid angiopathy, arteriovenous congenital malformation, drug-induced), intracerebral tumours pressing on vessels, and bleeding disorders (congenital or induced by blood thinners).
1.5.
Epidemiology, Risk Factors, Prognosis, and Cost
In the western world, stroke is the third leading cause of death after heart disease and cancer [11], and it is a leading cause of long-term disability [12]. Approximately every 40 seconds, a person suffers a stroke [11], and every 4 minutes, someone dies from stroke in the United States [13]. Each year, 795 000 people in the USA suffer from a new or recurrent stroke, of which 610 000 are first attacks, and the remainder are recurrent attacks [11]. In people aged 45 to 84 years, the age-adjusted stroke incidence rate varies from 2.3 to 6.6 per 1000 person-years [1]. Stroke incidence increases with age, is higher in blacks than in whites, and higher in men than in women.
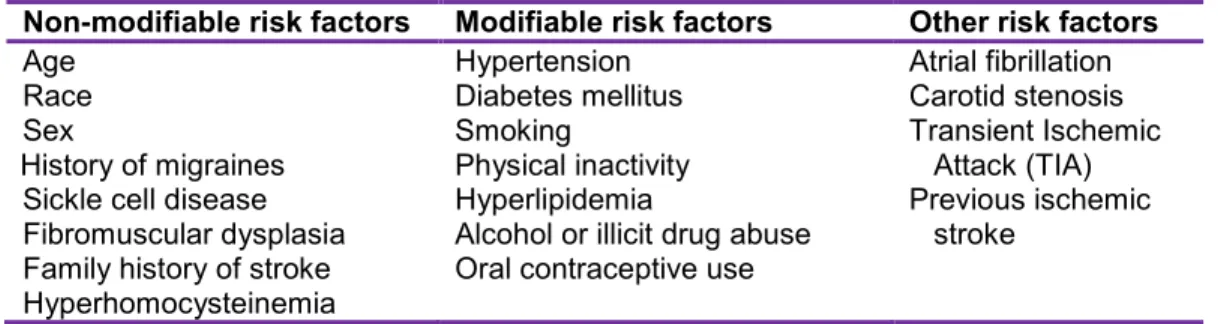
Risk factors for ischemic stroke are presented in Table I-II. Modifiable implies that risk factors can be controlled with lifestyle changes and medications.
Non-modifiable risk factors Modifiable risk factors Other risk factors
Age Race Sex
History of migraines Sickle cell disease Fibromuscular dysplasia Family history of stroke Hyperhomocysteinemia Hypertension Diabetes mellitus Smoking Physical inactivity Hyperlipidemia
Alcohol or illicit drug abuse Oral contraceptive use
Atrial fibrillation Carotid stenosis Transient Ischemic Attack (TIA) Previous ischemic stroke
Table I-II. Risk Factors for ischemic stroke
Stroke can be deadly or result in a significant loss of autonomy due to permanent paralysis, speech or cognitive impairment. Prognosis after an acute ischemic stroke is highly variable, because it depends on stroke severity, development of complications, and presence of other comorbid diseases. Life-threatening complications that may occur after an ischemic stroke include brain herniation (mass effect), aspiration pneumonia (stroke can cause impaired swallowing and choking), acute myocardial infarction, and an expanding collection of blood (hematoma) due to hemorrhagic transformation of the infarct. The 30-day case fatality rate of ischemic stroke is 8-12%, and
that of hemorrhagic stroke is around 40% [14,15]. Among stroke survivors, 15 to 30% remain permanently disabled [16]. In addition to the burden on the patient and family, elevated health care and economical costs ensue. In 2007, the direct and indirect cost of stroke was $40.9 billion in the USA [11].
1.6.
Clinical Presentation
1.6.1. History
Patients suffering a stroke or TIA present with an abrupt onset neurologic deficit or altered consciousness. The time of symptom onset is very important. If the onset is within 6 hours of consultation in the emergency room and ischemic stroke is confirmed with computed tomography (CT) scan of the head, treatment with immediate thrombolysis12 is possible. Neurologic deficits elicited on medical history include:
facial or limb weakness (hemiparesis) or paralysis (hemiplegia), usually on one side
sensory loss in extremities
Visual deficit: blindness in one or both eyes, visual field defect, double vision
Speech disorder: slurred (dysarthria) or incoherent (“word salad”)
Language disorder: lack of output (expressive aphasia) or understanding (receptive aphasia)
Dizziness, loss of balance, loss of coordination Headache, nausea, vomiting
Decreased level of consciousness
12
Depending on the location of the brain that is ischemic, patients will present a specific symptom or a combination of symptoms termed stroke syndromes. Symptoms that worsen over time may indicate progressive intracranial edema, hemorrhagic transformation, or a stroke-in-evolution (area of ischemia and infarction that is increasing in size because of worsening occlusion). Some symptoms are suggestive of hemorrhagic stroke, like severe headache, nausea, vomiting, neck stiffness, and loss of consciousness, but they are not of diagnostic value since they also occur in ischemic stroke.
Risk factors for ischemic stroke and other co-morbidities must be elicited with medical history. Hypertension, diabetes mellitus, smoking, elevated cholesterol levels, and family history of stroke or heart disease may be present. Also, the patient may have recently suffered a similar but transient attack in the past few weeks, suggesting TIA as a warning sign for current ischemic stroke. Other clues must also be elicited, such as cardiac arrhythmia (palpitations, shortness of breath), carotid stenosis, trauma, medication use, and causes of hypercoagulability (hormonal therapy).
Many people suffer from “silent” ischemic strokes, in other words, small strokes with no apparent symptoms. They are usually discovered incidentally on brain imaging, and the patient and family report no history of previous stroke or TIA. Etiology of silent ischemic strokes is the same as cerebral ischemia discussed above (cardioembolic, artery-to-artery, small vessel obstruction). The prevalence of silent ischemic strokes varies from 11% in people aged 55-64 years, to 43% in those aged over 85 years [17,18]. Although no obvious deficits are observed, minor cognitive and memory deficits resulting from silent strokes can be detected with more sensitive neurocognitive and psychological testing (for example, the Repeatable Battery for the Assessment of Neuropsychology Status [RBANS]). Such minor deficits can evolve into dementia and significantly alter quality of life; hence, treatment is aimed at preventing both silent and non-silent ischemic strokes.
1.6.2. Physical Examination
A thorough physical exam is required to determine if indeed the patient suffered a stroke, identify the stroke syndrome, localize and predict the extent of the ischemic lesion, establish a baseline neurological status for follow-up of clinical evolution, and uncover possible etiologies.
If a patient presents with a significant decrease in level of consciousness like stupor or coma, there is a very high risk of severe deterioration and death, and urgent intervention is required (e.g. mechanical respiratory assistance, blood pressure maintenance).
Vital signs frequently show an elevation of systemic blood pressure; it is a normal response to cerebral injury to maintain cerebral perfusion. If there is a brainstem or a very large ischemic or hemorrhagic stroke, the patient’s vital signs may be unstable and there may be loss of spontaneous breathing requiring assisted ventilation. A rapid irregular heart rate is indicative of cardiac arrhythmia like atrial fibrillation; in this case, the heart rate must be slowed down to maintain adequate perfusion of the body. A fever can be a clue of aspiration pneumonia or another infection (e.g. meningitis).
Examination of the head and neck can show signs of trauma like a contusion, swelling, and laceration, which can be associated with intracranial hemorrhage or arterial dissection. An ocular examination of retinas with fundoscopy is required to check for evidence of increased intracranial pressure (ICP) (papilledema) or retinal ischemia (“cherry-red spot” appearance of fovea). A stiff neck is suspicious for meningitis or hemorrhagic stroke. Auscultation of the carotid arteries with a stethoscope may reveal a bruit indicative of significant carotid stenosis.
On cardiac auscultation, an irregular rhythm may point to arrhythmia, a murmur may be a sign of valvular disease, and a gallop13 may be heard when there is cardiac hypertrophy. Pulmonary edema and swelling of the legs are signs of heart failure. All these conditions are associated with the development of an intracardiac thrombosis.
Peripheral pulse intensity asymmetry or systolic blood pressure difference between two arms may indicate aortic dissection. Weak or absent pedal pulses may be indicative of atherosclerotic occlusive peripheral arterial disease, which itself is strongly associated with atherosclerosis in other arteries (e.g. carotid and coronal arteries).
The neurological examination is essential to diagnose stroke and plan management. It is divided into many components: mental status, level of consciousness, cranial nerves, motor function, deep tendon reflexes, sensory function, cerebellar function, and gait. The neurological examination is intricate, but for the purpose of this chapter, a brief description of what physicians on a stroke team14 use to rapidly assess the patient’s neurological status is provided in the Appendix 1, the National Institutes of Health Stroke Scale (NIHSS) [19]. The score of the NIHSS helps localize the lesion, determine stroke severity, outcome, and appropriate patient management. Finally, after the patient’s stroke, a Modified Rankin Scale (Appendix 2) score is attributed for purposes of follow-up examinations.
Different stroke syndromes are encountered in ischemic stroke, depending on the vascular territory involved.
13
Gallop: an additional heart sound other than the first and second normal heart sounds
14
Stroke team: team of physicians responsible for the care of patients presenting with a stroke in the emergency room. They are responsible for deciding and administering thrombolytic therapy.
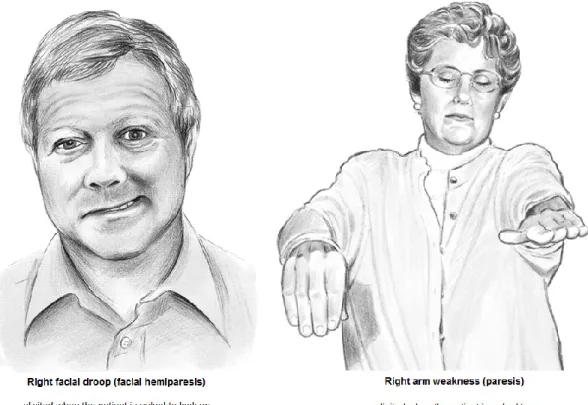
Middle cerebral artery occlusion produces contralateral hemiparesis and hemisensory loss of the face and upper limb, aphasia, and partial visual field loss (figure 1.8).
Figure 1.8: Signs of left middle cerebral artery (MCA) stroke. Right facial and upper limb weakness. Adapted and modified from [20].
Anterior cerebral artery occlusion produces contralateral hemiparesis and hemisensory loss of the lower limb, mutism, incontinence, cognitive and personality changes.
Ophthalmic or central retinal artery occlusion produces acute monocular blindness due to retinal ischemia. Patients may report seeing a black curtain moving in the visual field of one eye. If the symptom is transient, it is termed amaurosis fugax (“transient monocular blindness”), which is equivalent to a TIA. If the symptom is permanent, retinal infarction has occurred, much like an ischemic stroke. Amaurosis fugax is often an indicator of artery-to-artery embolization, originating either in the carotid or ophthalmic artery, as evidenced by the presence of a cholesterol embolus in the retinal artery.
Posterior cerebral artery occlusion produces visual field deficits (blindness may be partial in one or both eyes), loss of visual recognition (persons, objects, shapes), and amnesia.
Vertebrobasilar artery occlusion produces dizziness, double vision, visual field losses, difficulty swallowing, slurred speech, and uncoordinated gait (ataxia).
Lacunar strokes typically produce pure motor loss, pure sensory loss, or ataxic gait.
1.7.
Differential diagnoses
A physician elaborates a differential diagnosis based on all available clinical information. A differential diagnosis is a list of all possible disorders that can present in a similar fashion. Before making the final diagnosis, each possible disorder should be explored through focused investigations like blood tests and imaging; in other words, a workup. This helps narrow down the differential to a single diagnosis, after which appropriate treatment can begin. Disorders that present similarly to acute ischemic stroke are presented in Table I-III.
Differential diagnosis of acute ischemic stroke Neurological disorders
Hemorrhagic stroke
Transient ischemic attack (TIA) Seizure (especially post-ictal state) Brain tumour (abscess, malignant
tumour) Meningitis Benign vertigo
Neuropathies (Bell’s palsy, spinal cord trauma) Multiple sclerosis Cardiovascular disorders Syncope Myocardial infarction Arrhythmia Metabolic disorders Severe infection
Drugs (illicit or prescription) Low serum sodium
Hypoglycemia
1.8.
Workup
Once an acute stroke is suspected, the next step is determining if it is ischemic or hemorrhagic. Emergent treatment (thrombolysis, surgery) depends on this distinction. An immediate computed tomography (CT) of the head without contrast injection is required; it is a rapid and very accurate imaging examination to differentiate ischemic stroke from hemorrhage. A serum glucose level and electrocardiogram (ECG) should also be checked promptly.
On CT scan, hemorrhage appears bright (white), and infarction appears as darker (more lucent) than healthy brain parenchyma. Also, subtle early signs of infarction include loss of gray-white matter differentiation and effacement of cortical sulci (the normal folds in the cortex). If there is no hemorrhage but a suspected infarction, a CT scan with contrast injection or CT angiography (CTA) of the head and neck vessels is performed to search for occlusion of a major artery, localize the area of decreased perfusion, the infarct core and ischemic penumbra. CT scan images of the brain are shown in figures 1.9 through 1.11.

![Figure 1.6: Mechanisms of ischemic stroke. Adapted and modified from [9].](https://thumb-eu.123doks.com/thumbv2/123doknet/2074012.6742/43.918.223.689.121.716/figure-mechanisms-ischemic-stroke-adapted-modified.webp)

![Figure 2.3: Different Types of Vulnerable Plaque. Adapted from [33].](https://thumb-eu.123doks.com/thumbv2/123doknet/2074012.6742/79.1188.199.995.210.624/figure-different-types-vulnerable-plaque-adapted.webp)