THÈSE
En vue de l’obtention du
DOCTORAT DE L’UNIVERSITÉ DE TOULOUSE
Délivré par l'Université Toulouse 3 - Paul Sabatier
Présentée et soutenue par
Xi LIN
Le 22 février 2019
Study of memory effect in an Atmospheric Pressure Townsend
Discharge in the mixture N
2/O
2using
laser induced fluorescence
Ecole doctorale : GEET - Génie Electrique Electronique et Télécommunications : du système
au nanosystème
Spécialité : Ingénierie des Plasmas
Unité de recherche :
LAPLACE - Laboratoire PLAsma et Conversion d'Énergie - CNRS-UPS-INPT
Thèse dirigée par
Simon DAP et Nicolas GHERARDI
Jury
Mme Svetlana Starikovskaia, Rapporteuse M. Ronny Brandenburg, Rapporteur Mme Françoise Massines, Examinateur
M. Frédéric Marchal, Examinateur M. Philippe Teulet, Examinateur M. Simon DAP, Directeur de thèse
I would like to express my deepest thanks to my supervisor, Simon Dap. He has devoted so much time on teaching and leading me into the world of plasma physics. I am very appreciated for his patience and encouragement, also thanks to his support and rich discussion on physics, I finally achieve my thesis.
I would also like to express my thanks to Nicolas Naudé for the fruitful discussions and suggestions on electrical characteristics of discharge, and for his knowledge on electrode fabrication and on OES spectroscopy. Thanks to Nicolas Gherardi for his confidence and support on me.
Thanks to Prof. Svetlana M Starikovskaia and Prof. Ronny Brandenburg, for reviewing my thesis. I would also like to extend my gratitude to three other jury members, Prof. Françoise Massines, Prof. Feédéric Marchal and Prof. Philippe Teulet, for being the examiners of my work.
I appreciate the assistance and advice from the technicians and engineers of Laplace, Benoît Schlegel, Fédéric Sidor, Vincent Bley, Céline Combettes, Cédric Trupin, and Stéphane Martin. Without your kindly help, I cannot conduct my experiments.
I would also thanks to Richard Clergereaux and Freddy Gaboriau, for their support during the experiments.
I wish to thank my labmates, Rémi Berard, Christophère Laurent, Mathias Rojo, Luice Brès, Inès Martinko, Marvine Soumbo, Jacopo Profili, and Morgane Laurent, for their support and enthusiasm. Especially, thanks to Clémence Tyl, for her valuable information on simulation of discharge characteristics. And thanks to all of MPP group for your kindness and the surprise birthday celebration in 2017.
With a special mention to Shuangshuang, Yuchao, Jingjing in general, it is very delighted to have you in the laboratory. And my two best friends Hui and Shengyue, thanks so much for your company during the nearly four years’ life in Toulouse, without you, I would miss much happiness.
Thanks to my boyfriend Yifei. His knowledge of plasma simulation and kinetics helps me a lot, the discussion on plasma is an interesting topic linking us.
Finally, I would like to thank my beloved parents and grandparents for their infinite and firm support and love throughout my life, and especially nearly seven years’ life far from home.
1
CONTENTS ... 1
GENERAL INTRODUCTION ... 5
CHAPTER 1.
LITERATURE REVIEW AND CONTEXT OF THIS WORK ... 7
I.
GENERATION OF HOMOGENEOUS DISCHARGES AT ATMOSPHERIC PRESSURE AND BREAKDOWN
MECHANISMS... 7
I.1. Two main kinds of breakdown mechanism ... 8
I.1.1. Townsend breakdown ... 8
I.1.2. Streamer breakdown ... 9
II.
G
ENERATION OF A NON-
THERMAL PLASMA AT ATMOSPHERIC PRESSURE... 10
II.1. Decreasing the value of 𝑝 × 𝑑 ... 10
II.2. Generation of a corona discharge ... 10
II.3. Dielectric barrier discharges ... 11
III.
GENERATION OF A HOMOGENEOUS DBD AT ATMOSPHERIC PRESSURE ... 12
III.1. Different kind of homogenous DBD ... 12
III.2. Atmospheric pressure glow discharge (APGD) ... 13
III.2.1. Basic features of APGD ... 13
III.2.2. Memory effect in APGD ... 14
III.3. Atmospheric pressure Townsend discharge (APTD) ... 14
III.3.1. Basic features of APTD ... 14
III.3.2. Memory effect in APTD ... 16
CHAPTER 2.
EXPERIMENTAL SET-UP ... 25
I.
PLASMA VESSEL AND PUMPING SYSTEM ... 25
I.1. Discharge cell and power supply ... 25
I.1.1. Discharge cell ... 25
I.1.2. Power supply ... 27
I.2. Determination of the electrical characteristics of the discharge ... 27
I.2.1. Calculation of the gas gap voltage and the discharge current ... 27
I.2.2. Definition and calculation of the discharge power and of the energy dissipated in the discharge ... 28
II.
GENERAL CONSIDERATIONS ABOUT LASER INDUCED FLUORESCENCE ... 30
II.1. Principle of laser induced fluorescence ... 30
II.1.1. Fluorescence spectroscopy with single-photon excitation (LIF) ... 30
II.1.2. Fluorescence spectroscopy with two-photon excitation (TALIF) ... 30
II.2. Theoretical approach... 31
II.2.1. Measurements at low laser energy ... 32
II.2.2. Measurements at high laser energy ... 33
II.2.3. TALIF signal ... 33
II.2.4. Determination of the LIF/TALIF regime ... 34
II.2.5. Measuring the LIF/TALIF signal ... 34
II.3. Calibration method: obtaining absolute densities ... 36
2
III.
LIF/TALIF SETUP ... 38
III.1. Laser system ... 38
III.1.1. Configuration for measurement of N (2p34S 3/2) and Kr (4p61S0) ... 41
III.1.2. Configuration for measurement of O (2p43P J) and Xe (5p61S0) ... 42
III.1.3. Configuration for measurement of NO ... 44
III.2. Acquisition system and boxcar averager ... 44
III.3. Verification of the operation mode of photomultiplier tube ... 45
IV.
S
YNCHRONIZATION OF THE LASER PULSE,
DISCHARGE ANDB
OXCAR... 45
V.
MEASUREMENT PROCEDURE ... 46
CHAPTER 3.
TALIF MEASUREMENTS OF ATOMIC NITROGEN N (2P
34S
3/2) DENSITY ... 47
I.
VALIDATION OF TALIF MEASUREMENTS, CALIBRATION PROCEDURE AND EXPERIMENTAL ERRORS .... 47
I.1. Validation of TALIF measurements ... 47
I.2. Calibration procedure... 49
I.3. Influence of the gas temperature... 51
I.4. Experimental errors ... 53
II.
N (2P
34S
3/2) DENSITY IN N
2... 53
II.1. Evolution of the N (2p34S 3/2) density during a period of the applied voltage ... 54
II.2. Evolution of the N (2p34S 3/2) density along the discharge ... 54
II.3. N (2p34S 3/2) density as a function of the discharge power... 57
II.4. N (2p34S 3/2) density as a function of the gas flow rate ... 60
II.5. Evolution of the N (2p34S 3/2) density during the post-discharge ... 61
II.6. Summary ... 63
III.
N
(2
P34S
3/2)
DENSITY IN THE MIXTUREN
2/O
2... 63
III.1. N (2p34S 3/2) density in the discharge for different oxygen concentration ... 63
III.2. N (2p34S 3/2) density in post-discharge for different oxygen concentration ... 67
IV.
CONCLUSION ... 68
CHAPTER 4.
TALIF MEASUREMENTS OF ATOMIC OXYGEN O (2P
43P
J) DENSITY ... 69
I.
METHODOLOGY EMPLOYED FOR THE TALIF MEASUREMENTS ON O (2P
43P
J) ... 69
II.
CALIBRATION OF THE TALIF SIGNAL USING XENON ... 71
III.
I
NFLUENCE OF THE GAS TEMPERATURE ONTALIF
MEASUREMENTS... 74
IV.
ABSOLUTE ATOMIC OXYGEN DENSITY IN THE MIXTURE N
2/O
2... 75
IV.1. Absolute density of O (2p43P J) as a function of the position in the discharge for various oxygen concentration ... 75
IV.2. Absolute density of O (2p43P J) as a function of oxygen concentration ... 76
IV.3. Absolute density of O (2p43P J) as a function of discharge power ... 78
IV.4. Evolution of the O (2p43P J) density during a period of the applied voltage ... 80
IV.5. O (2p43P J) density in post-discharge for different oxygen concentration ... 81
V.
C
ONCLUSION... 82
CHAPTER 5.
LIF MEASUREMENTS OF ABSOLUTE NITRIC OXIDE NO(X
2
) DENSITY ... 83
I.
METHODOLOGY EMPLOYED FOR THE LIF MEASUREMENTS ON NO(X
2
) ... 83
II.
CALIBRATION OF NO(X
2
) MEASUREMENTS ... 85
3
III.2. Estimation of CT2 ... 88
III.3. Influence of the vibrational temperature... 90
IV.
OTHER EXPERIMENTAL DRAWBACKS ... 90
V.
A
BSOLUTE NITRIC OXYGEN DENSITY IN A MIXTURE OFN
2/O
2... 91
V.1. Absolute density of NO(X2) along the discharge for different oxygen concentration ... 91
V.2. Absolute density of NO(X2) as a function of oxygen concentration ... 92
V.3. Absolute density of NO(X2) as a function of discharge power ... 93
V.4. NO(X2) density in post-discharge for different oxygen concentration ... 94
VI.
CONCLUSION ... 95
CHAPTER 6.
DISCUSSION ... 97
I.
SUMMARY OF EXPERIMENTAL RESULTS ... 97
II.
INVESTIGATION OF THE SPECIES DENSITIES DURING THE POST-DISCHARGE ... 98
II.1. Decay of N(4S) during the post-discharge ... 101
II.2. Decay of O(3P) during the post-discharge ... 101
II.3. Decay of NO(X) during the post-discharge ... 101
III.
INVESTIGATION OF THE MEMORY EFFECT RELATED TO THE ASSOCIATIVE IONIZATION PROCESS ... 103
III.1. Determination of the absolute density of N2(A) ... 103
III.2. Determination of absolute density of N(2P) ... 104
III.3. Determination of electron density and current jump ... 106
III.4. Estimation of the current jump for different oxygen concentration ... 107
IV.
S
UMMARY... 109
GENERAL CONCLUSION AND PROSPECTS ... 111
APPENDIX 1 ... 115
I.
GENERAL DESCRIPTION OF THE MODEL... 115
II.
T
YPICAL EXAMPLES OF NUMERICAL RESULTS... 117
III.
VALIDATION OF THE MODEL ... 118
III.1. Optical emission over a half-period of electrical excitation ... 118
III.2. Production and destruction of metastable N2(A) ... 119
III.3. Optical emission for different oxygen concentration ... 120
IV.
IDENTIFICATION OF THE MAIN MECHANISMS INVOLVED IN THE PRODUCTION/DESTRUCTION OF
SPECIES OF INTEREST ... 121IV.1. N(4S) atoms ... 121
IV.1.1. Main mechanisms of production and destruction ... 121
IV.1.2. Temporal evolution of N(4S) density ... 122
IV.2. O(3P) atoms ... 124
IV.2.1. Main mechanisms of production and destruction ... 124
IV.2.2. Temporal evolution of O(3P) density ... 126
IV.3. NO(X) molecules ... 128
IV.3.1. Production ... 128
IV.3.2. Destruction ... 128
IV.4. Summary ... 128
V.
ORDER OF MAGNITUDE OF THE DENSITIES OF THE MAIN SPECIES OF INTEREST FOR DIFFERENT OXYGEN
CONCENTRATION... 129
4
VI.1. Influence of the reaction N2(A) + O( P) → NO + N( D) on the formation of NO ... 131
VI.2. Influence of the rate coefficient of reaction N(2P) + N
2→ N2+ N(4S,2D) ... 131
APPENDIX 2 ... 137
REFERENCES ... 139
5
General introduction
Dielectric barrier discharges (DBD) are a kind of non-equilibrium discharges, in which at least one electrode is covered by a dielectric. Operating at atmospheric pressure, the value of the product pressure×gas gap distance (𝑝 × 𝑑) is usually high, which results in a discharge characterized by a large number of independent streamers generated between the two electrodes. It corresponds to the filamentary mode. Nevertheless, under some typical conditions, the discharge can be uniform. These conditions can be related to the power supply, the geometry of the discharge cell, the gas atmosphere, the dielectrics... This kind of homogeneous discharge is suitable for many applications such as thin film deposition or surface treatment. It is thus interesting to understand how to obtain such homogeneous discharges in atmospheres containing complexes molecular precursors and/or oxidizing gases.
Two main kinds of homogeneous DBDs can be obtained. One is obtained in noble gas such as helium or argon. For these discharges, the most luminescent layer is located close to the cathode and their electrical characteristics are very similar to those of a glow discharge obtained at low pressure. These discharges are then called Atmospheric Pressure Glow Discharges (APGD). The other type of homogeneous discharge is usually obtained in a nitrogen atmosphere. In this case, the luminescent layer is located near the anode, and its electrical characteristics are very similar to those of a Townsend discharge generated at low pressure. This kind of discharge is named Atmospheric Pressure Townsend Discharge (APTD) and constitutes the main interest of the present work.
To obtain an APTD, it is necessary to decrease the electric field for the breakdown to occur which is possible if seed electrons are present in the gas volume. In the case of periodic discharges, these seed electrons can originate from the previous discharge: this is the memory effect. It is known from previous studies that several mechanisms arising between two successive discharges can participate in this memory effect, the relative importance of these different mechanisms being strongly related to the experimental conditions. In particular, many experiments put in evidence that a small addition of oxidizing gas into nitrogen can greatly enhance this memory effect thus increasing the working domain of the discharge. It suggests the occurrence of a phenomenon taking place in the discharge volume. A possible candidate is the associative ionization reaction between nitrogen metastable atoms N(2P) and oxygen atoms O(3P): N( P2 ) + O( P3 ) → NO+ + e−. In this reaction, the N(2P) atoms
are formed during the excitation of ground state atoms N(4S) by N
2(A) metastable molecules:
N( S4 ) + N2(A) → N( P2 ) + N2(X). The main purpose of the present work is to check the consistency
of this hypothesis. In this perspective, the most direct method is to determine the absolute densities of the involved species, namely N(4S) and O(3P) atoms between two discharges. For this purpose, two
photon laser induced fluorescence measurements (TALIF) are performed. Moreover, the density of NO molecules, which is an efficient quencher of metastable nitrogen species are also determined by laser induced fluorescence (LIF) measurements. The obtained results together with a modeling of the main chemical mechanisms can then be used to quantify the contribution of the aforementioned associative ionization reaction in the memory effect.
The manuscript is organized as follows:
Chapter 1 presents general considerations about atmospheric pressure discharges. First, the different breakdown mechanisms are described. Then, the more specific case of dielectric barrier discharges is considered. The end of this chapter is dedicated to the APTD and to the different mechanisms involved in the memory effect. Finally, the aim of the present work is described in details.
6
configuration of the discharge cell and the electrical system. Then, the general principle of the laser induced fluorescence technique is presented and the calibration procedure allowing to obtain absolute densities from the measured signals is explained. Finally, the different experimental configurations used for the LIF and TALIF measurements are presented.
Chapters 3, 4 and 5 present the results of the measurements for N(4S), O(3P) and NO(X) respectively
obtained in different experimental conditions. The effect of the main parameters on the density of the different species is discussed. In particular, a careful attention is paid to the influence of the oxygen concentration. The main mechanisms involved in the production and destruction of the different species are investigated using a model developed in the group. The latter is described in Appendix 1.
Chapter 6 is dedicated to discussions based on the results presented in chapters 3, 4 and 5. In the first part, the evolution of the different species densities in the post-discharge region is discussed. In the second part, the influence of the aforementioned associative ionization reaction on the memory effect is estimated using a model.
Finally, the main results of the present work are summarized and prospects are proposed for further investigations.
7
Chapter 1. Literature review and context of this work
This chapter starts with a general description of plasmas and of the different breakdown mechanisms. Then a brief review of the different kind of discharges generated at atmospheric pressure, especially dielectric barrier discharges, is provided. After that, the generation of a homogeneous DBD at atmospheric pressure is discussed, including “glow discharge” and “Townsend discharge”. Then, the mechanisms allowing the generation of a Townsend discharge at atmospheric pressure are presented, especially for the necessity of a memory effect between two successive discharges. Finally, the main purposes of the present work are described in this context.
I. Generation of homogeneous discharges at atmospheric pressure and breakdown
mechanisms
Plasma is the fourth state of matter, which refers to a quasi-neutral partially or totally ionized gas, primarily composed of electrons, ions, photons, as well as atoms and molecules in their fundamental or excited states with a net neutral charge.
If the plasma is at thermodynamic equilibrium, a single temperature can be used to completely characterize the system (assuming that the density is known). This is typically the case for the so-called “hot plasmas” encountered in fusion and astrophysics where the ionization degree approaches unity. Laboratory plasmas have typically low ionization degrees and two different kinds of plasmas can be distinguished. Usually, at atmospheric pressure, the high electron-neutral collision frequency can result in so-called thermal plasmas where the electron temperature is close to the neutral temperature. This is typically the case of arc discharges. These plasmas are generally close to the local thermodynamic equilibrium (see e.g. [1] for more details). It implies that the gas temperature is generally high which can induce several drawbacks regarding specific industrial applications [2]. On the opposite, non-thermal plasmas, often called “cold plasmas”, are out of thermodynamic equilibrium. The kinetic temperature of heavy species (ions, atoms, molecules…) is lower than the electron temperature, and remains sufficiently low to make non-thermal plasmas suitable for industrial applications. This kind of plasma is generally obtained in low-pressure conditions. Nevertheless, it is possible to obtain non-thermal plasmas at elevated pressure (e.g. atmospheric pressure) using appropriate conditions and setup as illustrated in section II and III.
In non-thermal plasma, most of the electrical input energy is generally spent to the production of energetic electrons rather than in gas heating. These energetic electrons can, in turn, produce a large number of excited species, free radicals, ions and photons (through excitation and recombination) allowing a large variety of plasma applications such as polymer surface treatment, food decontamination, pollution control applications, etc. [3–9]. In addition, cold plasma technologies have other advantages like high excitation selectivity, high efficiency, low pollution, relatively low maintenance requirements, etc. In this frame, non-thermal plasmas generated at atmospheric pressure are promising. Indeed, the manufacturing costs can be drastically reduced since there is potentially no need to use a vacuum system. Depending on the operating conditions, atmospheric cold plasmas can exhibit a filamentary or a homogeneous structure. Filamentary discharges are adapted and suitable for many applications [4,10]. Nevertheless, homogeneous discharges are more suitable for specific applications such as thin film coatings [3,5,6,11–13]. Consequently, the understanding of the mechanisms involved in the obtaining of a homogeneous discharge at atmospheric pressure is of primary importance and constitutes the purpose of the present work.
8
To go further, it is necessary to understand the different breakdown mechanisms occurring in electrical discharges, which is the aim of the following section.
I.1. Two main kinds of breakdown mechanism
Electrical breakdown occurs in a gas when the applied voltage across the gas gap exceeds the breakdown voltage. The initially insulating gas then becomes conducting. There are two main mechanisms of breakdown whose occurrence mainly depends on the product 𝑝 × 𝑑 where 𝑝 is the gas pressure and 𝑑 represents the gas gap value. For relatively low values of 𝑝 × 𝑑, a Townsend Breakdown is generally observed whereas for higher values of 𝑝 × 𝑑 (typically above few Torr.cm) a streamer breakdown occurs. These two mechanisms are described below [14].
I.1.1. Townsend breakdown
Figure 1-1 shows the mechanism of Townsend breakdown, where the discharge is ignited by a DC power supply between two plane electrodes separated by a gap 𝑑. The resulting homogeneous electric field is equal to 𝑉 𝑑⁄ . Let us consider an initial condition for which some primary electrons present near the cathode are accelerated in the electric field towards the anode. If they have a sufficient kinetic energy these accelerated electrons can ionize the gas, then producing more and more electrons. The multiplication of electrons along the electric field can be expressed by:
𝑑𝑛𝑒
𝑑𝑥
= 𝛼𝑛
𝑒 (1.1)where 𝛼 is the Townsend ionization coefficient, then the total number of electrons should be:
𝑛
𝑒= 𝑛
𝑒0exp(𝛼𝑑) = 𝑛
𝑒0exp (
𝛼
𝑝
𝑝𝑑)
(1.2)where 𝑛𝑒0 is the initial primary density of electron in front of the cathode, and 𝛼
𝑝
= 𝐴𝑒𝑥𝑝 (−
𝐵𝑝𝐸
)
(1.3)where E is the electric field, A and B are constants related to nature of the gas.
9 Thus, in the gap, each electron would create [exp(𝛼𝑑) − 1] positive ions, if we consider that there are no losses of electrons due to recombination or attachment onto electronegative species. Then, all these positive ions would arrive at the cathode emitting 𝛾 (exp(𝛼𝑑) − 1) electrons by secondary electron emission. Here, 𝛾 is the secondary emission coefficient.
Hence, to sustain the discharge, positive ions produced during the electron avalanche must generate at least one electron during the bombardment of the cathode to start a new avalanche, which means:
𝛾 (exp(𝛼𝑑) − 1) = 1 (1.4)
Finally, this self-sustained condition is related to the cathode material, the value of 𝑝 × 𝑑 and of 𝐸 𝑝⁄ i.e. the gas pressure, the gap distance and the electric field. The discharge ignited by Townsend breakdown has a uniform appearance.
I.1.2. Streamer breakdown
For higher values of 𝑝 × 𝑑, usually higher than a few dozens of Torr.cm, the breakdown develops much faster than Townsend breakdown [15]: this is the streamer breakdown. This very fast mechanism arises when the multiplication factor exp(𝛼𝑑) exceeds 108. In these conditions, the ion
and electron densities resulting from a single avalanche are very high. Moreover, this phenomenon arises at a very small timescale in such a way that only electrons can move towards the anode whereas ions are immobile. This induces space charge electric fields with a magnitude comparable to the applied electric field one.
There exist two different kinds of streamers: the cathode directed streamer (CDS) also called positive streamer and the anode directed streamer (ADS) also known as negative streamer. In the case of a CDS (see Figure 1-2(1)), the ionizing wave moves in the opposite direction of electrons. For a CDS in air, photons originating from the radiative decay of excited species in the primary avalanche create seed electrons between the primary avalanche and the cathode. These seeds electrons then induce the secondary avalanches, which rapidly converge towards the positive space charge of the primary avalanche. Then, new photons are emitted and the process starts again. The photo-ionization process due to the ionization of O2 molecules dominates the creation of seed electrons for a CDS in
air to propagate. Further investigations found that, even in pure nitrogen with very low addition of oxygen (<1ppm), the propagation can be obtained with the same velocity as that in air. The background ionization was then proposed to create free electrons[16,17]. In conclusion, to realize the propagation, the creation of seed electrons is necessary to induce the following avalanche.
Figure 1-2 Breakdown mechanism of a streamer breakdown. Propagation of (1) CDS (2) ADS [14]
10
In the case of an ADS (see Figure 1-2(c)), the streamer propagates in the same direction as the electron motion i.e. towards the anode. In this case, the photo-ionization creates seed electrons between the primary avalanche and the anode, which in turn induce secondary avalanches. The photo-ionization phenomenon is not a necessary condition for the negative streamer to propagate but it contributes to accelerating its propagation.
Streamer breakdown leads to the appearance of conducting channels in which the heating of the gas can be important. In the case of metallic electrodes, an arc can develop leading to thermal plasma. If electrodes are covered by a dielectric material, the charge accumulation onto the dielectrics induces a drop of the gas gap voltage leading to the disappearance of the filament, preventing the transition to spark.
II. Generation of a non-thermal plasma at atmospheric pressure
According to the previous discussion, the high value of the product 𝑝 × 𝑑 for atmospheric pressure discharges can easily lead to streamer breakdown and then to the formation of an arc. To avoid the transition to a thermal plasma in such conditions, different approaches can be used. In the following, three different strategies are briefly presented.
II.1. Decreasing the value of 𝒑 × 𝒅
The basic principle of micro-discharges is to reduce the characteristic gas gap in order to recover a low value of the product 𝑝 × 𝑑 for high-pressure conditions. An example of such discharge is the Micro Hollow cathode discharge (MHCD) [18]. It is generated in a metal/dielectric/metal sandwich structure into which a hole is drilled with a typical gas gap ranging from dozens of µm to hundreds of µm. In this configuration, it is possible to obtain different stable regimes depending on the discharge current such as Townsend-like discharges, glow discharges or constricted arcing for higher currents [19].
II.2. Generation of a corona discharge
The corona discharge is usually ignited near sharp points, generally a pin or a thin wire (one electrode) where the electric field is enhanced. Ionization, excitation, and chemical processes mainly occur near the sharp electrode where the electric field is high, defining the active volume of the discharge [2]. The discharge normally does not extend to the counter electrode. The electric current necessary to close the circuit is due to the drift of ions towards the counter electrode in the low electric field. According to the polarity of the electrode where the high electric field is located, corona discharges can be divided into negative corona discharges (i.e. the high electric field is located near the cathode) and positive corona discharges (i.e. the high electric field is located near the anode). The ignition mechanisms are actually similar to the Townsend breakdown and positive streamer breakdown respectively [2].
The power of continuous corona discharges is relatively weak which limits many applications. If we increase the amplitude of the high voltage, the transition from corona discharges to sparks or even arcs would occur. To prevent this transition, pulsed corona discharges can be used. Indeed, voltage pulses in the nanosecond range can be short enough to prevent the transition from streamers to sparks and then to maintain a non-thermal plasma. These discharges are used in many practical applications such as generation of ozone, water depollution, removal of NOx and SO2 from flue gas,
11
II.3. Dielectric barrier discharges
Besides the narrowing of the gas gap distance and the use of a pulsed corona discharge, another approach to prevent the transition to an arc is to add a dielectric barrier between two electrodes. This kind of discharge is called dielectric barrier discharge (DBD).
Figure 1-3 illustrates typical volume DBD configurations. The planar configuration is mainly used for surface treatment whereas the cylindrical configuration is suitable for gas treatment and UV generation. Other types of DBDs exist such as surface DBD (SDBD) and coplanar discharge, but they are beyond the scope of this thesis.
Figure 1-3 Typical DBD configurations [25]
DBDs were first investigated by Siemens in 1857 and used for ozone generation [26]. First observations relate the appearance of amounts of micro-discharges distributed randomly along the electrodes, which could ignite and extinguish independently. The first photographs of these micro-discharges were obtained by K.Buss [27] in 1932. More investigations on the physical nature of DBDs were made by Klemenc [28] in 1937. Figure 1-4 shows a simplified diagram of a single micro-discharge in a DBD with two dielectrics at each electrode and its equivalent circuit. When the streamer breakdown occurs, the discharge current increases dramatically and charges accumulate onto the dielectric surfaces. As a consequence, the electric filed applied on the gas would decrease which induces the extinction of the discharge instead of its transition to an arc.
Figure 1-4 Diagram of a single micro-discharge and the equivalent circuit [29]
As explained in section I, homogeneous discharges are suitable for many applications, especially for surface treatment and thin film deposition. The next section is dedicated to the generation of homogeneous DBDs at atmospheric pressure.
12
III. Generation of a homogeneous DBD at atmospheric pressure
In this section, we present the different homogeneous discharges observed in a DBD configuration. Two main kinds of homogeneous DBDs are presented including their electrical and optical characteristics, and the mechanisms involved in their generation. Then, we focus on the atmospheric pressure Townsend discharge (APTD) and a review of the current knowledge about the memory effect allowing obtaining them is provided. Finally, the main purpose of the present work is presented.
III.1. Different kind of homogenous DBD
The first homogeneous DBD was observed in 1969 by R. Bartnikas in helium [30,31] but the first clear evidence of such discharge regime was brought by the group of S. Okazaki in 1988 [32] and was called “Atmospheric Pressure Glow Discharge” (APGD). Then, by inserting a fine wire mesh between the electrode and the dielectric [33], this group succeed in generating a homogeneous discharge in different gas atmospheres, such as air, nitrogen, argon, and oxygen. After that, more and more teams started to contribute to the understanding of the mechanisms involved in the formation of homogeneous DBD, especially, the team of F.Massine [34,35] and J.R.Roth [36,37]. In parallel to these works, industrial applications were developed taking advantage of their uniform feature for surface treatment and thin film coating [3,5,6,11–13].
APGD takes its name from its similarities with the well-known glow discharge at low pressure. It is obtained for the sufficiently high value of the discharge current. The ion density in this regime is high enough to allow the formation of a cathode fall region characterized by a high space charge electric field.
In nitrogen-based mixtures, another discharge regime was obtained and called “Atmospheric Pressure Townsend Discharge” (APTD) [38]. In this regime, the current is lower than in APGD and the small charged particles density is not sufficient to efficiently affect the electric field. Due to the higher mobility of electrons compared to ions, the electron density is lower than the ion density. Consequently, there is no plasma zone in an APTD.
Both APGD and APTD result from a Townsend breakdown. To obtain a Townsend breakdown at this high value of 𝑝 × 𝑑, it must occur for a low electric field value to avoid streamers formation. This is possible if a small amount of seed electrons is present just before the breakdown.
It is interesting to note that homogenous glow discharges can also be obtained starting from streamer breakdown [39], but only in the presence of seed electrons. In this case, seed electrons are responsible for an increase of the number of primary avalanches and if their density is high enough, it limits the space charge electric field, which becomes uniform thus avoiding the convergence of every avalanche into a single one. This is the streamer coupling breakdown.
The above discussion shows that the presence of seed electrons is a necessary condition to obtain a uniform DBD. These seeds electrons can be provided by an external source such as photo-ionization by a laser [39]. In this case it is called pre-ionization. For periodic discharges, seed electrons can be produced by different mechanisms resulting from the previous discharge. In this case, it is called memory effect.
In the next sections, we describe especially the investigation history in our group on the basic features of APGD and APTD together with the different mechanisms involved in the memory effect which allows a Townsend breakdown to occur.
13
III.2. Atmospheric pressure glow discharge (APGD)
III.2.1. Basic features of APGD
The APGD was first obtained in helium as a homogeneous discharge [34]. Figure 1-5(a) shows a typical oscillogram of the discharge current and applied voltage of an APGD obtained in helium and (b) a similar oscillogram of a filamentary discharge for comparison. The discharge current is composed of a single pulse suggesting that the discharge is homogenous. On the contrary, the filamentary discharge exhibits several current pulses each one corresponding to one micro-discharge.
Figure 1-5 Current-voltage oscillogram of (a)a homogeneous DBD [40] (b) a filamentary DBD [41]
Figure 1-6(a) shows a picture of the inter-electrode space of an APGD at the maximum of the discharge current. One can clearly see different bright and dark zones corresponding to the typical glow discharge structure. The brighter zone near the cathode corresponds to the cathode fall and to the negative glow, then a dark zone is observed corresponding to the Faraday dark space whereas the bright zone near the anode corresponds to the positive column. This discharge structure can also be observed on the numerical results presented in Figure 1-6(b). The electric field is maximum in the cathode fall, becomes close to zero in the negative glow and keeps a constant and small value in the positive column. The ion density increases dramatically near the cathode to form the cathode fall whereas electrons are efficiently repelled. In the rest of the discharge, electron and ion density are nearly equal defining a quasi-neutral plasma.
(a)
14
Figure 1-6 (a) Photograph of inter-electrode of an APGD in helium [42] (b) Spatial evolution of the electric field, the ion, and the electron densities of an APGD in helium at the time when the discharge current is maximum [42]
III.2.2. Memory effect in APGD
It is now well accepted that the memory effect in APGD is related to Penning ionization process [38]. Penning ionization refers to the interaction between an excited-state atom and a target molecule, resulting in its ionization. Let us consider as an example the case of an APGD in helium in presence of some impurities such as nitrogen molecules. Due to their long lifetime, metastable helium atoms He(23S) can remain in the gas phase between two successive discharges. The energy of these
metastable atoms (19.8 eV) is higher than the ionization potential of N2 (15.57 eV), a Penning
ionization process can occur. It leads to the production of seed electrons allowing a Townsend breakdown to occur.
This process is not restricted to helium and APGD can be generated in other noble gases such as neon or argon whose respective metastable states have energies of 16.6 and 11.5 eV, in the presence of molecular impurities with lower ionization thresholds (e.g. NH3 for argon and N2 for neon).
III.3. Atmospheric pressure Townsend discharge (APTD)
III.3.1. Basic features of APTDUp to now, APTD has been obtained in nitrogen, oxygen, and helium, and in air at atmospheric pressure [38,43–45]. In this work, we will mainly focus on APTD generated in the nitrogen-based atmosphere. Figure 1-7(a) shows an oscillogram of such kind of discharge. The discharge current presents only one current pulse for each half period of the applied voltage, typical of homogenous discharges. The homogeneity of the discharge is confirmed on the picture presented in Figure 1-7(b), which represents a short time exposure photograph of the inter-electrode space at the maximum of the discharge current. One can clearly see a bright zone located near the anode, which is characteristic of the Townsend discharges. To understand this feature, Figure 1-8 represents some results of a fluid simulation of an APTD discharge in nitrogen at the maximum discharge current [46], namely, the reduced electric field, the main ion density (N4+), the electron density and the density of
(a)
15 the nitrogen metastable molecule N2(A) which is the dominant one. The electron density increases
exponentially from the cathode to the anode, as predicted by equations (1.1) and (1.2), but remains relatively low with a maximum value about 108 cm-3. The density of N
4+ increases from the anode to
the cathode up to 2 1010 cm-3, but there is no ion accumulation near the cathode as in APGD. Thus,
there is no cathode fall formation and the electric field only slightly varies along the gas gap. Consequently, the maximum excitation rate occurs near the anode where the electron density is maximum explaining the bright zone observed on the photograph presented in Figure 1-7(b). Finally, it is interesting to note that the density of N2(A) metastable molecules can reach very high values, the
maximum density on the order of 1013 cm-3 being obtained on the anode side. We will come back to
this important point in the following section.
Figure 1-7 (a)Current-voltage oscillogram of a APTD [47](b) Photograph of inter-electrode space of an APTD with a time exposure of 10 ns [42].
Figure 1-8 Simulations results showing the spatial evolution of density of ions and electrons, the reduced electrical field calculated at the maximum of current in an APTD generated in high purity nitrogen [46]
In section III.1, we discussed the necessary presence of seed electrons to obtain a Townsend breakdown. In the next section, a review of the different mechanisms able to produce seed electrons between two successive discharges is presented.
(a)
16
III.3.2. Memory effect in APTD
Figure 1-9 shows the temporal evolution of the applied voltage and discharge current during the first periods of an APTD generated in high purity nitrogen. One can see that the first two discharges are filamentary as indicated by a large number of micro-discharges visible on the discharge current. On the contrary, the third discharge and the following ones are homogeneous with one single current pulse per half-period of the applied voltage. This clearly indicates the building up of a memory effect during the first discharge period.
Figure 1-9 Electrical characteristics of the first discharge periods of an APTD in nitrogen [38]
A marker of this memory effect can be seen on the discharge current of Figure 1-10 where the permanent regime is reached. When the gas gap voltage approaches zero, a discharge current is present despite the fact that the discharge is extinguished. Moreover, when the gas gap polarity reverses, the sign of the discharge current rapidly changes suggesting that electrons, which have a high mobility compared to ions, contribute significantly to this current. Consequently, this current jump is related to the presence of seed electrons [48] and its magnitude for a given condition is related to the strength of the memory effect. Thus, the determination of the current jump allows quantifying the memory effect.
A definition of the current jump is proposed in [48]. It can be defined as the mean value of the absolute value of the discharge current when the discharge is turned off, divided by the electrode surface (see equation (1.5)). The analysis interval ∆𝑡 is defined by the time between the zero passage of the discharge current 𝑡0 and the moment when the time derivative of the discharge current is
equal to zero. 𝐼𝑗𝑢𝑚𝑝= 1 2×∆𝑡×𝑠𝑢𝑟𝑓𝑎𝑐𝑒∫ |𝐼𝑑(𝑡)|𝑑𝑡 𝑡0+∆𝑡 𝑡0−∆𝑡 (1.5)
17
Figure 1-10 Oscillogram of an APTD in nitrogen with 25 ppm O2 [48]
Many studies were devoted to elucidating the mechanisms involved in the production of these seed electrons between two successive discharges in different experimental conditions. A brief review of these studies is provided in the following.
III.3.2.1. Role of the N2(A) metastable molecules
Numerous works performed by Massines et al. [38,49] showed that a significant amount of N2(A)
metastable molecules is necessary to obtain a Townsend discharge in nitrogen. As shown in Figure 1-8, the density of N2(A) reaches its maximum value near the anode where the electron density is
higher. Indeed, the formation of N2(A) results from electron excitation of N2 molecules [50], either
directly during the reaction e−+ N
2→ e−+ N2(A) or during the deactivation of N2(B) state through
the reaction N2(B) + N2→ N2(A) + N2 where the production of N2(B) also involves electron excitation.
When the polarity of the gas gap voltage reverses i.e. when the anode becomes cathode, the latter is submitted to a significant N2(A) flux by diffusion inducing secondary emission of electrons [51]. This
continuous production of seed electrons results in a measurable current corresponding to the current jump. As soon as the voltage becomes sufficient, avalanches develop starting from these seed electrons and the discharge current rises exponentially. This is the breakdown voltage, which diminishes when the amount of seed electrons increases.
Obviously this process is highly related to the secondary emission coefficient . The latter can be greatly enhanced by the electron accumulation onto the dielectric surface during the previous discharge i.e. when the electrode is the anode. This mechanism is in good agreement with the numerical model developed by Khamphan et al. [52]. Indeed, the author showed that a necessary condition to obtain a good description of the discharge behavior was to consider a variable coefficient whose value depends on the charge accumulated onto the dielectrics (see Figure 1-11).
18
Figure 1-11 The variation of secondary emission coefficient during the whole period of the conduction current [53]
III.3.2.2. Spontaneous electron desorption
The spontaneous electron desorption mechanism was proposed by Golubovskii et al. [54] to explain the production of seed electrons leading to the generation of APTD. Nevertheless, this hypothesis was excluded later [55] because it was not able to explain the homogeneous to filamentary transition observed when a significant amount of efficient quenchers of N2(A) such as NH3 or O2 molecules are
added into N2. On the contrary, these experimental observations reinforced the hypothesis of an
important role played by N2(A).
However, more recent experimental works during which homogeneous Townsend discharges were obtained in air or in flowing nitrogen at very low frequency (dozens of Hz), bring a renewed interest on this mechanism [43–45]. In these experiments, the density of N2(A) metastable molecules is very
low or even zero either because of its very high quenching rate by oxygen molecules and their dissociation products, or due to the very long off-time between two successive discharges during which the whole gaseous medium is renewed. In this case, it is clear that only mechanisms arising at the dielectric surfaces can be responsible for the released of seed electrons making spontaneous desorption the most probable mechanism. The very small number of seed electrons released by this mechanism probably explains why APTDs can only be obtained in air for very low frequency i.e. for a smooth rising slope of the applied voltage.
III.3.2.3. Gas phase mechanisms in N2 with small admixture of oxidizing gases
1) Highlight of the special discharge behavior of an APTD generated in N2 with small addition of
oxidizing gases
We saw previously that in high purity nitrogen, the secondary electron emission induced by N2(A) can
play a significant role in the memory effect. In the previous section, we explained that the generation of APTD in air only involves surface mechanism such as the spontaneous desorption of electrons. Nevertheless, the aforementioned mechanisms are unable to explain the experimental behavior observed when a small amount of oxidizing gases is added to nitrogen [48,55,56].
19 Figure 1-12(a) represents the temporal evolution of the discharge current for an APTD in high purity N2 and in N2 with an addition of 50 ppm of O2, for the same applied voltage. If one compares the case
N2+50 ppm O2 to the high purity nitrogen case, one can see that: the discharge ignition occurs earlier,
the current jump is higher and the amplitude of the discharge current is higher suggesting a higher discharge power. Nevertheless, if the amount of injected oxygen is too high, the obtained discharge becomes filamentary as indicated on Figure 1-12(b) which represents the discharge current for a mixture of N2 with 500 ppm of O2 for the same applied voltage. These observations suggest that a
mechanism arising in the gas phase enhances the memory effect for small oxygen addition.
Figure 1-12 Comparison of the discharge current for the same condition (Va=12 kVpp, f=2 kHz) in (a) high purity nitrogen and
N2+50 ppm O2 and (b) N2+500 ppm O2 [56]
To go further in the investigation of this phenomenon, many optical and electrical measurements were performed in our group. The principle of these measurements is described in the following. Then, a small review of the main results obtained in these studies and the corresponding discussions are presented.
2) Investigations on the explanation of this phenomenon
a) Description of the optical emission spectroscopy and electrical measurements
Optical emission spectroscopy (OES) can bring information regarding the relative density of different species of interest. A typical spectrum of APTD in high purity nitrogen is provided in Figure 1-13(a) and a magnification of the spectrum in the range 220-290 nm is provided in Figure 1-13(b). Several emission bands can be identified on this spectrum such as the N2 second positive system (N2-SPS) and
Hermann Infrared system (N2-HIR). An interesting point is that the spectrum also exhibits the
emission bands of oxidizing species such as the NO system or the O(1S)-N
2 green band, despite the
high purity of the nitrogen gas used, indicating that the presence of oxidizing species is unavoidable. A possible explanation is that oxygen comes from the interaction between the discharge and the alumina plates used as dielectrics.
20
Figure 1-13 (a) Optical emission spectrum of APTD in high purity nitrogen (b) magnification of NO(γ) system [48]
The emission intensity of these bands can be used to estimate the relative densities of the different species involved in the formation of the corresponding excited states [48,55,56]. Table 1-1 summarizes the mechanisms leading to the formation of the different excited states and the relations between the emission intensities and the relative densities.
Table 1-1 Summary of the mechanisms involved in the formation of the excited emitting species
Emission
bands Mechanisms for the production of the excited state N2-HIR N2(A) + N2(A) → N2(C”5Πu) + N2
NO(γ) NO(X) + N2(A) → NO(A) + N2(X)
ON2* O( P
3 ) + N
2(A) → O( S1 ) + N2
O( S1 ) + 2N
2→ O( S1 )N2+ N2
To study the evolution of the electrical characteristics of the discharge along the gas flow, a dedicated setup was developed during the Ph.D. thesis of Mohamed Cherif Bouzidi [56]. The ground electrode was divided into 8 stripes in the gas flow direction, allowing local current measurements. A simplified schematic description of the device is shown in Figure 1-14(a).
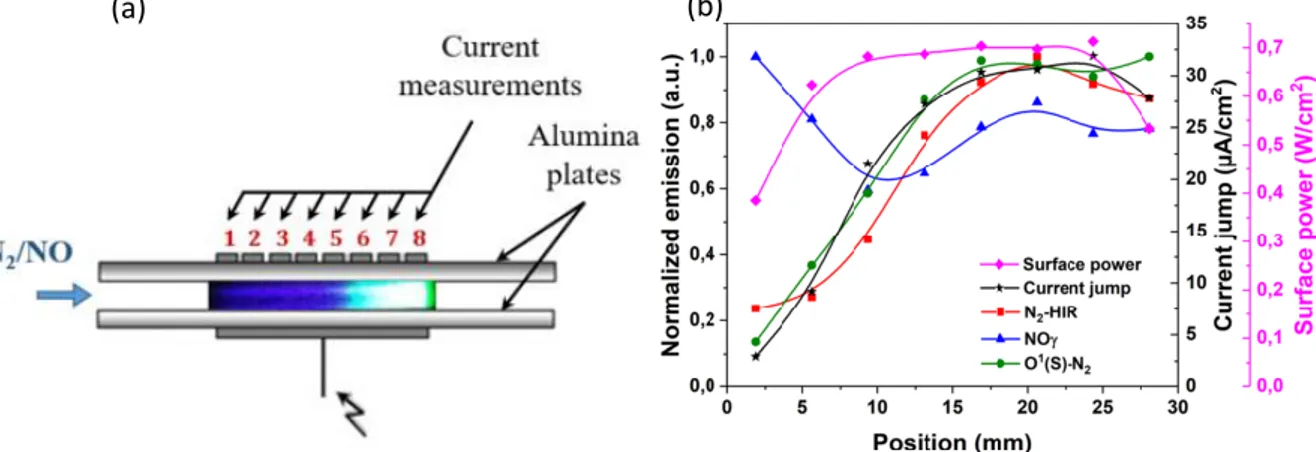
b) Experimental investigations in N2/NO mixtures
A picture of the discharge in the mixture N2+30 ppm NO [48] is depicted in Figure 1-14(a). As can be
seen, the color of the discharge dramatically changes along the gas flow from violet to green suggesting that significant changes in the gas composition take place along the gas flow. The spatial evolutions of the main emitted intensities between two successive discharges are depicted Figure 1-14(b), together with the evolutions of the current jump and discharge surface power. One can see that the N2-HIR and O(1S)-N2 emissions increases from the entrance to the exit of the discharge
indicating an increasing density of N2(A). On the contrary the NO system emission decreases which
is necessary due to a decrease of the NO concentration since the N2(A) concentration increases. A
probable explanation is that NO molecules are dissociated through the reaction N( S, P,4 2 2D) +
NO → N2+ O(3P,1D), thus producing O(3P) atoms which contributes to the increase of the O1S-N2
emission. The increase of the N2(A) density with the position can be attributed to both the increase
of the discharge power and the decrease of its overall quenching rate since the NO dissociation products such as O(3P) or O
21 The current jump increases along the gas flow indicating an increase of the memory effect. It is interesting to note that it seems to be correlated with the evolution of the N2-HIR and O(1S)-N2
emissions.
Figure 1-14 (a) Visual aspect of 8 stripes of an APTD; (b) Correlation between the current jump, the surface power and N2-HIR, NOγ, O(1S)-N2 emissions as a function of the position of an APTD. Measurement conditions: f=2 kHz, HV=13 kVpp,
gap=1 mm, concentration of NO = 30 ppm [48]
c) Experimental investigations in N2/O2 mixtures
Similar systematic studies were also performed in [48,56] for small oxygen addition into N2. An
example of the results obtained for 50 ppm of O2 is presented in Figure 1-15(a).
In this case, the intensities of the N2-HIR, O(1S)-N2 and NO emissions increase along the gas flow
together with the current jump. The increase of the N2-HIR emission suggests an increase of the N2(A)
density, which can be explained by an increase of the discharge power. In a Townsend discharge, O(3P) atoms are mainly produced during O
2 dissociation through the reaction
N2(A) + O2→ N2+ 2O(3P), rather than by electron impact dissociation because of the low electron
density compared to the N2(A) density. Consequently, the increase of the O(1S)-N2 emission probably
results from both the increase of the N2(A) density and O(3P) density. Finally, the NO molecules can
be produced through the reactions: N2(A) + O(3P) → NO + N(2D) and N(2D) + O2→ O(3P) + NO.
Figure 1-15 Correlation between the current jump, the surface power and N2-HIR, NOγ, O(1S)-N2 emissions as a function of (a)
position of discharge with an addition of oxygen of 50 ppm; (b) concentration of O2 at the gas output on the 8th zone.
Measurement conditions: f=3 kHz, HV=12 kVpp, gap=1 mm.[48]
(a) (b)
22
Thus, the increase of the NO emission intensity is related to the increase of the N2(A) and NO
densities. Note that, as for the case of NO addition into N2, the spatial evolution of the current jump
is strongly correlated to the evolution of the N2-HIR and O(1S)-N2 green band emission intensities. To
push forward the investigation of these correlations, systematic measurements were performed for different oxygen concentrations. The corresponding results are presented in Figure 1-15(b). Some interesting observations can be made:
- the intensity of the N2-HIR emission continuously decreases with the injection of O2
indicating a decreasing N2(A) density between two successive discharges which can be
explained by the increase of the quenching rate of N2(A) by oxidizing species. The behavior of
the current jump and discharge power (described below) is quite different suggesting that the secondary electron emission induced by N2(A) cannot be the only mechanism
responsible for the memory effect.
- Up to 50 ppm of O2, both the emission intensities of O(1S)-N2 and NO increases indicating an
increase of the O(3P) and NO densities since the N
2(A) density decreases. The surface power
and current jump also increase suggesting an enhanced memory effect. - For higher oxygen concentrations, the emission intensities of O(1S)-N
2 and NO decrease for
increasing oxygen concentrations. It can be explained by the decrease of the N2(A) density
and/or by a decrease of the O(3P) or NO density respectively. Note that the current jump and
the surface power also decrease.
These measurements show that the emissions of O(1S)-N
2 and N2-HIR are strongly correlated to the
evolution of the current jump and discharge power. Moreover, this behavior is observed in N2/O2 and
in N2/NO mixtures. It suggests that O(3P) atoms and N2(A) are involved in the memory effect. The
mechanism responsible for this phenomenon is likely to occur in the gas phase. A possible candidate able to explain the observed behavior is the associative ionization reaction between N(2P) metastable
atoms and O(3P) atoms [57]:
N( P2 ) + O( P3 ) → NO++ e− (R 1-1)
where N(2P) atoms are produced through excitation of N(4S) atoms by N
2(A) molecules:
N2(A) + N( S4 ) → N2(X) + N( P2 ) (R 1-2)
The addition of a small amount of oxidizing gases brings O(3P) atoms in the discharge volume, which
could promote the rate of the associative ionization reaction thus increasing the memory effect. Above a given concentration of oxidizing species, the strong quenching of N2(A) should result in a
decrease of the associative ionization reaction thus decreasing the memory effect. d) Aim of the study
The aim of the present work is to check the consistency of the previous hypothesis i.e. is the associative ionization reaction N( P2 ) + O( P3 ) → NO++ e−responsible for the increase of the
memory effect in APTD when a small amount of oxidizing gas is added to N2? To answer this question,
it is necessary to determine the density of the main species involved in this reaction.
The density of N2(A) metastable molecules was already determined by Dilecce et al. [58] in very
similar conditions (APTD in N2 with ppm of O2). They found a maximum density during the discharge
around 1013 cm-3 with a corresponding quenching rate in the range 3 10-3 – 10-4 s-1 for oxygen
23 The density of N(4S) and O(3P) can be determined using two photon laser induced fluorescence (TALIF)
measurements. Then, knowing the density of N2(A), it is possible to estimate the production rate of
N(2P) atoms due to reaction (R 1-2). To get an accurate estimation of the N(2P) atoms density, it is
also necessary to estimate its quenching rate, which in turn requires the knowledge of the density of the main responsible species such as O2, O(3P) and NO. The density of NO molecules can be obtained
from laser induced fluorescence measurements (LIF). Such measurements have been performed in the group during the Ph.D thesis of Et-touhami Es-Sebbar [59]. For this purpose, a dedicated experimental setup was developed and measurements were performed for a wide range of experimental conditions in N2 [60] and in the mixtures N2/O2 [61] and N2/N2O [61]. The measured
N(4S) density was about few 1014 cm-3 in pure nitrogen and decreases when oxidizing gas was injected
down to few 1013 cm-3. The O(3P) density was estimated to be within the range 1 − 3 × 1014cm−3. NO
densities as high as 1015cm-3 were determined by LIF, which is extremely high. In N
2/O2, the
corresponding conversion efficiency was estimated around 40% and can reach up to 90% in the mixture N2/N2O. With this NO density, the metastable N2(A) would be destructed very efficiently and
as a consequence one should not observe the N2-HIR emissions, in contradiction which is presented
on Figure 1-15. Thus, such very high concentrations are poorly probable and need to be confirmed by other measurements. Moreover, the dielectric plates used for the DBD cell were made of quartz whereas other investigations [48,56] were performed with alumina making hazardous the comparison. Indeed, it can have potential consequences since surfaces phenomena related to the memory effect can occur and since the dielectric surfaces are suspected to interact with the discharge leading to the injection of oxidizing species in the discharge volume as explained above. In this work, we present new measurements of N(4S), O(3P) and NO using the TALIF and LIF technique.
For this purpose, the experimental device was improved. The investigation of the main mechanisms responsible for the production and destruction of these species is performed using a 0D model developed in the group and briefly presented in the appendix. The measured densities are then used as input in a simple model to estimate the density of N(2P) atoms following the aforementioned
procedure. Then, on the basis of the obtained results, the current jump due to associative ionization reactions is estimated and compared to experimental measurements.
25
Chapter 2. Experimental set-up
This chapter describes in detail the experimental set-up used to measure the absolute density of N (2p34S
3/2), O (2p4 3PJ) and NO(X 2), and the method used to determine the electrical
characteristics of the Townsend discharge from electrical measurements.
First, the plasma vessel is described, including the discharge cell and the power supply. Then, we present the method used to determine the electrical characteristics of the discharge. The principle of the laser induced fluorescence diagnostic is then presented and the calibration procedure is detailed. Finally, we describe the system used for laser-induced fluorescence and we detail the measurement procedure.
I. Plasma vessel and pumping system
The plasma vessel is a vertical metallic cylinder equipped with 3 large Brewster angle observation windows dedicated to LIF/TALIF measurements, the volume of the plasma vessel is about 65L.
Figure 2-1 (a) General schema of the plasma vessel and pumping system; (b) side view
Figure 2-1 shows the general configuration of the plasma vessel and pumping system. The dielectric barrier discharge apparatus (discharge cell) is positioned at the center of the vessel. Between each experiment, the pressure in the vessel is decreased down to 10-6 mbar using a primary pump (Agilent
Technologies Rotary Vane Pumps DS602) coupled to a turbo molecular pump (Leybold TURBOVAC 361). During experiments, the gas (provided by AirLiquid) is injected into the chamber up to atmospheric pressure using mass flow controllers (Bronkhorst Hi-TEC). A continuous gas injection is necessary during operation in order to maintain a well-controlled atmosphere and the working pressure is regulated at 1025 mbar using a diaphragm pump (KNF N035.3 AN.18) connected to a microvalve (MKS 0248AC-10000SV).
I.1. Discharge cell and power supply
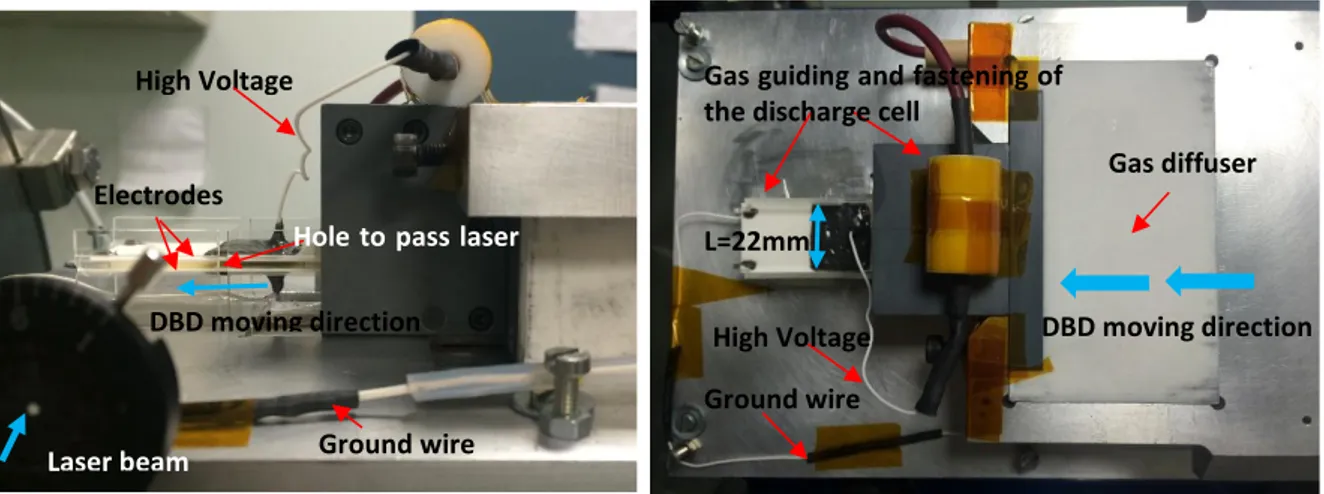
I.1.1. Discharge cellFigure 2-2shows the schema of the discharge cell used for the measurements and photographs are presented in Figure 2-3. The DBD has a plane-to-plane configuration, with a dielectric on each side. The electrodes are made of silver paint directly deposited on the dielectric plates, which consist of 635µm thick alumina plates. The wires used to connect the electrodes to the electrical circuit are pasted using silver epoxy. Finally, the whole metallic surface of the electrodes is coated by a layer of
valve diaphragm pump window detection of the fluorescence signal gas laser beam discharge cell valve
primary pump and turbo molecular pump diaphragm pump valve discharge cell laser beam window HV gas flow
26
Araldite in order to avoid arcing. The electrodes have an 18 mm × 22 mm rectangular shape for a corresponding area of S=3.96 cm2.
Figure 2-2 Schema of discharge cell and gas flow injection
In order to obtain a laminar and uniform gas flow, a diffuser is placed between the gas inlet and the discharge cell. The gas flow is then guided through the discharge by 4 lateral glass slides. Dielectric plates are inserted onto two slits present on each slide in order to ensure a constant space d=2 mm between the dielectric plates. On each side, the two slides are separated by 2 mm in order to allow the laser beam to cross the discharge.
In this work, many measurements are performed along the gas flow i.e. at different x positions from the entrance of the discharge. For this purpose, the whole discharge cell is moved while the laser beam is kept at the same position. More details on the fixation of the discharge cell during the movement could be found in Appendix 2.
Figure 2-3 Photograph of the plasma reactor presented the discharge cell
At this stage it is important to define 𝜏, the mean residence time of the gas along the discharge:
𝜏 =
𝑥𝑣 (2.1)
where 𝑥 is the position from the discharge entrance and 𝑣 is the mean gas flow velocity. This last parameter can be easily calculated using the following relation:
𝑣 = 𝑄
𝑑×𝐿 (2.2)
where 𝑄 is the gas flow rate, 𝑑 is the distance between the two dielectrics (𝑑 =2 mm) and 𝐿 is the width of the dielectrics perpendicular to the gas flow i.e. 𝑑 × 𝐿 represents the area crossed by the gas flow. d = 2mm electrodes HV gas flow 0 18 position x from the discharge
entrance (mm)
alumina plates
High Voltage
Electrodes
Hole to pass laser beam
DBD moving direction
Laser beam Ground wire
Ground wire High Voltage
Gas diffuser
DBD moving direction Gas guiding and fastening of
the discharge cell
27 I.1.2. Power supply
Figure 2-4shows the electrical circuit used in the experiment. First, a function generator is used to generate a reference sinusoidal signal. This signal is then amplified by a CREST AUDIO 4801 power amplifier. The output of the amplifier is connected in series to the primary winding of a transformer provided by the Montoux Company through a resistor Ra = 4 Ω. The secondary winding of the transformer is connected in series to the discharge electrodes through a resistor Rm=100 allowing
the determination of the measured current 𝐼𝑚.
Figure 2-4 Electrical circuit for the power supply of the discharge
I.2. Determination of the electrical characteristics of the discharge
I.2.1. Calculation of the gas gap voltage and the discharge currentTo characterize the electrical behavior of the discharge, it is necessary to know the discharge current Id, which corresponds to the conduction current i.e. to the current arising from the motion of the
charged particles (ions and electrons) in the electric field, together with the gas gap voltage Vg, which
corresponds to the voltage across the gas i.e. to the voltage seen by the charged particles in the discharge. These two parameters cannot be measured directly and have to be determined from the measurement of the applied voltage Va and the measured current Im using an electrical equivalent
circuit of the discharge [62] which is presented in Figure 2-5. The applied voltage Va is measured
using a high voltage probe (Tektronix P6015A) whereas Im is obtained from the measurement of the
voltage across Rm. Both signals are captured by an oscilloscope (LeCroy WAVESURFER 64Xs-A)
connected to a computer allowing a direct calculation of the discharge parameters in real time.
Figure 2-5 Equivalent circuit diagram of discharge cell
The electrical equivalent circuit is presented in Figure 2-5. 𝐶𝑠𝑑 represents the capacitance of the two
alumina plates and 𝐶𝑔 represents the capacitance of the gaseous gap before the breakdown. The
applied voltage 𝑉𝑎 can be separated into two components: 𝑉𝑔 and 𝑉𝑠𝑑, where 𝑉𝑔 is the voltage across
the gas gap and 𝑉𝑠𝑑 is the voltage across the dielectrics. Accordingly, the gas gap voltage 𝑉𝑔 is given
by: Reactor CH2 CH1 Rm Ra Transformer Function Generator RF Power Amplifier Id gas Csd Im Rm Vg Va Vdf Cg
![Figure 1-11 The variation of secondary emission coefficient during the whole period of the conduction current [53]](https://thumb-eu.123doks.com/thumbv2/123doknet/2113376.8052/26.892.239.658.119.442/figure-variation-secondary-emission-coefficient-period-conduction-current.webp)