HAL Id: tel-01617941
https://pastel.archives-ouvertes.fr/tel-01617941
Submitted on 17 Oct 2017HAL is a multi-disciplinary open access archive for the deposit and dissemination of sci-entific research documents, whether they are pub-lished or not. The documents may come from teaching and research institutions in France or abroad, or from public or private research centers.
L’archive ouverte pluridisciplinaire HAL, est destinée au dépôt et à la diffusion de documents scientifiques de niveau recherche, publiés ou non, émanant des établissements d’enseignement et de recherche français ou étrangers, des laboratoires publics ou privés.
adapted hydrodynamic model
Mohamad Rammal
To cite this version:
Mohamad Rammal. Comparison of different scenarios of suspended solids production in a combined sewer system using an adapted hydrodynamic model. Hydrology. Université Paris-Est, 2016. English. �NNT : 2016PESC1149�. �tel-01617941�
THESE
Présentée pour l’obtention du titre de
DOCTEUR DE l’UNIVERSITE PARIS-EST
Spécialité: Sciences et Techniques de l’Environnement
Comparison of Different Scenarios of Suspended Solids
Production in a Combined Sewer System Using an Adapted
Hydrodynamic Model
par
Mohamad RAMMAL
Thèse soutenue le 16 décembre 2016 devant le jury composé de :
M. Ghassan CHEBBO
Directeur de thèse
M. Claude JOANNIS
Co-directeur de thèse
M. José VAZQUEZ
Co-directeur de thèse
M. Gislain LIPEME-KOUYI
Rapporteur
M. Simon TAIT
Rapporteur
M. Benjamin DEWALS
Examinateur
M. Mathieu AHYERRE
Examinateur
Mohamad RAMMAL | 2016
Acknowledgements
First and foremost, I would like to express my deepest appreciation to my family: my
parents, my brother and sister, and my cousins for supporting me spiritually throughout the
whole thesis and my life in general.
I would like to express my sincere gratitude to my advisor M. Ghassan CHEBBO whose
scientific expertise, immense knowledge, and intellectual vigor added considerably to my
professional experience. He is the person that I’ll always look up to. Without his direction and
persistence, this work could not have been accomplished.
I would like to thank my advisor M. Claude JOANNIS for his continuous support during
my whole PhD study. He provided me with critical advice in every single part of my thesis and
has always suggested important improvements that contributed to raising the quality of this
work. I admire profoundly his great patience and total dedication. His selfless time and care
were sometimes all that kept me going.
I am particularly indebted to my advisor M. José VAZQUEZ for his continuous
encouragement and skillful guidance along the whole thesis. His dynamism, intelligence, and
bright personality have literally made a difference in my life in its both personal and
professional dimensions. With all the admirable qualities he has, he is the person with whom
I’ll always identify. I doubt that I will ever be able to convey my appreciation fully, but I owe
him my eternal gratitude.
Besides my advisors, I would like to thank the rest of my thesis committee: M. Simon
TAIT, M. Gislain LIPEME-KOUYI, M. Benjamin DEWALS, M. Mathieu AHYERRE, and M.
Robert MOSE, for their interest in my work and their participation in the examination of this
dissertation.
It’s a proud privilege and a matter of honor to offer my deep gratitude to M. Simon TAIT
who has always been an inspiring icon for me in my research studies. My sincere thanks go to
him for his insightful comments and interesting feedback.
Special thanks go to my fellow labmates for their overwhelming support that helped me
survive the toughest moments of my PhD years. Thank you for all the stimulating discussions
and constructive critiques that you gave me and that definitely contributed to the success of this
work. I truly enjoyed working in the friendly and lovely environment we all created in our
laboratory. High credits go to the amazing bijou (Damien TEDOLDI) who has always been a
great source of energy, passion and friendship that helped me come through the rough road of
my PhD studies. I would like to acknowledge particularly Ali HANNOCUHE who has always
been by my side from my first day in France. His help and support in everything (scientific,
Mohamad RAMMAL | 2016
logistic, friendship…) were literally invaluable. Heartfelt thanks goes to poussin Bachar
KABALAN whose brothership was the best thing that happened in the four years of my PhD
and that made them more than enjoyable. The awesome Kelsey FLANAGAN with her dynamic,
optimistic, lovely, and caring personality deserves my deepest gratitude. Also, special thanks
to poussinnette Rachid IDRIS, to Saja AL ALI and Tala KANSO, to Mohamad AL HAJ, Hani
ASAAD, Ali FADEL, Zeinab MATAR, and ELIE MAATOUK, and for all the other friends in
the laboratory for their support.
Mohamad RAMMAL | 2016
Abstract
Despite their disappointing performance, urban stormwater quality models are still considered to be a potentially efficient decision making tool to control combined sewer overflows (CSOs) and thus are receiving ongoing investments to improve their quality. In this respect, in-sewer sediments are now widely recognized for their preponderant contribution to the pollution of CSOs assigning therefore a particular importance to mastering sewer processes module when refining these models. Recent studies conducted on in-sewer sediments in one of the extensively investigated urban catchments in Paris, Le Marais, highlighted new elements that could be helpful when addressing this module: (1) the existence of quasi-steady sewer grits deforming sewer characteristics and thus suspected to modify sewer flow conditions; (2) the identification of the potentially eroded sediment type during wet weather that is formed at the upstream parts of the Marais main trunks, the organic layer, that showed a cohesive like characteristic during in-situ flushing experiments. A site specific model for the Marais catchment is developed in this thesis adopting a semi-distributed configuration to examine the effect of integrating these field observations in its structure on the simulation of outfall discharges’ quality.
In the first part, an evaluation of the impact of considering the sewer grits in the hydrodynamic module on the solid production and transfer processes in sewer system was carried out. To do so, a special modelling tool was necessary in order to handle sewer flow over a complex bathymetry. So, a well-balanced Godunov numerical scheme was developed and verified against some reference test cases before being extended to the Marais sewer scale. Results showed a significant impact of these coarse deposits on the hydraulic parameters. Solid production was demonstrated to be more sensible to this impact than the transfer processes.
In the second place, previous findings obtained on combined sewer systems having no organic layer and high sewer contribution along with those obtained on the Marais were deeply investigated to identify the real role of this organic layer in sewer wet weather production. Results showed that this latter is only a minor source for wet weather erosion. To identify the major source, a quality module based on Skipworth erosion formulation and simple advection equation was used to test several scenarios of sewer sediment localization. The benchmark confirmed that the organic layer is not the major source of sewer production and that another source is preponderant and that can be located at the upstream branches as well as along the principal collectors with more probability of the former case.
Mohamad RAMMAL | 2016
Résumé
Malgré leurs mauvaises performances, les modèles de calcul de flux polluants (MCFP) dans les rejets urbains de temps de pluie (RUTP) continuent à susciter de l’intérêt du fait du fort potentiel qu’ils présentent pour prédire et contrôler ces RUTP. La contribution des sédiments à la pollution des RUTP est aujourd’hui largement reconnue comme prépondérante ; en conséquence, une modélisation idoine des processus en réseau apparait comme un élément clé pour améliorer la qualité de ces modèles. Dans ce contexte, plusieurs éléments ont été révélés par des études récentes menées sur les dépôts de réseaux d’assainissement unitaires, notamment sur « Le Marais » : (1) la présence d’une quantité importante de dépôts grossiers quasi-stationnaires qui modifient les caractéristiques du réseau ainsi que les conditions d'écoulement ; (2) l'identification d’un dépôt organique cohésif sur le Marais, la couche organique, capable d’expliquer la contribution du réseau à la pollution de RUTP et qui se constitue dans les parties amonts des collecteurs principaux. L’objectif de cette thèse est d’examiner l’effet de l’intégration de ces observations dans un MCFP de type semi-distribué, en prenant comme cas d’étude le site expérimental du Marais.
Dans la première partie, on a travaillé à la prise en compte des dépôts grossiers dans le modèle hydrodynamique, puis on a évalué l’impact de cet ajout sur les processus de transport solide dans les réseaux. Pour y parvenir, un outil de modélisation capable de gérer l’écoulement sur une bathymétrie complexe était nécessaire. Ainsi, un schéma numérique conservatif de type Godounov a été développé et validé par rapport à certains cas de référence, avant de l’appliquer à l'échelle du réseau du Marais. Les résultats ont démontré un effet significatif de ces dépôts grossiers sur l’hydraulique du réseau, qui ensuite influence la production des particules et, dans une moindre mesure, le processus de transfert.
Dans la deuxième partie, des données acquises récemment sur plusieurs sites avec des contributions de dépôts aux RUTP comparables et d’états d’encrassement différents (notamment pour la couche organique) ont été analysées dans le but d’identifier le vrai rôle de cette couche organique vis-à-vis de la production en réseau par temps de pluie. Les résultats ont montré que la couche organique ne représente qu’une source mineure vis-à-vis de la production en réseau. Afin d’identifier la source majeure, le modèle hydraulique développé dans la première partie a été couplé avec le modèle d’érosion de Skipworth et le modèle d’advection simple pour tester différents scenarii de localisation de dépôts. Les résultats de ce banc d’essai sont cohérents avec ce qui précède concernant la contribution de la couche organique ; il en ressort par ailleurs que les localisations les plus vraisemblables de la source prépondérante sont, dans l’ordre, le réseau amont et les collecteurs principaux.
Mohamad RAMMAL | 2016
Table of Contents
Acknowledgements ... 3 Abstract ... 5 Résumé ... 6 Table of Contents ... 7 List of Tables ... 10 List of Figures ... 13 General Introduction ... 17 General context ... 17 Thesis framework ... 18 Thesis structure ... 19Part I State of the art & dataset presentation ... 21
Chapter 1 State of the art ... 23
1. Pollution of Urban Wet Weather Discharges (UWWD) ... 23
2. Origin of pollution in Urban Wet Weather Discharges ... 26
3. Sewer deposits ... 30
3.1. Composition and Characteristics ... 30
3.1.1. Sewer grits ... 30
3.1.2. Biofilms ... 31
3.1.3. Organic near bed sediment ... 32
3.1.3.1. Type C deposit ... 32
3.1.3.2. Near Bed Solids... 33
3.1.3.3. Organic layer ... 33
3.1.3.4. Fluid sediment ... 35
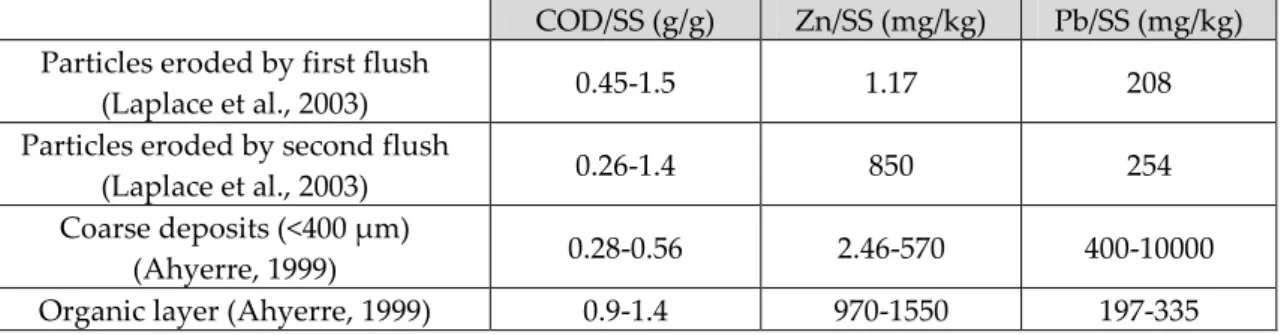
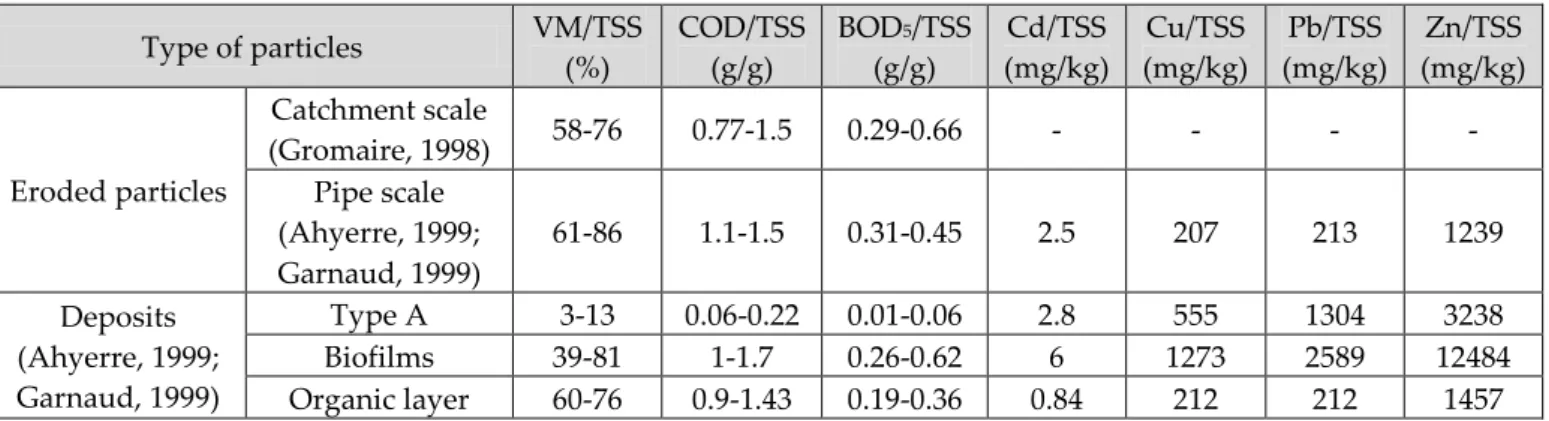
3.1.4. Comparison of pollutants’ load in eroded particles with those of different sewer sediments .. 37
3.2. Dynamics of sewer sediments ... 40
3.2.1. Accumulation of sewer grits ... 40
3.2.2. Erosion of organic near bed materials ... 41
3.2.2.1. Investigations in real sewer flow conditions (dry/wet) ... 41
3.2.2.2. Investigations in controlled flushing experiments ... 43
4. Modelling sewer processes ... 46
4.1. Modelling in-sewer sediment erosion ... 46
4.2. Modelling suspended solid transfer in sewer system ... 50
Mohamad RAMMAL | 2016
5.1. Simple hydraulic models ... 52
5.2. Complex hydraulic models ... 53
5.3. Numerical schemes of Shallow Water Equations ... 54
5.3.1. Flux term discretization ... 55
5.3.2. Source term discretization ... 56
6. References ... 60
Chapter 2 Presentation of experimental and modelling investigations of the Marais site ... 73
1. Choice of the study site ... 73
2. Site description ... 74
2.1. Surface description ... 74
2.2. Sewer system description ... 74
3. Database presentation ... 76
3.1. Precipitation data and rainfall events characteristics ... 77
3.2. Dry weather flow data ... 77
3.2.1. Discharge flow rate... 77
3.2.2. TSS concentration ... 79
3.3. Wet weather flow data ... 80
3.3.1. Runoff flow ... 81
3.3.2. Sewer outflow ... 83
3.4. In-sewer deposits characteristics ... 85
3.4.1. Type of deposits ... 85
3.4.2. Localization and topography of sewer deposits ... 85
3.4.3. Pollutants’ content ... 87
3.4.3.1. Experimental results of the dynamics of the organic layer ... 88
3.4.3.1.1. Controlled flushing experiments ... 88
3.4.3.1.2. Observational system ... 90
3.4.3.2. Results of modelling the dynamics of the organic layer ... 90
4. References ... 94
Part II The interest of a distributed hydrodynamic model specifically adapted to collectors of highly varying bed slope and cross-sections ... 97
Chapter 3 A Simple Finite Volume Method for 1D Naturally Balanced Shallow Water Equations ... 101
1. Abstract ... 101
Chapter 4 Sensitivity of Hydrodynamic Models and Solid Transport to the Description of Silted Collectors... 103
1. Abstract ... 103
Part III In-sewer suspended solids sources and solid transport modelling .. 105
Chapter 5 Do storm events samples bias the comparison between sewers deposits contribution? ... 109
Mohamad RAMMAL | 2016
1. Abstract ... 109
Chapter 6 Development and Benchmarking of Solid Transport Models with Different Scenarios for In-sewer Sources of Suspended Solids ... 111
1. Introduction ... 111
2. Conclusion ... 113
General Conclusion and Perspectives ... 117
Recalling the objectives ... 117
Hydrodynamic modelling ... 117
Data analysis ... 118
Solid transport model and production scenarios ... 118
Mohamad RAMMAL | 2016
List of Tables
Table 1-1: Percentage of pollution carried by particles of urban discharges as an average on rainfall
event
Table 1-2: Order of magnitude of Event Mean Concentration of TSS in combined flow at sewer outfall Table 1-3: Contribution of three sources (wastewater, surface runoff, sewer deposit) to TSS load at
sewer outfalls
Table 1-4: Characteristics of sewer grits on different combined sewer systems Table 1-5: Characteristics of biofilms on different combined sewer systems Table 1-6: Different denominations of the fluid sediment organic solids Table 1-7: Pollutants’ content in Type C deposits on different sewer systems
Table 1-8: Pollutants’ content (volatile matter) in the Near Bed Solids of Dundee sewer system Table 1-9: Pollutants’ content in organic layer on the Marais catchment
Table 1-10: Pollutants’ content in organic layer on the Marais and the particles eroded by the flushing
experiments in Marseille trunk of Rue Tobelem
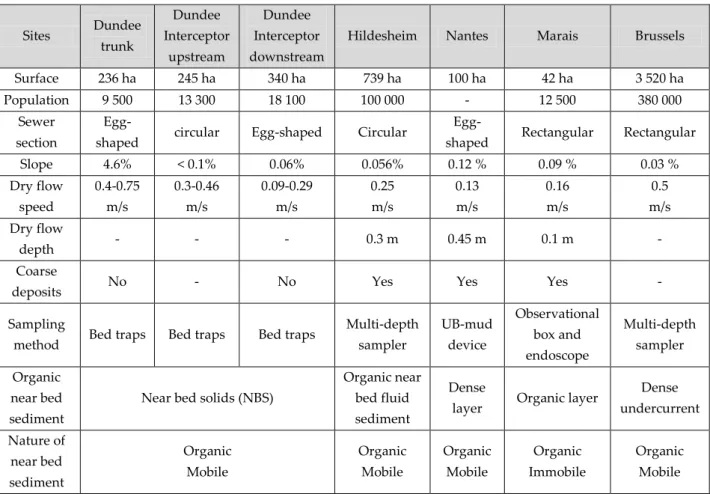
Table 1-11: Pollutants’ load of eroded solids and of different types of deposits in combined sewer systems Table 1-12: Characteristics of different sites and sampling methods used to investigate the organic near
bed sediments
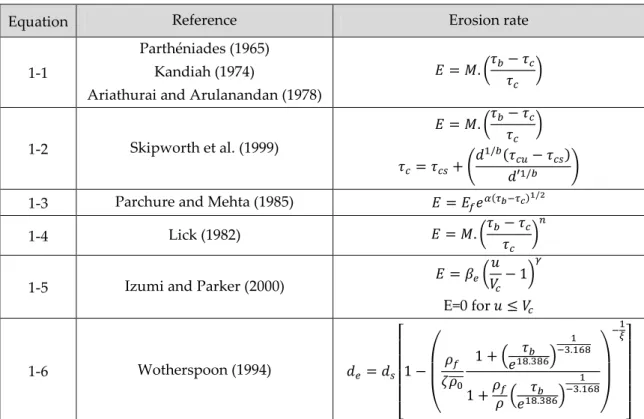
Table 1-13: Sewer sediment production model in urban drainage models Table 1-14: Erosion rate formulas of cohesive sediments
Table 1-15: Coefficients of the hydrologic models
Table 1-16: Applications of simplified Saint-Venant equations after Butler and Davies (2004) Table 1-17: Channel routing methods used in some urban quality modelling approaches Table 2-1: Interesting and distinctive features in the Marais site for modelling objectives Table 2-2: Geometrical characteristics of Marais sewer system
Table 2-3: Recapitulative of all measurements made on the Marais site
Table 2-4: Statistical characteristics of event mean TSS concentration and flux on the three sampled
surface types of the Marais site
Table 2-5: Statistical characteristics of event mean TSS concentration and transport rate of wet weather
outflow of the Marais site
Table 2-6: Characteristics of the 67 rainfall events Table 2-7: Characteristics of the 40 rainfall events
Table 2-8: Pollutants’ content of the three types of sewer deposits identified on the Marais sewer
presented as d10 – d90 (d50)
Table 2-9: Optimal combination of Skipworth parameters determined on 2hydraulic flush experiments
using 2 calibration methods
Table 3-1: Initial & Boundary conditions for the 4 test cases in a trapezoidal channel with a hump Table 3-2: Given parameters for the test case of a steady flow over a hump in a non-rectangular channel
Mohamad RAMMAL | 2016
Table 3-3: Given parameters for the test case of a steady flow over a hump in a non-rectangular channel. Table 3-4: Given parameters for dike-break problem in a rectangular cross-section channel
Table 3-5: Given parameters for dike-break problem in a triangular, parabolic and trapezoidal
cross-section channel
Table 4-1: Characteristics of four simulated rainfall events
Table 4-2: Critical bed shear stress values of cohesive sediments erosion
Table 4-3: Statistical description of the spatial distribution of the difference of sediment production
between tested configurations
Table 4-4: Difference in total sediment production between tested configurations Table 4-5: Difference in total sediment production between tested configurations Table 4-6: Difference in total sediment production between tested configurations
Table 4-7: Difference in total sediment production outfall transfer time between tested configurations Table 4-8: Statistical description of the spatial distribution of the difference of sediment production
between tested approaches
Table 4-9: Difference in total sediment production outfall transfer time between tested configurations Table 4-10: Statistical description of the spatial distribution of the difference of sediment production
between tested configurations
Table 4-11: Difference in total sediment production outfall transfer time between tested configurations Table 4-12: Statistical description of the spatial distribution of the difference of sediment production
between tested numerical scheme
Table 5-1: Surface and sewer characteristics of the studied catchments Table 5-2: Characteristics of the rainfall events on the three studied sites
Table 5-3: Order of magnitude of the min, mean and max of the event mean concentration on the three
studied sites
Table 5-4: Results of the p-values obtained by Mann-Whitney statistical test on the comparison of
rainfall events’ characteristics distribution
Table 5-5: Characteristics of the selected rainfall events on the three sites
Table 6-1: EMC of surface runoff on different surface types and their corresponding theoretical runoff
coefficient
Table 6-2: Statistical description of the bed slope in main trunks and upstream branches of the Marais
sewer system
Table 6-3: Model equations in quantity and quality modules Table 6-4: Description of model parameters
Table 6-5: Rainfall events characteristics for the calibration and validation period Table 6-6: Optimal parameters in scenarios 1𝑝𝑖𝑝𝑒 and 1𝑠𝑒𝑤𝑒𝑟
Table 6-7: Optimal parameters and variation coefficients for scenarios 1𝑠𝑒𝑤𝑒𝑟, 1𝜏𝑠𝑒𝑤𝑒𝑟and 1𝜑𝑠𝑒𝑤𝑒𝑟 Table 6-8: Performance criteria of the calibration results of the scenarios 1𝑝𝑖𝑝𝑒 and 1𝑠𝑒𝑤𝑒𝑟
Table 6-9: Performance criteria of the calibration results of the scenarios 1𝜏𝑠𝑒𝑤𝑒𝑟 and 1𝜑𝑠𝑒𝑤𝑒𝑟 Table 6-10: Performance criteria of the validation results of the scenarios 1𝑝𝑖𝑝𝑒 and 1𝑠𝑒𝑤𝑒𝑟 Table 6-11: Performance criteria of the validation results of the scenarios 1𝜏𝑠𝑒𝑤𝑒𝑟 and 1𝜑𝑠𝑒𝑤𝑒𝑟
Mohamad RAMMAL | 2016 Table 6-12: Performance criteria of the calibration results of the scenarios 2𝑑𝑛 and 2𝑢𝑝 Table 6-13: Performance criteria of the validation results of the scenarios 1𝑠𝑒𝑤𝑒𝑟, 2𝑑𝑛 and 2𝑢𝑝 Table 6-14: Performance criteria of the calibration results of scenarios 3𝑎𝑙𝑙 and 3𝑢𝑝
Mohamad RAMMAL | 2016
List of Figures
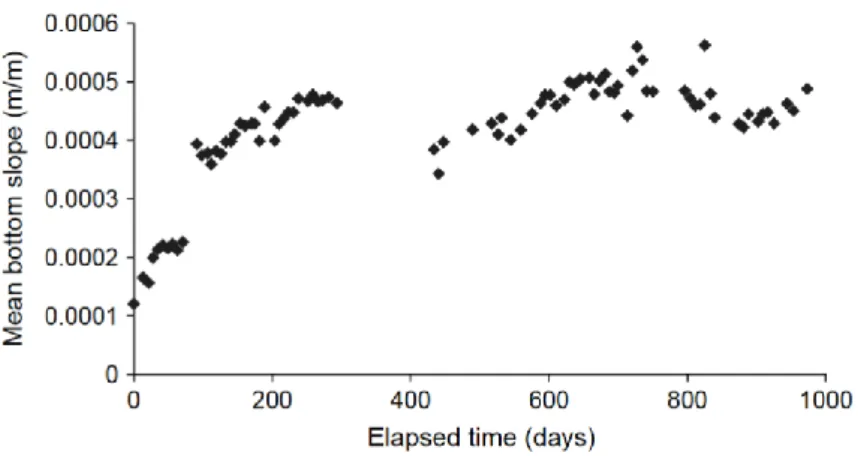
Figure 1-1: Asymptotic variation of the mean bottom slope in Lacassange sewer (Bertrand Krajewski et al., 2006)
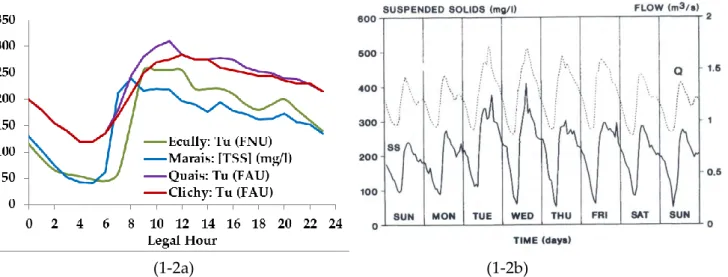
Figure 1-2: Daily cycle of wastewater TSS concentration at sewer outfalls during dry weather on:
(1-2a) Ecully, Marais, Quais, and Clichy, (1-2b) Brussels main trunk
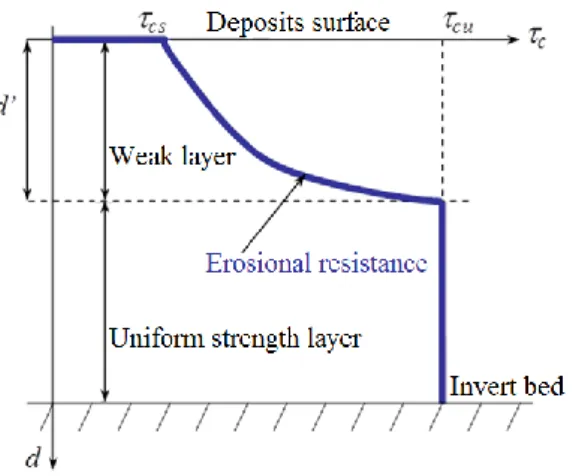
Figure 1-3: Variation of the erosional resistance of in-sewer sediments as described by (Skipworth et al.,
1999)
Figure 1-4: Illustration of the flow variables perceived by a non-well balanced scheme
Figure 2-1: (Left) Surface distribution of the Marais site between roads, roofs, and courtyards; (Right)
Principal and secondary channels in the Marais sewer system
Figure 2-2: Typical sections of the main channels: (Left) SG, (Middle) VdT, (Right) Riv Figure 2-3: Typical section of secondary channels EL (upstream sewer)
Figure 2-4: Comparison of average flow rate of dry weather flow at Marais sewer outfall between
weekdays and weekends measured during 4 campaigns
Figure 2-5: Daily cycle of dry weather flow at Marais sewer outfall measured during 4 campaigns Figure 2-6: Comparison of average TSS concentration of dry weather flow at Marais sewer outfall
between weekdays and weekends measured during 4 campaigns
Figure 2-7: Daily cycle of dry weather TSS concentration at Marais sewer outfall measured during 4
campaigns
Figure 2-8: Periods of runoff flow measurements on the rooftops, courtyards, and roads on the Marias
site
Figure 2-9: Coarse granular deposits observed on the upstream sewer of the Marais site
Figure 2-10: Bed invert level and coarse granular deposits profile on the three main channels of Marais
catchment
Figure 2-11: Biofilm observed in the main channels of the Marais catchment
Figure 2-12: Organic layer cartographies obtained by Ahyerre (1999) (concentration near bed > 500
mg/l), and by Oms (2003) (using the endoscope)
Figure 2-13: Variations of TSS transport rate (g/s), flow rate (m3/h), and shear stress (N/m2) (measured
by ADV) at the downstream of the experimental segment studied in Vieille du Temple channel in 02/12/1998 and 05/11/1998
Figure 2-14: Measured and modelled suspended solid concentration versus time with 5-95% prediction
interval obtained by MCMC calibration for the experiment of 02/12/1998 (Kanso et al., 2005)
Figure 2-15: Measured and modelled suspended solid transport rate versus time for the deposits’
parameters optimized using genetic algorithm to minimize the mean absolute error for the experiment of 02/12/1998 (Tait et al., 2003)
Figure 3-1: Cross-sectional area of a flow channel
Mohamad RAMMAL | 2016 Figure 3-3: Schematic Approximation of the solution of the Riemann problem using HLL solver Figure 3-4: Numerical vs. reference solutions for the test case of a trans-critical flow with shock of: (left)
Water depth (m), (right) Flow rate (m3/s)
Figure 3-5: Numerical vs. reference solutions for the test case of a trans-critical flow without shock of:
(left) Water depth (m), (right) Flow rate (m3/s)
Figure 3-6: Numerical vs. analytical solutions for the test case of a flow in a non-prismatic trapezoidal
channel: (left) Water depth for the transcritical flow case (m), (right) Water depth for the subcritical flow case (m)
Figure 3-7: Numerical vs. analytical solutions of (left) water depth and (right) discharge, for a 1D dike
break problem over a sloped bottom using rectangular cross-section in a subcritical flow regime at t = 0.11 s
Figure 3-8: Numerical vs. analytical solutions of (left) water depth and (right) discharge, for a 1D dike
break problem over a sloped bottom using rectangular cross-section in a trans-critical flow regime at t = 0.11 s
Figure 3-9: Numerical vs. reference solutions for the dike-break problem in a horizontal frictionless
channel with trapezoidal cross-section: (left) Water depth (m), (right) Flow discharge (m3/s)
Figure 3-10: Numerical vs. reference solutions for the dike-break problem in a horizontal frictionless
channel with triangular cross-section: (left) Water depth (m), (right) Flow discharge (m3/s)
Figure 3-11: Numerical vs. reference solutions for the dike-break problem in a horizontal frictionless
channel with parabolic cross-section: (left) Water depth (m), (right) Flow discharge (m3/s)
Figure 4-1: Principal and secondary channels in the Marais sewer system
Figure 4-2: Bed invert level and coarse granular deposits profile on the three main channels of Marais
catchment
Figure 4-3: Channel bed slope distribution and boxplot with and without coarse deposits
Figure 4-4: Spatial discretization of the modelled catchment into subcatchments and main channels Figure 4-5: Diagram of the different elements of the applied model
Figure 4-6: Cartographies of the three main channels for the four studied rainfall events of the relative
difference in eroded mass of sediments between deposits and deposits free configurations
Figure 4-7: ∆𝐸𝑇 and ∆𝐸𝑈𝑝 function of 𝜏𝑐 for the 4 simulated rainfall events
Figure 4-8: Cartographies of the three main channels for the four studied rainfall events of the ∆𝑇𝑖
between deposits and deposits free configurations
Figure 4-9: Bed invert level and high and low coarse deposits profile configuration on the three main
channels of the Marais catchment
Figure 4-10: Cartographies of the three main channels for the four studied rainfall events of the relative
difference in eroded mass of sediments between two tested frameworks
Figure 4-11: Cartographies of the three main channels for the four studied rainfall events of the
difference in transfer time of advection between two modelling frameworks
Figure 4-12: Cartographies of the three main channels for the four studied rainfall events of the relative
Mohamad RAMMAL | 2016
Figure 4-13: Cartographies of the three main channels for the four studied rainfall events of the
difference in transfer time of advection between two deposits configurations
Figure 4-14: Cartographies of the three main channels for the four studied rainfall events of the relative
difference in eroded mass of sediments in deposits configuration between two numerical
Figure 4-15: Cartographies of the three main channels for the four studied rainfall events of the
difference in transfer time of advection in deposits configuration between two numerical schemes
Figure 5-1: (5-1a) Statistical distribution of the percentage event SDC for the three studied sites, (5-1b)
Mean SDC αN on the three sites
Figure 5-2: (5-2a) Statistical distribution of the percentage event SDC for the three studied sites on the
new selected rainfall events, (5-2b) Mean SDC αN for the new set of rainfall events on the three sites
Figure 5-3: Comparison of SDC and characteristics of selected rainfall events on Marais and Ecully Figure 5-4: Comparison of SDC and characteristics of selected rainfall events on Marais and Clichy Figure 5-5: Comparison between the mean SDC αN obtained on each site for the same number of events,
with 10th and 90th n distributions
Figure 6-1: Schematic representation of the applied model structure: How compartments C1 (surface +
secondary sewer) and C2 (main collectors) are modelled in each module: quantity (top-blue), quality (bottom-red)
Figure 6-2: Sediment eroded mass as a function of rainfall events characteristics
Figure 6-3: Posterior probability distribution of the model parameters obtained in the scenario 1𝑠𝑒𝑤𝑒𝑟 Figure 6-4: Comparison between the performance criteria calculated on each event of the calibration
period for the scenarios 1𝑝𝑖𝑝𝑒 and 1𝑠𝑒𝑤𝑒𝑟
Figure 6-5: Comparison between the performance criteria calculated on event scale of validation period
for the scenarios 1𝑝𝑖𝑝𝑒 and 1𝑠𝑒𝑤𝑒𝑟
Figure 6-6: Posterior probability distribution of the model parameters obtained in the scenarios
2𝑑𝑛 and 2𝑢𝑝
Figure 6-7: Comparison between scenario 1𝑠𝑒𝑤𝑒𝑟 (magenta), 2𝑑𝑛 (red), and 2𝑢𝑝 (blue) of the spatiotemporal
distribution of flow shear stress occurring on sewer parts with erodible layer
Figure 6-8: Comparison between the performance criteria calculated on event scale of calibration period
for the scenarios 2𝑑𝑛 and 2𝑢𝑝
Figure 6-9: Comparison between the performance criteria calculated on event scale of validation period
for the scenarios 1𝑠𝑒𝑤𝑒𝑟, 2𝑑𝑛 and 2𝑢𝑝
Figure 6-10: Posterior probability distribution of the model parameters obtained in the third scenario Figure 6-11: Comparison between the performance criteria calculated on event scale of calibration period
for the third scenario
Figure 6-12: Comparison between the performance criteria calculated on event scale of validation period
for the scenarios 1𝑝𝑖𝑝𝑒and 3
Figure 6-13: Comparison between the performance criteria calculated on event scale of validation period
for the scenarios 1𝑠𝑒𝑤𝑒𝑟, 2𝑑𝑛,2𝑢𝑝, and 3
Figure 6-14: Comparison between the performance criteria calculated on event scale of validation period
Mohamad RAMMAL | 2016
Figure 6-15: Comparison between the performance criteria calculated on event scale of validation period
for the scenarios 3 and 𝑆𝑀𝐶𝑎𝑙𝑙
Figure 6-16: Contribution of flow rate and TSS concentration to the normalized variance of TSS
Mohamad RAMMAL | 2016
General Introduction
General context
Combined sewer networks are water drainage systems designed to convey towards treatment plants foul wastewater during dry weather and a mixture of foul wastewater and stormwater during wet weather. When input volumes into these plants surpass their capacity, usually limited to 2.5-3 times the maximum dry weather flow rate, excess amounts are directly discharged into the watercourses without any treatment through Combined Sewer Overflow (CSO) devices. During the last few decades the high rate of urbanization increased the wastewater and stormwater volumes and consequently the risk of treatment plants saturation during wet weather conditions and thus the frequency of CSOs. The pollution of these discharges has become widely acknowledged among researchers, urban sewer managers, and governments that established legal framework to control the quality of these point discharges. So, several management policies were enacted around the world: European directive 2000/60/CE, LEMA in France (Loi sur l’Eau et les Milieux Aquatiques) 2006… that require the consideration of these risks in all strategies of water management. It became urgent in order to respond to these challenges to acquire more knowledge about the quantities, sources, impacts and mechanism of the CSOs. This was the origin of a number of research programs that were conducted worldwide to provide all necessary elements to estimate and control this pollution: NURP (1978-1983), French campaigns (1980-1982), QASTOR (Saget, 1994), OPUR (1994-), OTHU (1999-), ONEVU (2006-)…
These studies shed light on the importance of the pollution of CSOs with the majority of contaminants found to be transported by the suspended solid vector. Investigations on the origin of these particles demonstrated the major role of sewer deposits and thus the importance of mastering in-sewer processes in order to reduce the release of pollutants from sewer system. This has driven researchers to scrutinize all aspects concerning sewer deposits to construct a considerable body of detailed data on their characteristics, their contribution to CSOs, the mechanism of their sedimentation and erosion all being employed to propose practical measures to manage this source. This objective has often been linked to the development of sewer sediment transport model intended to be applied on a wide scale to efficiently and economically achieve this goal.
Numerous mathematical tools were therefore developed by researchers since the 1970 to calculate the pollutographs during storm events at combined sewer outfalls. These models are composed of two joint modules: hydrological-hydraulic module and sediment and quality module. The first approaches adopted were almost purely conceptual. Then, with the advance
Mohamad RAMMAL | 2016
in scientific knowledge about mechanisms governing sediment production and transport as well as increasing computing capacities, enabling solving complex hydrodynamic equation and modellers tended to include them in the model formulation. However, since the rate of quality module improvement wasn’t in pace with the quantity one, most researchers’ efforts were focused on the former module. The description of quality processes in these models is however still not far from those adopted in the pioneer approaches due to several reasons: (1) complexity of processes governing water quality processes, (2) difficulty of carrying extensive measurements to determine all necessary information on sediment characteristics, (3) the huge spatial and temporal variability of all aspects of phenomenon of sewer processes. So, latest investments in this field were made in the calibration procedures used to optimize these models. Advanced calibration techniques were thus implemented to analyse the performance of these conceptual models, assess their sensitivity to their parameters, evaluate the uncertainty associated to their parameters’ estimations, and evaluate their predictive capacity. Although these techniques showed to be robust and efficient in optimizing the model parameters and improving their mathematical structure, the modelling results were still unsatisfactory (Kanso, 2004; Métadier, 2010).
Thesis framework
As said before, most attempts of improving these models have concentrated on refining and calibrating the quality module considering that the hydraulic one is satisfactory. However, this hydraulic model was designed and evaluated based on the good agreement between measured and simulated hydrographs at sewer outfall. This approach does not guarantee a good representation along the whole sewer network of the hydraulic parameters that are determinant for solid transport processes (flow depth, flow velocity, shear stress). Moreover, the presence of coarse deposits substantially modifies the profile and cross section of the sewer collectors and thus impacts the hydraulic parameters quoted here above. This effect is seldom accounted for in the available models since this requires robust numerical schemes capable of handling the variability of collectors’ characteristics which demand high computational time. Parallel to these modelling efforts, field studies were continuing to exploit new techniques of data acquisition and constructing a rich detailed database not only on the outfall discharges but also on sewer deposits characteristics and mechanism that opens new perspectives in the modelling arena. Results obtained confirm the importance of the erosion of deposits during wet weather in the combined sewer systems, but diverge concerning the nature and location of this source. For instance, the role of the organic layer observed on the Marais catchment is still ambiguous.
Mohamad RAMMAL | 2016
1. Evaluate the interest of a distributed hydrodynamic model specifically adapted to collectors of highly varying slope and sections and assess the spatial resolution of data required to efficiently operate this model
2. Exploit the database acquired in the two observatories OPUR and OTHU in order to obtain a coherent vision concerning the contribution of different possible sources of suspended solids to wet weather pollution discharges in combined sewers
3. Develop a solid transport model relying on a suitable hydrodynamic model and apply it on a well-documented catchment in order to assess whether available knowledge is sufficient for predicting wet weather pollutographs, with some assumptions to fill the gaps.
Thesis structure
The thesis dissertation is structured in three parts:
The first part presents a state of the art about the knowledge and models of the source and processes implied in wet weather pollution in combined sewers. A focus is made on the Marais catchment for which many investigations and data acquisition were performed.
In the second part a new numerical method is developed for solving the shallow water equation for a better handling of highly varying collector geometric characteristics, especially those induced by high coarse sediment levels. This hydraulic model is then coupled with an adapted solid transport module in order to evaluate its interest for our specific application.
In the third part the data available in several catchments in SOERE URBIS database were thoroughly analysed to consolidate assumptions on SS sources. Then a water quality model is built on the basis of the improved hydraulic representation made in Part I and of Skipworth solid production model, and different scenarios of in-sewer suspended solid sources are tested.
Mohamad RAMMAL | 2016
Mohamad RAMMAL | 2016
dataset presentation
Part I
State of the art
&
Mohamad RAMMAL | 2016
Chapter 1
State of the art
1. Pollution of Urban Wet Weather Discharges (UWWD)
Urban drainage problems have been long restricted to public health and flood protection (Chocat et al., 2007). Only in recent times with the growing rate of urbanization, a scientific awareness has arisen on the substantial stress these urban drainage systems have on their surrounding environment (Freni et al., 2008). The huge expansion of urban development entailing more imperviousness (Paul and Meyer, 2001) led to a faster process of stormwater drainage with a significant increase in the discharged volume and peak flow (Schueler, 1994; Booth and Jackson, 1997; DeFries and Eshleman, 2004). A large part of runoff water is conveyed to underground sewer systems where, in the case of combined sewer systems, it is mixed with the wastewater generated by domestic, commercial, and industrial sectors. During severe storm episodes, the drainage capacity of sewer infrastructures is not sufficient to convey the combined sewer flow to downstream treatment plants and thus excess water is released through overflow facilities directly into the receiving water bodies without or with partial treatment. These discharges called combined sewer overflows (CSOs) (Butler and Davies, 2004) were studied by numerous research projects realized in different countries in which extensive experimental campaigns were conducted to observe, identify and evaluate the pollutants loads, characteristics and impact on receiving water bodies: QASTOR (Saget, 1994), Generation and transport of the pollution of UWWD in combined sewer system (Chebbo et al., 2006), OTHU (1994-), OPUR (2001-). Results of these studies highlighted the following points:
Pollution loads: high levels of contaminants mass and concentration: organic, microbiological, organic and mineral micropollutants, nutrients (particularly phosphorus), and pathogenic microorganisms (Seager and Abrahams, 1990; Chambers et al., 1997; Suarez and Puertas, 2005; Gasperi et al., 2008; Phillips and Chalmers, 2009; Weyrauch et al., 2010; Zgheib et al., 2011; Phillips et al., 2012; Madoux-Humery et al., 2013).
Pollutant characteristics: a dominant particulate nature for the majority of the analysed pollutants (Chebbo and Bachoc, 1992; Aalderink et al., 1990). The Total Suspended Solids (TSS) was then considered to be the major vector of most of the contaminants released in the receiving water bodies. Table 1-1 gives the particulate proportion of several types of contaminants measured in wet weather effluents in the sewer of several urban catchments. As an average, more than 80% of organic materials and between 40% and 99% of metals are transported in particulate form. For other sites, the reader is referred to (Kafi-Benyahia, 2006).
Mohamad RAMMAL | 2016
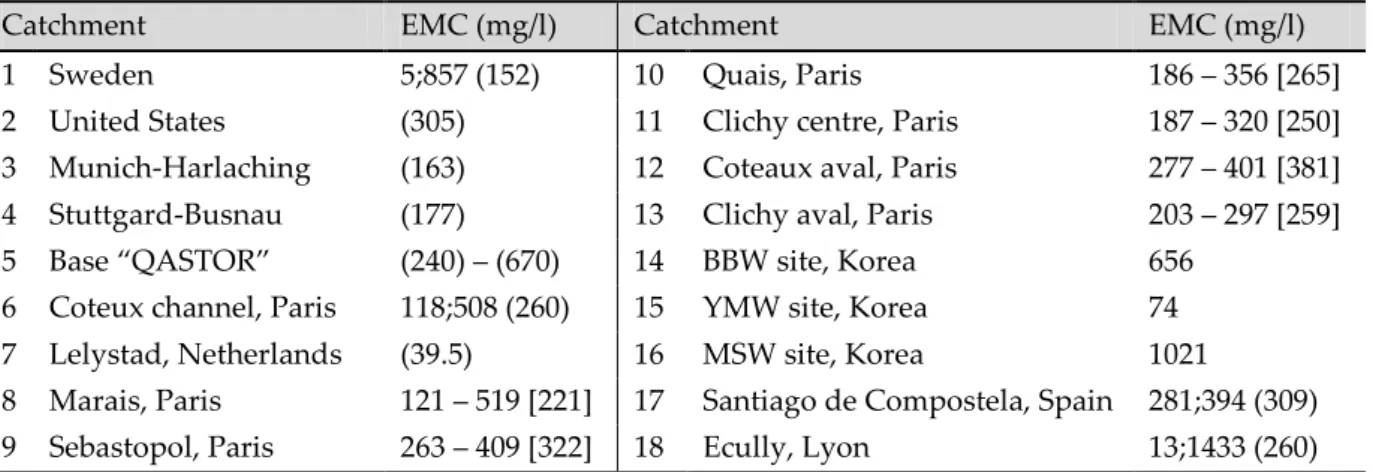
Table 1-2 provides an order of magnitude of the Event Mean Concentration (EMC) of TSS observed in sampling campaigns conducted in some countries. Values obtained show high contamination levels of suspended solids with remarkable variability between sites and between rainfall events on the same site.
Table 1-1: Percentage of pollution carried by particles of urban discharges as an average on rainfall
event
Catchment EMC (mg/l) Catchment EMC (mg/l)
1 Sweden 5;857 (152) 10 Quais, Paris 186 – 356 [265]
2 United States (305) 11 Clichy centre, Paris 187 – 320 [250]
3 Munich-Harlaching (163) 12 Coteaux aval, Paris 277 – 401 [381]
4 Stuttgard-Busnau (177) 13 Clichy aval, Paris 203 – 297 [259]
5 Base “QASTOR” (240) – (670) 14 BBW site, Korea 656
6 Coteux channel, Paris 118;508 (260) 15 YMW site, Korea 74
7 Lelystad, Netherlands (39.5) 16 MSW site, Korea 1021
8 Marais, Paris 121 – 519 [221] 17 Santiago de Compostela, Spain 281;394 (309) 9 Sebastopol, Paris 263 – 409 [322] 18 Ecully, Lyon 13;1433 (260)
1,2 (Hoghland et al., 1984); 3,4 (Geiger, 1986); 5 (Saget and Chebbo, 1996); 6 (Philippe and Ranchet, 1987); 7 (Aalderink et al., 1990); 8 (Gromaire, 1998); 9,10,11,12,13 (Kafi-Benyahia, 2006); 14,15,16 (Lee and Bang, 2000); 17 (Diaz-Fierros et al., 2002); 18 (Métadier, 2011)
(x): (mean) [x]: [d50] x1 – x2: d10-d90 x1;x2: min;max
Table 1-2: Order of magnitude of EMC of TSS in combined flow at sewer outfall
Impact on receiving waters: the major role of wet weather discharges in downgrading the urban surface streams quality by modifying the ecological functioning and increasing the concentration of dangerous substances (Mulliss et al., 1997; Even et al., 2004; Blumensaat et al., 2011; Passerat et al., 2011; Gosset et al., 2016). Many types of impacts have been identified: decrease in the oxygen concentration (Harremoës, 1982; Hvitved-Jacobsen, 1982; Paul and Meyer, 2001), the toxicity effects on phytoplankton from heavy metals (Seidl et al., 1998), the impact on the microbiological water quality (Armstrong et al., 1980; Passerat et al., 2011), endocrine disruptions due to some micropollutants (Cladière et al., 2011), and the possible
% Pollution linked to
particles COD BOD5 Cd Cu Pb Zn
Marais (1) 64-94 (82) 59-95 (80) 90-100 (99) 87-99 (96) 91-99 (86) 38-99 (88)
Clichy (2) - - 49-86 (73) 83-98 (91) 66-97 (87) 65-90 (80)
Boudonville (3) - - - (95) (98.5) (97)
Collector 13 (4) 83-92 83-91 - - 82-99 -
(1) Gromaire (1998), (2) Saget (1994), (3) LHRSP and Laurensot (1998), (4) Chebbo (1992)
Mohamad RAMMAL | 2016
impacts on fish mortality of hypoxia and un-ionized ammonia (Magaud et al., 1997; Boët et al., 1994).
∴ Being highly loaded with pollutants, Combined Sewer Overflows (CSOs) are considered a serious danger on the quality of urban watercourses whose protection starts by controlling these discharges. A major part of the pollution in these CSOs was found in particulate form (TSS).
Mohamad RAMMAL | 2016
2. Origin of pollution in Urban Wet Weather Discharges
In an attempt to limit the impacts of these discharges, a legislative framework was established demanding stringent regulations of the CSOs to ensure the ecological restoration of all surface waters: Water Framework Directive EU/2000/60/EC (European Council, 2000), Directive 91/271/CE on treatment of residual urban water, Urban Pollution Management Manual (FWR, 1998), Swiss STORM method (VSA, 2007), ATV German standards (ATV, 1992), and France regulatory guidelines (CERTU, 2003)…
This has prompted research initiatives to investigate different aspects of these discharges and provide helpful elements for the development of efficient control strategies. In this respect, a key factor after the evaluation of the pollutants loads in these outflows is the identification of the different origins and their relative contribution. So, many studies (e.g. Gromaire et al., 2001) were carried out to determine and quantify the sources producing these pollutants based on field work along with some hypotheses that were sometimes questionable and other times valid. Results of these studies are summarized in table 1-3 below.
On urban catchments, we can distinguish between three sources of solid particles: 1. Particles’ load washed from different urban surfaces (roads, roofs and courtyards) 2. Particles’ load transported by the dry weather flow in the sewer system
3. Particles’ load mobilized from in-sewer sediments by wet weather flow
Krejci et al. (1987) evaluated the contribution of different sources on 4 rainfall events in a 12.5 ha catchment area of Zurich which is a fully developed and urbanized residential area having 5.3 ha covered by roofs and roads. The sewer slope varies between 0.5% and 10% with circular sewer channels of diameter varying between 30cm and 90cm. The hypotheses made were:
The mass of pollutants attributed to wastewater was evaluated by TSS flux measured in dry weather.
The mass of pollutants produced by runoff flow is estimated from the annual mean concentration of TSS measured 10 years earlier in a stormwater network.
A distinction was made between 2 types of sewer deposits: sediments and biofilms, where the mass of sediments eroded was estimated from experimental flushing during dry weather period, and those susceptible to be generated from biofilms were evaluated from the surface of biofilms observed and analysed on another site.
Mohamad RAMMAL | 2016
Chebbo (1992) computed the contribution of each source on annual scale based on a simulation made on a theoretical catchment where certain hypotheses were made:
The total load of contaminants conveyed by wet weather flow to the outfall of combined sewer system was calculated from annual mean concentration of wet weather effluents measured on 4 combined sewers.
The pollutants mass in wastewater was evaluated from effluents measured during dry weather at the outfall of the same sites.
The pollutants’ mass produced by the runoff flow was calculated from total volume transported by wet weather flow to the outfall of combined sewer systems and a mean annual concentration established from measures made at the downstream of seven storm sewers.
Another estimation of the contributions of the three predefined sources to SS mass and organic matter was carried out by (Bachoc, 1992) on the watershed 13 in Marseille (average slope = 5%, impervious coefficient = 87%) during two rainfall events of high intensity preceded by long dry weather period. The hypotheses made were also strong considering that:
For mass balance:
Production of suspended solids from wastewater is considered negligible for these two rainfall events.
Contribution of sewer deposits is less than or equal to the average calculated on some Parisian sewers (≤44%).
Runoff water contribution for these 2 rainfall events is greater than the mean annual contribution calculated by (Chebbo, 1992).
For VM balance:
VM content in the TSS coming from the runoff water is between 17% (maximum value found during rainfall events at the outfall of 4 stormwater networks) and 35 % (double the previous value to take into account that the watershed 13 is situated in the downtown and thus the organic content of runoff water should be higher).
VM content in the TSS coming from sewer deposits is less than the VM content in particles of dry weather wastewater (≤80%).
Much more reliable evaluations of different sources quotas were later carried on in the framework of OPUR project that sought to investigate the source, characteristics, and mechanism of generation and transport of pollutants in sewer system. In its first phase, Gromaire (1998) assessed the sewer deposits’ contribution on the 42 ha watershed of “Le Marais” by the means of mass balance of pollutants entering and exiting the sewer network. The originality of this study was the important number of rainfall events considered with respect to the preceding studies (31 rainfall events of intensities varying between 1.1 mm/h
Mohamad RAMMAL | 2016
and 35.5 mm/h) along with the evaluations based on values measured on the same site and for the same rainfall events. Once again, some assumptions that smear the results with uncertainties were indispensable for the calculations:
Transposition of wastewater concentration measured in dry weather conditions to calculate its contribution during rainfall events.
Extrapolating the TSS concentration measured for runoff flow on certain surfaces to other areas with same surface type for the whole watershed
The mass of pollutants carried by runoff water is measured at the inlet point of the sewer and assigned to this source (runoff) at the outfall point, not considering the possible deposition of solids between these 2 points.
In the second phase of OPUR, further studies were carried out to find out whether the contribution results obtained on “Le Marais” are specific to this site or can be generalized to the whole sewer system of Paris. Thus, six watersheds of growing size and comparable land use were outfitted with experimental observatories in the thesis of (Kafi-Benyahia, 2006) in order to quantify the contribution of the different sources to pollutants’ transport rate at their outfalls during 5 to 16 rainfall events using the same method of mass balance used in (Gromaire, 1998).
On the two sites: Clichy in Paris and Ecully in Lyon having different sewer characteristics, (Hannouche et al., 2014) assessed the contribution of each of the three sources of pollutants (wastewater, runoff water, and sewer deposits) to the pollutants’ mass of a rainfall event. The originality of this study resides in two main points: the size of database used, the new techniques (continuous monitoring) used to acquire this big database. Similar to its previous matches, this study called for some hypotheses in its calculation procedure:
The relation used to transform the continuous measurements of turbidity to concentration on Clichy site wasn’t established on the same studied site, but taken from another site
Considering wastewater concentration measured in dry weather the same as that during rainfall events (as all previous authors). The impact of this hypothesis was tested in (Hannouche, 2012) who estimated the TSS mass generated from wastewater and that won’t settle in wet weather flow conditions. Results show that the hypothesis made on wastewater in the mass balance calculations does not induce more than 10% overestimation on the sewer deposit contribution and consequently an equal underestimation of that of wastewater.
Attributing values of TSS concentration of runoff water taken from measurements on “Le Marais” site and from literature data to the runoff water on Clichy and Ecully site respectively.
Mohamad RAMMAL | 2016
Table 1-3: Contribution of three sources (wastewater, surface runoff, sewer deposit) to TSS load at
sewer outfalls
Reference Watershed Rainfall
events WWC (%) SRC (%) SDC (%)
(Krejci et al., 1987) Pilot basin in Zurich 4 (6) (35) (59)
(Bachoc, 1992) Catchment 13, Marseille 2 <15 >56 30-44
(Gromaire, 1998) Marais 31 4-43* [21] 9-25* [15] 40-81* [64] (Kafi-Benyahia, 2006; Gasperi et al., 2010) Marais 14 9-39* (21) 3-18* (9) 54-82* (70) Sébastopol 3 23-47* (30) 5-7* (6) 46-72* (64) Quais 4 23-58* (32) 4-12* (16) 38-61* (56) Clichy center 13 29-68* (42) 5-13* (9) 22-60* (49) Coteaux downstream 8 16-45* (24) 6-12* (11) 48-70* (65) Clichy downstream 7 24-69* (37) 5-16* (12) 24-60* (51) (Hannouche et al., 2014) Clichy 88 32-48** [41] 7-13** [11] 42-57** [50] Ecully 239 11-43** [24] 11-32** [22] 30-62** [48] WWC: Wastewater Contribution
SRC: Surface Runoff Contribution SDC: Sewer Deposits Contribution
[d50] (Mean) * : d10-d90 ** : d25-d75
∴ All the studies cited above converge in their ranking of the relative contribution of the three sources, coming in the following decreasing order of importance: exchange with the deposits, wastewater, and runoff. In general, a large portion of TSS is produced by the sewer deposits; a moderate to important percentage comes from the wastewater, and a weak contribution of runoff except for Krejci et al. (1987) and Bachoc (1992) where the evaluations were based on annual scale measurements taken on another site drained by storm sewer. So, control of CSOs pollution discharge can be attained to a big extent by controlling the sewer sediments production.
Mohamad RAMMAL | 2016
3. Sewer deposits
Pollutants in CSOs were shown to be basically produced from erosion of in-sewer sediments by wet weather flow although no clear relationship between pollutant loads and the characteristics of rainfall events and those of the watershed (Gromaire, 1998). This has oriented research concerns towards this “big player” that once mastered might help reduce the impact of these CSOs. The objective was to examine the characteristics, composition, and mechanism of these deposits in different flow conditions to understand and possibly control their contribution.
3.1. Composition and Characteristics
All field surveys on sewer sediments have reported that these sediments can’t be considered as unique entity but a compound structure typically formed of three distinct components:
(1) Sewer grits accumulated on the channel bed and are predominantly mineral that are sometimes consolidated and other times loose depending on the hydraulic conditions and deposits’ age
(2) Organic pipe wall slimes and zoogloeal biofilms formed around the mean flow level (3) Organic near bed materials
3.1.1. Sewer grits
The first type was identified by almost all researchers (Crabtree, 1989; Bachoc, 1992; Verbanck, 1992; Ristenpart, 1995) who realized detailed fieldwork programs on sewer deposits and noticed the prevalence of coarse mineral materials accumulated on the bottom of sewer channels. This stock is found to be formed of the granular particles washed from the surface by runoff flow and entering through gully pots into the sewer system that, due to their high density, can’t be hold suspended for long distances especially in the slow flow zones and thus settle down early after joining the sewer system. So, they are found in significant amounts at the upstream of the sewer channels and are cohesive and consolidated and thus difficult to erode. The table 1-4 below shows some order of magnitude of density, organic content, and metallic content of this type of deposits.
Mohamad RAMMAL | 2016 Watershed (reference) Dundee (Crabtree, 1989) Marseille channel 13 (Bachoc, 1992) Bruxelles (Verbanck, 1992) Hildesheim (Ristenpart et al., 1995) Marais (Ahyerre, 1999)
and for metals (Garnaud, 1999) MVS/TSS (%) 2.77 – 27.69 (7) 2 – 17.6 (7.7) 2 – 6 3.6 – 11.8 (7.6) 3 – 13* (4) COD/TSS (gO2/g) 0.006 – 0.079 (0.023) – – 0.014 – 0.269 (0.069) 0.06 – 0.22* (0.16) BOD5/TSS (gO2/g) 0.001 – 0.04 (0.005) – – 0.003 – 0.089 (0.014) 0.01 – 0.058* (0.017) Density (kg/m3) (1720) 2510 – 2700 (2630) 1510 1350 – 1820 (1560) 2418 – 2800* (2593) Cd (mg/kg) - - - - 1.64 – 5.73* (3.9) Cu (mg/kg) - - - - 470 – 1230* (870) Pb (mg/kg) - - - - 1210 – 2280* (1870) Zn (mg/kg) - - - - 2461 – 5750* (4047)
Min – max (mean) * d10 – d90 (d50)
Grey shaded cells: Type A < 400 µm
Table 1-4: Characteristics of sewer grits on different combined sewer systems
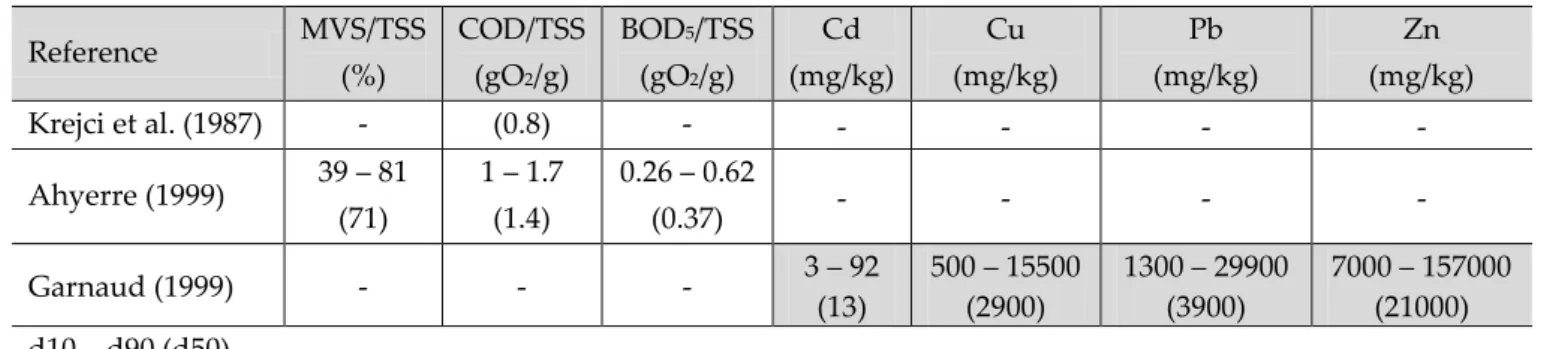
3.1.2. Biofilms
The biofilms are constituted of colonies of Zooglea formed intermittently on the sewer wall and have a filamentous and rough surface with a few millimeters thickness (Flemming, 1995). It was identified by many researchers (Crabtree, 1989; Krejci et al., 1987; Michelbach, 1995, Ahyerre, 1999; Garnaud, 1999; Oms, 2003) who observed the formation of this type of deposits on the sewer section walls. The constitution of this layer basically occurs during dry weather depending on the hydraulic conditions and the walls’ roughness. It was found to be the most concentrated type of the deposits in terms of pollutants (Crabtree, 1989) with high organic content and high concentration of heavy metals and micro-pollutants (Ahyerre, 1999). However, as the wall slimes are intermittent and difficult to sample, little attention has been given to them (Ashley and Crabtree, 1992). Organic and metallic content obtained when analysing this type of deposits are represented in table 1-5 below.
Reference MVS/TSS (%) COD/TSS (gO2/g) BOD5/TSS (gO2/g) Cd (mg/kg) Cu (mg/kg) Pb (mg/kg) Zn (mg/kg) Krejci et al. (1987) - (0.8) - - - - - Ahyerre (1999) 39 – 81 (71) 1 – 1.7 (1.4) 0.26 – 0.62 (0.37) - - - - Garnaud (1999) - - - 3 – 92 (13) 500 – 15500 (2900) 1300 – 29900 (3900) 7000 – 157000 (21000) d10 – d90 (d50)
Grey shaded cells: Type A < 400 µm
Mohamad RAMMAL | 2016
3.1.3. Organic near bed sediment
This type of deposits has been the subject of long discussions among researchers who haven’t yet reached a consensus in defining the identity of this interface in terms of composition, origin, build-up, transport and mobility. Chebbo et al. (2003) reviewed the different studies carried out on this sediment type on different sites: Belgium (Verbanck, 1995), Germany (Ristenpart, 1995), UK (Arthur, 1996), France (Ahyerre et al., 2000) in order to understand and establish a coherent overview on the different results obtained in these studies. It was reported that there is a general agreement on the organic nature of this sediment type but not on its transport mode. The divergence concerning this latter was attributed to the different ambient flow conditions between the studied sites and the different experimental methods used to sample/observe this sediment type. According to their composition and behaviour observed during different campaigns, this interface was given different denominations (Table 1-6).
Denomination Watershed Reference
Type C deposit Several sites, UK Crabtree (1989)
Near Bed Solids (NBS) Dundee, UK Arthur et al. (1996)
Organic layer Marais, Paris, France Ahyerre (1999), Oms (2003)
Fluid sediment:
Organic near bed fluid sediment Dense undercurrent Dense layer Dundee, UK Hildesheim, Germany Brussels, Belgium Nantes, France Arthur et al. (1996) Ristenpart et al. (1995) Verbanck (1995) Hemmerle (2014)
Table 1-6: Different denominations of the fluid sediment organic solids
3.1.3.1. Type C deposit
In his five-fold classification system of deposits (A-E) established on a number of sewers in UK, Crabtree (1989) described the interface between the sewer flow and the coarse deposits (Type A) by a mobile fine-grained deposits formed in slack flow zones, either in isolation or above coarse deposits. The rheological characterization revealed the weak cohesion of this thin layer that makes it easily erodible in a bed-load fashion during small storms event under the influence of small bed shears. It was also identified as being potentially important for polluting watercourses due to its strongest pollution concentration (Table 1-7) (Crabtree, 1989; Ashley et al., 1990; Ashley et al., 1992; Ashley and Crabtree, 1992). Samples analysed in these studies were all collected using a silt trap built inside the in-situ flume.
Mohamad RAMMAL | 2016 Table 1-7: Pollutants’ content in Type C deposits on different sewer systems
3.1.3.2. Near Bed Solids
Near bed solids are defined by Arthur (1996) as all solid particles transported at the flow bed regardless of their physical and chemical characteristics. Three field data collection programs were conducted on Dundee site to study sewer sediments and pertaining processes between June 1992 and August 1995 on three different points of the sewer: one in a trunk sewer, another at the head of an interceptor sewer, and the other at the downstream end of the same interceptor sewer. Samples of the near bed solids were collected using a sediment trap compartmentalized into five to six rectangular containers fixed on the bottom of a PVC conduit installed on each site. The characteristics of the samples taken were so variable from one site to another and represent a variable volatile solid content at the same point and among the three points (Table 1-8).
Catchment (Reference) Site Volatile content (%)
Dundee (Arthur et al., 1996)
Trunk 1.0 – 61.8
Interceptor upstream 12.5 – 83.9 Interceptor downstream 55.6 – 87.6
Table 1-8: Pollutants’ content (volatile matter) in the Near Bed Solids of Dundee sewer system
3.1.3.3. Organic layer
On the Marais sewer system, Ahyerre et al. (2000) developed a new observational system and another sampling one that permit to minimize the effect of the experimental procedures on in-situ observations and sediment sampling results:
The sampling system comprised a PVC parallelepiped box (1.2m long x 50 cm wide x 55
cm high) open at both ends where two PVC watertight panels can be slid down to stop water from flowing into the box. The device is pushed down into the deposits with its length put along the flow direction, the panels are slid down, the sewage inside the box is pumped out until reaching the deposits surface that is sampled using a small shovel until reaching the coarse deposits. This method permits to take samples of the near bed organic sediments without influencing the structure of the deposits and thus to obtain
Watershed (Reference) Volatile content (%) COD/TSS (gO2/g) Dundee sewers
(Crabtree, 1989) 50 0.076
Dundee interceptor sewer
Mohamad RAMMAL | 2016
undisturbed samples that would be more representative than those taken by the multi-depth sampler where aspiration might occur blindly.
The observation system is made up of a PVC box (1.5 m long x 55cm high x 11 cm wide)
bevelled on the sides so as not to disturb the flow when pushed down the deposits and fixed against the side wall. Its front side is made up of glass and at the bottom there is a mirror inclined at 45° so that to reflect an image of the sewer sediments for a top viewer. This system was later improved by Oms (2003) who embedded the box into the side wall and installed an automatic camera system to capture photos reflected by the inclined mirror at a fixed time step (15 minutes). Oms (2003) employed another advanced technique to observe these deposits, i.e. the endoscope which is easily transportable and allows observing sediments without disturbing them.
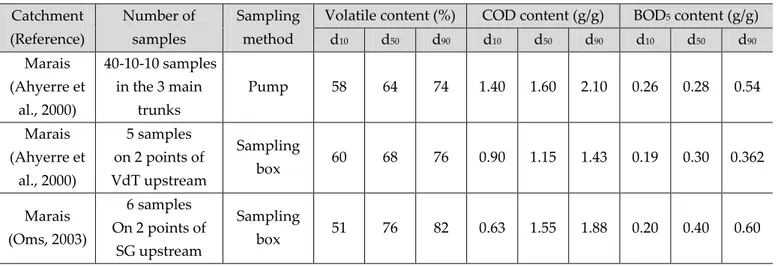
Catchment (Reference) Number of samples Sampling method
Volatile content (%) COD content (g/g) BOD5 content (g/g) d10 d50 d90 d10 d50 d90 d10 d50 d90 Marais (Ahyerre et al., 2000) 40-10-10 samples in the 3 main trunks Pump 58 64 74 1.40 1.60 2.10 0.26 0.28 0.54 Marais (Ahyerre et al., 2000) 5 samples on 2 points of VdT upstream Sampling box 60 68 76 0.90 1.15 1.43 0.19 0.30 0.362 Marais (Oms, 2003) 6 samples On 2 points of SG upstream Sampling box 51 76 82 0.63 1.55 1.88 0.20 0.40 0.60
Table 1-9: Pollutants’ content in organic layer on the Marais catchment
Ahyerre (1999) started his field investigations of this sewer type by sampling it using a multidepth sampler on a 50m space step along the three main collectors of the Marais sewer and then analysing 40 samples for the volatile content, 10 samples for the COD content, and 10 for the BOD5 content (Table 1-9). Results obtained of these analyses showed similar
characteristics to the fluid sediment observed on other sites. But when some difficulty was encountered in the mass balance closure on the sewer scale between eroded particles and this sediment layer, a more local investigation was conducted (Ahyerre, 1999). So, observations were then made by the PVC box (Ahyerre et al., 2000) installed in a pipe where the sampling analysis showed a highly organic sediment layer (upstream on Vieille du Temple). These observations showed a stratified structure of deposits with a well delimited immobile layer formed on top of the coarse deposits (Table 1-9) with a thickness varying between 1.5 cm and 7 cm. Samples taken by the sampling box of this immobile layer revealed similar characteristics to the fluid sediment observed on the whole sewer scale and thus this latter was supposed to be only an aspiration of the organic immobile layer. These results were then confirmed by the endoscope observations realised between December 2000 and January 2001 along the 3 main