OATAO is an open access repository that collects the work of Toulouse
researchers and makes it freely available over the web where possible
Any correspondence concerning this service should be sent
to the repository administrator:
[email protected]
This is a
n author’s version published in:
https://oatao.univ-toulouse.fr/27116
To cite this version:
Prézélus, Flavie and Tiruta-Barna, Ligia and Guigui, Christelle and
Remigy, Jean-Christophe A generic process modelling – LCA
approach for UF membrane fabrication: Application to cellulose
acetate membranes. (2021) Journal of Membrane Science, 618.
118594. ISSN 0376-7388
Open Archive Toulouse Archive Ouverte
Official URL :
A generic process modelling – LCA approach for UF membrane fabrication:
Application to cellulose acetate membranes
Flavie Pr´ez´elus
a,b, Ligia Tiruta-Barna
b, Christelle Guigui
b, Jean-Christophe Remigy
a,*aLaboratoire de G´enie Chimique, Universit´e de Toulouse, CNRS, INPT, UPS, Toulouse, France bTBI, Universit´e de Toulouse, CNRS, INRAE, INSA, Toulouse, France
A R T I C L E I N F O Keywords: Process modelling LCA Membrane preparation Ultrafiltration Ecodesign A B S T R A C T
The purpose of the research is to elaborate and implement a decision-making tool for greener membrane fabrication. The scientific novelty put forth in this study is the generic process modelling – LCA approach applied to the field. The resulting parameterized model allows to obtain material and energy flows as a function of operating conditions for ultrafiltration hollow fibers prepared by non-solvent induced phase separation. Its modular configuration allows for flexibility and adaptation to various membrane materials and industrial practices. Contributions of inputs on environmental impacts can be assessed, as well as the influence of operating conditions. Results for cellulose acetate membranes show major contributions of NMP (i.e. solvent) and glycerol (i.e. pre-conditioning liquid). Improvement strategies for environmental mitigation include acting on glycerol- related operating conditions and are to be considered within the geographic context of membrane fabrication; further technical and economic feasibility studies would embed these strategies in a full eco-design approach. Such a methodology and results should be taken into account for the elaboration of “green membranes” whatever the application and coupled with the impact of membrane use and end-of-life.
1. Introduction
Due to the relative simplicity of its set-up the non-solvent induced phase separation (NIPS) process is predominantly used on an industrial scale to fabricate porous asymmetric ultrafiltration (UF) membranes [1]. The industrial process can be divided into three stages: hollow fiber spinning, module preparation and module testing [2]. Although research on the understanding of phase inversion mechanisms dates back to the 1960s [3, 4], environmental concerns related to membrane fabrication is still in its recent years and research efforts are essentially focused on substituting toxic solvents [5–7] and petrochemical-based polymers [8–9]. As fleshed out in the followings, a comprehensive and rigorous approach to determine the influence of operating conditions and raw materials on the induced environmental impacts is missing in the literature.
One well-established environmental assessment tool is Life Cycle Assessment (LCA), which is performed following four interdependent phases [10]: (1) goal and scope definition, (2) listing and quantification of material and energy flows from and to the environment in a life cycle inventory (LCI), (3) transformation into potential environmental im-pacts with life cycle impact assessment (LCIA) methodologies (e.g.
ReCiPe endpoint, IPCC GWP100a), and (4) review, recommendations and improvement strategies.
An increasing number of studies explore LCA with process modelling for the eco-design of processes [11–15]. A notable example is the tool developed by Mery et al. [16] and based on parameterized models of unit operations for the eco-design of drinking water plants. These pa-rameters include design facts, equipment sizing and operating condi-tions. Performances of a given treatment process chain are determined in terms of environmental impacts and attributed to unit operations. Another aspect allowing for eco-design is the sensitivity analysis method integrated in the tool: influential parameters affecting performances are identified. Alternative treatment process chains and operating condi-tions are tested and compared to a reference situation so as to find an optimal solution. In this study, membrane unit operations have however not been dealt with, perhaps due to relative novelty of this technology as compared to well-established conventional treatment unit operations. To the best of our knowledge, such methodological approach has not been undertaken for membrane fabrication.
The life cycle of membranes involves three main processes: (1) module and membrane fabrication, (2) operation during which raw water is filtered, and (3) end-of-life process that may involve disposal,
* Corresponding author.
E-mail address: [email protected] (J.-C. Remigy).
These LCA studies are furthermore predominantly carried out under fixed site-specific operating conditions, or else use limited values for the variable operating conditions (see Table 1). Friedrich [19] for example
defines scenarios according to three design parameters (i.e. module length, number of modules per rack, membrane filtration flux), each of which can have two different values. Vince et al. [20] go beyond sce-narios and have developed black-box models for drinking water unit operations to calculate the LCI and output water characteristics from three types of input parameters: equipment design (e.g. type of mem-brane), local conditions (e.g. energy supply, plant location) and feed water characteristics (quality, flow rate). Unfortunately, no further detail is given on model functions or the specific influence of operating conditions on membrane fabrication.
The literature review has highlighted both the lack of comprehensive environmental studies on membrane fabrication and the limited number of studies with variable operating conditions (a premise for eco- designing). The present study goes further and introduces a generic process modelling – LCA approach in the field. The resulting parame-terized model fills the identified knowledge gaps. In particular, this generic model lists material and energy flows as a function of operating conditions for UF hollow fibers prepared by NIPS. Its goal is two-fold: (1) assess the contribution of material and energy on the environmental impacts of hollow fiber fabrication and (2) investigate the influence of its operating conditions. Improvement strategies to reduce these impacts can then be suggested and acted on.
After the model description, the case of cellulose triacetate (CTA) membranes fabricated in France and used in drinking water production is presented as application case. Obtained material and energy balances are further used with the LCA method to evaluate the environmental impacts of module fabrication. Then, a sensitivity analysis explores, among other things, the influence of specific operating conditions on environmental performances.
2. Methods
In this first part, explanations are given on the considered membrane module and fabrication process. The principles and assumptions of the model development are presented in section 2.2. The model is based on mass and energy balances of each unit operation, considering main phenomena and process parameters. The modular modelling approach allows to connect the unit operations for the entire process. All model equations and a dataset of model parameters are detailed in the corre-sponding Data in Brief. Then, the three first LCA phases are dealt with: goal and scope definition in section 2.3, LCI in section 2.4 and LCIA methodologies in section 2.5.
2.1. Module description and fabrication process
The module considered is composed of a membrane housing inside which hollow fibers are maintained on both ends by adhesive, and auxiliary equipment (end caps, venting plugs, flange) (see Fig. 1). Grids assemble hollow fibers in bundles inside the module. Two examples are given in the zoom view of Fig. 1.
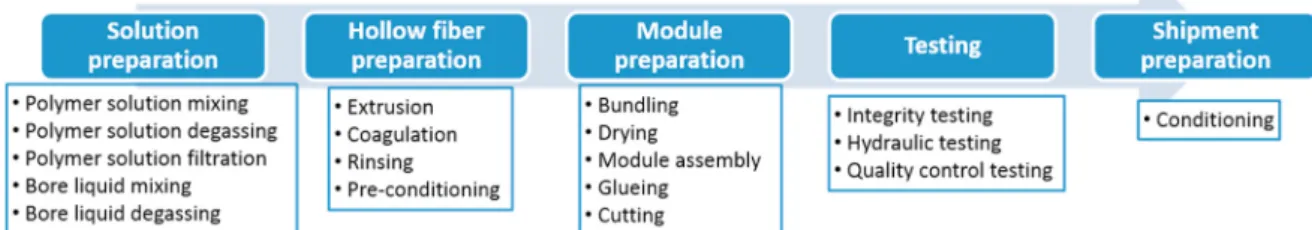
The fabrication process of hollow fibers by NIPS is modelled as a sequence of unit operations that can be divided into main steps as illustrated in Fig. 2.
- Solution preparation (discontinuous unit operations). An addi-tive is dissolved in a solvent, after which a polymer is added. The resulting homogeneous polymer solution is filtered to remove any macro-waste or undissolved polymer and degassed under vacuum at a constant temperature. A bore liquid is also mixed, heated and degassed at a regulated temperature.
- Hollow fiber preparation (continuous unit operations). The polymer solution is extruded through a tube-in-orifice spinneret in a coagulation bath filled with a non-solvent kept at a constant tem-perature. The resulting polymer-lean phase (solvent, additive and bore liquid) mixes with the non-solvent and are either recycled or discharged in the sewage network. The hollow fiber, under its final
Table 1
System coverage of membrane fabrication in LCA studies of membrane-based systems for water treatment.
LCA Goal & Scope Fabrication operating conditions Reference
Fixed Variable
Comparison of water
purification systems module materials (membrane, membrane housing, module parts, adhesive),
fabrication inputs (solvent, pre- conditioning liquid, electricity, natural gas, water) membrane coating frequency [17] Environmental impact of a reverse osmosis desalination pre- treatment module materials (membrane, membrane housing, adhesive, conditioning liquid), fabrication inputs (solvent, additive, electricity, natural gas, water) – [21] Comparison of conventional and ultrafiltration water production module materials (membrane, membrane housing, end caps, adhesive) module length, number of modules per rack [19] Comparison of seawater desalination and wastewater reclamation processes module materials (membrane, membrane housing, spacer, collection tube, grid, adhesive) membrane packing density [22] Environmental impacts of desalination processes module materials (membrane, spacer, membrane housing, condenser) membrane and housing materials [23] Comparison of water
supply systems module materials (membrane, membrane housing, end caps, adhesive) type of membrane [20] Comparison of conventional and nanofiltration water treatment plants module materials (membrane, membrane housing, module stowage) – [24] Environmental impacts of a desalination plant module materials (membrane, membrane housing, grid, potting sleeves, adhesive) – [25] Environmental impacts of a microfiltration process module materials (membrane, membrane housing, grid, potting sleeves, adhesive) – [18] Comparison of desalination technologies module materials (membrane, membrane housing) – [26]
recovery and/or reuse. As regards LCA studies on membrane-based systems, listed membrane material flows are either incomplete or lack of consideration for module fabrication. Whereas the manufacture of the materials making up various module components may be taken into account, inputs such as energy and solvent needed during the manu-facture of membrane modules are most often omitted (see Table 1). Impacts due to their production and use have however shown to be greater than those related to membrane material [17]. Such incom-pleteness in system boundary can only underestimate the environmental impact of module fabrication. Tangsubkul et al.’s [18] analysis of a microfiltration process used for secondary effluent filtration should be therefore qualified. It is brought out that membrane manufacturing has a significant impact compared to membrane operation for low fluxes. If all inputs were to be considered, membrane manufacturing could become significant over a larger range of operating conditions.
structure, is driven along the spinning chain into the rinsing bath and pre-conditioning bath where it is sprayed, respectively, with rinsing water and a viscous pre-conditioning liquid at a controlled temperature.
- Module preparation. The hollow fiber wound with a mechanical arm is assembled into bundles for good hydraulic profile inside the module during UF. To ensure effective chemical adhesion the fiber lumen is dried by passing compressed air through it. The removed liquid is collected. Fiber bundles are contained in grids and placed within a membrane housing. A pre-adhesive and adhesive are injected at both module ends. The cutting step allows to remove any unnecessary (pre-)adhesive and hollow fibers are consequently open at both extremities.
- Testing. The intactness of hollow fibers is checked by integrity testing (e.g. pressure hold tests, bubble tests). Detected defective fi-bers are filled with adhesive on both ends to condemn it. Pores are then rinsed of pre-conditioning liquid with water. Permeability is measured during hydraulic testing. If permeability specifications are unmet, fibers inside the module are put to waste with the adhesive whereas the membrane housing is recycled. Fiber samples are collected before bundling and tested for quality control (perme-ability, fiber diameter and tensile force measurements).
- Shipment preparation. The module is conditioned to avoid mem-branes from drying out and to hamper bacterial growth during transportation and storage before operation. Module ends are pro-tected and sealed by end caps and venting plugs. A flange is added. 2.2. Model development
Given that focus is given to membrane fabrication, the appropriate
object of study is 1 m2 of filtration surface of the fabricated membrane. Consumptions per 1 m2 of fabricated membrane are deduced for each unit operation from material and energy balances carried out with model input parameters (operating conditions, engineering design facts, technical constraints and fluid properties), as shown in Fig. 3. 2.2.1. General assumptions
The membrane fabrication process is modelled as a batch process: material and energy consumptions are calculated for one polymer so-lution batch and then reported per m2 of hollow fiber. This assumption stems from industrial practices. The production capacity (i.e. number of modules fabricated per polymer solution batch) can be calculated from two parameters determined on the basis of a weekly production: number of polymer solution batches per week and number of modules fabricated per week. The production capacity is thus not fixed and allows for a generic model.
Modules are fabricated step by step over several workstations. Only the five unit operations associated with the spinning chain are operated in a continuous mode: extrusion, coagulation, rinsing, pre-conditioning and bundling. Other unit operations are operated in a discontinuous mode. The Gantt diagram for membrane and module fabrication is given in the Supplementary Information.
A significant feature is that consecutive batches are considered without downtime, which implies the continuous operation of the spinning chain. This might not actually be the case, notably for smaller production sites for which the spinning chain can be set in stand-by during downtime between polymer solution batches; heating devices of the spinning chain may be kept in operation for constant temperature in the various tanks. In such a case, the model underestimates energy consumption in a manner proportionate to downtime.
Fig. 1. Sectional view of a module.
Another assumption concerns the three tanks of the spinning chain (i. e. coagulation, rinsing, pre-conditioning): they are already filled with the respective liquids at the desired temperature. The continuous operation of the spinning chain implies that warming-up energy for the tanks is negligible compared to operation energy needed to heat input flows and compensate for heat loss.
The equipment used for membrane and module fabrication (tanks, spinneret, pumps, etc.) is not specifically inventoried as such but is taken into account through generic data on chemical plants found in LCA databases (see also sections 2.3 and 2.4).
The main limitation of the study lies in the assumption that mem-branes obtained have the adequate selectivity for drinking water ap-plications, regardless of operating conditions applied during membrane fabrication. This assumption is made necessary given the lack of accu-rate tools in the field of membrane science to predict membrane prop-erties (i.e. molecular weight cut-off, permeability) from fabrication operating conditions. Consequently, when using the fabrication model, the range of variation of operating parameters should be chosen in accordance with the technical feasibility for good quality membranes. 2.2.2. Assumptions for material balance
For polymer solution and bore liquid preparation, hollow fibers are composed solely of polymer material and one bore liquid batch is considered per polymer solution batch. The latter assumption is based on industrial practices.
The coagulation, rinsing and pre-conditioning tanks are modelled as continuous stirred tanks. Ideal mixing is assumed, which means constant temperature and density in the tanks including in the hollow fiber pores and lumen. In reality, temperature and concentration gradients exist but mean values of these parameters are sufficient for the mechanistic modelling of consumptions.
Furthermore, no pore contraction or expansion is taken into account: the volume of pores and fiber lumens remains unchanged and filled with liquid along the spinning process. The volume of pores is estimated to the volume of solvent at coagulation temperature, which can be justified by a material balance on the solvent and polymer.
During drying, the inside of fiber lumens is completely emptied. Pores remain filled with the pre-conditioning liquid. During cutting, liquid inside pores of reject hollow fibers goes to waste with hollow fibers.
Darcy’s law, applicable to incompressible fluids, is applied to determine water consumed during hydraulic testing. Defective modules are properly considered in the inventory: their hollow fibers go to waste along with the adhesive and liquid included inside pores and lumens, and their membrane housings and auxiliary equipment (end caps, venting plugs, flange) are recycled for use in non-defective modules.
Integrity testing and quality control are neglected in material bal-ances because material consumption is near zero. Only compressed air is consumed for integrity testing. A negligible hollow fiber length compared to the total produced length is sampled for quality control.
During conditioning, the void volume between hollow fibers is filled with conditioning liquid.
2.2.3. Assumptions for energy balance
During scale-up of polymer solution and bore liquid preparation, power density dissipated by the stirrer remains constant [27]. Energy consumption of stirring (Estirring, J) is calculated as follows [27]:
Estirring= ( Pstirring Vstirred ) ⋅Vstirred ηstirrer ⋅tstirring (1) where Pstirring
Vstirred is the power density dissipated by the stirrer (W m
−3), Vstirred is the stirred volume (m3), ɳstirrer is the stirrer efficiency and tstirring is the stirring duration (s).
The stirring power (Pstirring, W) is either measured or calculated with flow-regime-dependent relationships; equations (2) and (3) are for laminar and turbulent flow regime respectively [27]:
Pstirring=k⋅μ⋅N2⋅φ3
stirrer (2)
Pstirring=Np⋅ρ⋅N3⋅φ5
stirrer (3)
where k is the proportionality constant in laminar flow regime, μ is the
stirred fluid’s viscosity (Pa s), N is the stirring rate (s−1), ϕstirrer is the stirrer diameter (m), Np is the power number in turbulent flow regime and ρ is the stirred fluid’s density (kg m−3).
During polymer solution and bore liquid preparation, the enthalpy of mixing is neglected (order of magnitude 10−3 kWh per kg of polymer [28]). It is indeed negligible when compared to energy needed to heat or cool fluids. Mechanical energy from stirring is entirely dissipated and heats the stirred fluid. The net energy (Eheating, J) needed to bring a fluid at the desired temperature is calculated with the liquid’s specific heat capacity (Cp, J kg−1 K−1) and stirring energy effectively dissipated (Estirring. ɳstirrer, J) [27,29]:
Eheating=mheated⋅ Cp ⋅(Tfinal− Tinitial)− Estirring⋅ηstirrer (4) where mheated is the heated mass (kg), Tfinal is the fluid’s final temper-ature (K) and Tinitial is the fluid’s initial temperature (K). Energy (Eheating, J) is also required to maintain constant temperature of polymer solution and bore liquid during their respective degassing [29]: Eheating=U ⋅ S ⋅(Tfluid− Tair)⋅tdegas (5) where U is the global heat transfer coefficient (W m−2 K−1), S is the exchange surface (m2), Tfluid is the fluid’s temperature (K) (i.e. polymer solution, bore liquid), Tair is the air’s temperature (K) and tdegas is the degassing duration (s). The global heat transfer coefficient (U, W m−2 K−1) considers conduction through the concerned vessel wall’s thickness and convection on the outside of the vessel, weighted by the heat ex-change surfaces involved. A standard Rushton vessel (i.e. vessel diam-eter equal to the liquid’s height in the vessel) is considered to calculate the exchange surface (S, m2) [29]:
U ⋅ S =[ 1 xvessel λjacket⋅ Slogmean,vessel+ 1 hair⋅ Souter,vessel ] (6)
where xvessel is the vessel wall’s thickness (m), λjacket is the vessel jacket’s thermal conductivity (W m−1 K−1), Slog mean, vessel is the logarithmic mean difference between the vessel’s outer and inner surfaces (m2), hair is the convective heat transfer coefficient for air (W m−2 K−1) and Souter is the vessel’s outer surface (m2).
For coagulation, rinsing and pre-conditioning, the energy needed to bring a fluid at the desired temperature (Eheating, J) is calculated with its specific heat capacity (Cp, J kg−1 K−1) [29]:
Eheating=mheated⋅ Cp⋅(Tfinal− Tinitial) (7) where mheated is the heated mass (kg), Tfinal is the fluid’s final temper-ature (K) and Tinitial is the fluid’s initial temperature (K). There is no stirring in the three continuous unit operations. Fluid recirculation en-sures homogeneous temperature in the concerned tanks.
Heat loss is considered for both discontinuous and continuous unit operations (Eheat loss, discontinuous and Eheat loss, continuous respectively, J) with separate global thermal transfer efficiencies (ɳthermal,discontinuous and ɳthermal,continuous respectively).
Eheat loss,discontinuous= ( 1 − ηthermal,discontinuous ) ηthermal,discontinuous ⋅Ereceived by fluid (8) Eheat loss,continuous= ( 1 − ηthermal,continuous ) ηthermal,continuous ⋅Ereceived by fluid (9) where Ereceived by fluid (J) is the total energy received by the fluid. These two efficiencies are indeed defined as the ratio between energy theo-retically needed in an athermal system (see equation (7)) and energy effectively required.
Energy consumption of pumping (Epumping, J) is calculated either with the pump’s differential pressure (ΔP, Pa) or total manometric head (Δh, m) which both take minor and linear head loss into account [30]: Epumping=Vpumped⋅ΔP ηpump (10) Epumping=mpumped⋅ g ⋅ Δh ηpump (11) where Vpumped is the pumped volume (m3), ɳpump is the pump’s effi-ciency, mpumped is the pumped mass (kg) and g is the gravitational ac-celeration (m s−2).
Energy consumptions of specific units (i.e. bundling, drying, gluing, cutting) are not modelled. Industrial values of machine power con-sumptions are taken if available. Integrity testing and quality control are neglected because energy consumption is near zero.
2.3. LCA goal and scope
The model described in previous sections provides a material and energy inventory for the subsequent LCA. To illustrate the capabilities of the process modelling – LCA approach, the concrete example of the fabrication process of an UF module based on a NIPS CTA membrane is presented. The objectives here are to evaluate its environmental per-formances, investigate the influence of operating conditions and identify improvement strategies.
The module is fabricated in France and further used for drinking water production. The functional unit is 1 m2 of filtration surface of the membrane embedded in the module. The conversion to cubic meters of produced drinking water depends on the applied filtration flux on the drinking water plant, which is out of the scope of this study.
The system boundaries are from material and energy supply to shipment preparation (see Fig. 4.). The construction and building of the production site is included in the environmental assessment, as well as utilities for its lighting and temperature control (heating, air condi-tioning …). The system boundaries include the transport of inputs and outputs from and to the production site, as well as waste treatment and disposal outside the production site.
For LCA, Umberto NXT software is used with ecoinvent 3.4 database for background processes (i.e. energy production, transportation, chemicals production, waste treatment, etc.) included in the life cycle system. The inventory data imported from ecoinvent is used with the default allocation method (i.e. allocation at the point of substitution). 2.4. Life cycle inventory (LCI)
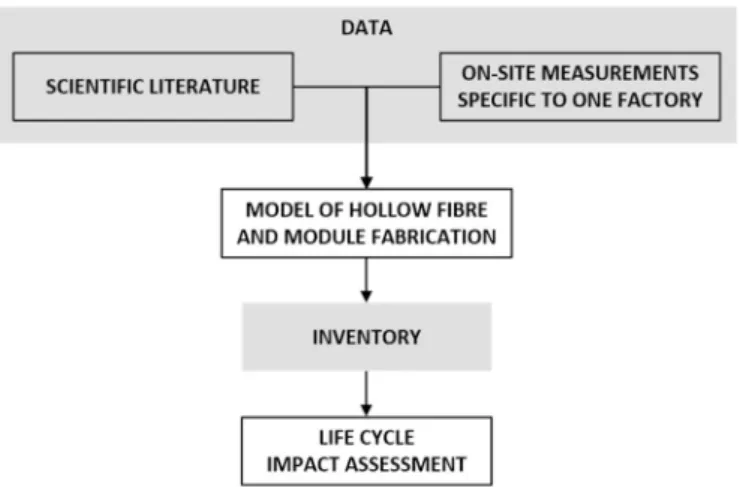
Data collected concerns our case study of CTA membranes fabricated in France and used for drinking water production. It comes from the literature and on-site measurements specific to a membrane fabrication factory (see Fig. 5.). The inventory obtained from the model is used for the subsequent LCA.
On-site measurements have been performed in 2000 during a week- long measurement campaign conducted by an industrial, whose name is kept confidential, at the process’s nominal operating point (i.e. one batch of polymer solution, which corresponds to 10 modules). Flow
Fig. 4. LCA system boundary of membrane module fabrication model.
3. Results and discussion
This section develops the results obtained by applying the process modelling – LCA approach to a UF CTA membrane commonly used for drinking water production. As explained in previous sections, the membrane fabrication model is used to generate the material and energy inventory for the reference scenario following industrial practices in a French factory. After the impact calculation and discussion, a sensitivity analysis on the operating parameters is conducted and means of improving environmental performances are identified.
3.1. LCI analysis for the UF module - NIPS CTA membrane
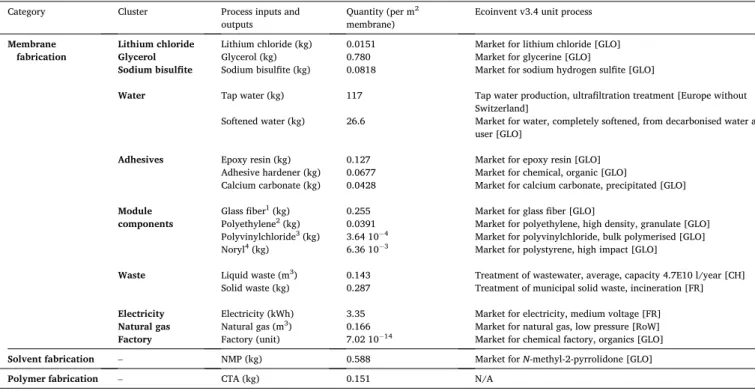
The obtained inventory is given in Table 3 and unit process from the used LCI database (i.e. ecoinvent v3.4) is given for each input and output.
Given that few LCA studies on membrane-based systems address membrane fabrication otherwise than by considering module materials (see Table 1), it is difficult to compare the exhaustive inventory in
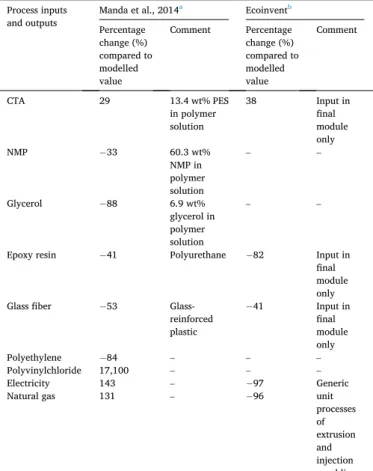
Table 3 to other inventories in the literature. Furthermore, Beery et al.‘s [21] work is based on industrial fabrication data of material and energy inputs but figures are unfortunately not made available in the published version. A comparison can however be made with Manda et al.‘s [17] inventory; their functional unit (i.e. 1 m3 of drinking water) can be readily converted to the one of the present study (i.e. 1 m2 of membrane) thanks to information given on filtration flux and membrane lifespan. It can be observed that great discrepancies exist between the two in-ventories: from 29 to 17,100% in absolute values, depending on the considered material or energy input (see Table 4). It should be stated that the composition of the polymer solution in Manda et al.’s (2014) inventory differs, notably in that it includes glycerol. Whereas glycerol is used during pre-conditioning in our modelled inventory, this stage is omitted in Manda et al.’s (2014) work. Further difficulties to compare with Manda et al.’s (2014) inventory arise from the lack of information on skid and module characteristics. No detail is given on module di-mensions or auxiliary equipment, thereby making it challenging to comment consumptions of epoxy resin, glass fibre, polyethylene and polyvinylchloride. Interestingly, an inventory of UF module fabrication exists in the ecoinvent database. As for most LCA studies, inputs are only those found in the final module, neglecting for example waste during the fabrication process. Electricity and natural gas are estimated using generic unit processes associated with plastic processing, hence signifi-cant percentage changes (i.e. 96-97%) with modelled energy con-sumptions (see Table 4). From this limited inventory comparison, one should notice that the present study provides the most complete set of data based on industrial practices, which is rare in the field.
3.2. Total impacts for 1 m2 membrane
In the reference situation, IPCC GWP100a and ReCiPe endpoint scores for the fabrication of 1 m2 of conventional membrane equal 11 kg CO2-eq and 1.9 points respectively. Process inputs and outputs of the membrane fabrication process have been divided into three groups: membrane fabrication, solvent fabrication and polymer fabrication. As shown in Fig. 6(a)-(b), membrane fabrication accounts for approxi-mately two-thirds of ReCiPe endpoint scores, solvent fabrication for a quarter and polymer fabrication for the remaining portion. For IPCC GWP100a results, the difference in contribution between membrane and solvent fabrication is smaller (40 and 45% respectively). Polymer fabrication remains the least important contributor to environmental impacts (15%).
The majority of the ReCiPe endpoint score concerns two impact categories: agricultural land occupation (0.71 points) and fossil deple-tion (0.45 points) (see Fig. 7.). Agricultural land occupation is almost exclusively (>96.0%) due to glycerol fabrication, accounted for in membrane fabrication: oil seed crops (rape oil, soybean oil, palm oil) are esterified to obtain the chemical as a by-product, which is then used as pre-conditioning liquid. Only 2% is due to cellulosic polymer fabrication from wood pulp. As for fossil depletion, 35.0%, 45.2% and 19.8% of the score stem from membrane, solvent and polymer fabrication, respec-tively (see section 3 of the Supplementary information). The contribu-tion of solvent fabricacontribu-tion to fossil deplecontribu-tion can be related to the petrochemical origin of NMP, which is obtained from the reaction be-tween gamma-butyrolactone and methylamine [31]. Opportunities for a biosourced solvent such as, for example, methyl lactate [7] could be considered to reduce fossil depletion. The ReCiPe endpoint score also concerns climate change related to both the ecosystem quality and
Table 2
Main parameters for the reference situation.
Parameter Value
Polymer solution composition (CTA: NMP: LiCl) 20 : 78: 2 Hollow fiber inner and outer diameters (mm) 0.93, 1.67
Module inner diameter and length (m) 0.3, 1.3
Temperature (◦C) Polymer solution 60
Coagulation bath 35
Rinsing bath 30
Pre-conditioning bath 30
Pre-conditioning liquid Glycerol
Defective module reject rate after hydraulic testing (%) 1
rates, fluid temperatures and electric power of devices were measured. The thermal transfer efficiencies for both discontinuous and continuous unit operations have been calculated for the reference situation on the basis of these measurements. Measurements were repeated three times for heating during spinning, coagulation, rinsing and pre-conditioning: reproducibility was observed. There is also consistency between indus-trial operating conditions and those found in the scientific literature (see section 1.5. of the Data in Brief for precise values and references).
A reference situation based on industrial practices is considered, for which the main parameters are listed in Table 2. Based on these values, the material and energy inventory of membrane fabrication is calculated with the developed model. Ecoinvent database is used to complete the inventory of the background processes (i.e. material and energy production).
However, ecoinvent database does not contain datasets for the in-ventory of adhesive hardener and CTA polymer. The former is thus approximated to a generic organic chemical. The latter has been calculated based on Manda et al.’s [17] study. Assumptions made, the final inventory of CTA fabrication and the corresponding ecoinvent unit processes are explicited in the Supplementary Information.
Concerning the infrastructure, a generic dataset is used from ecoin-vent database, i.e. “market for chemical factory, organics” (see Table 3), which encompasses the construction and building of the production site, including the equipment (tanks, spinneret, pumps, etc.). As for utilities (i.e. lightning, temperature control), industrial data on annual con-sumptions has been used.
2.5. Life cycle impact assessment (LCIA
Environmental impacts are calculated using the ReCiPe method, recognized for covering all environmental impacts. It consists of 16 midpoint impact categories (e.g. toxicity, ecotoxicity, climate change, eutrophication, acidification, fossil resource depletion, etc., with impact results expressed in kg equivalent of reference substance) and 17 endpoint impact categories (damages caused by the above mentioned midpoint problems, with impact results expressed in points) grouped in 3 areas of protection: human health, ecosystem quality and resource depletion. ReCiPe endpoint categories can also be aggregated in an endpoint unique score.
IPCC GWP100a is also used for climate change impact evaluation as a standalone method (impact results expressed in kg CO2-equivalent), being a topical subject.
human health (0.19 and 0.29 points respectively). Whereas 39.2%– 45.4% of the impact category score comes from membrane and solvent fabrication, only around 15% is due to polymer fabrication. This group is the least important contributor to 13 of the 17 impact categories; its contribution to the other 4 impact categories (i.e. agricultural and urban land occupation, and terrestrial ecotoxicity and acidification) adds up to less than 1% of the total ReCiPe endpoint score.
These results may be compared with those from Manda et al. [17], which, to the best of our knowledge, is the only other study specifically focused on analyzing environmental impacts of membrane fabrication. Their non-renewable energy use and greenhouse-gas emission scores (to be compared with our GWP100a scores) bring out the following process input contributions, listed by order of importance: electricity, polymer fabrication, solvent fabrication, natural gas and glycerol. Differences in the order of importance with our results can be directly related to dis-crepancies that have been observed when comparing inventories (see
Table 4). The relative importance of polymer and solvent fabrication is for example tied to polymer and solvent mass fractions in the polymer solution. The contribution of solvent fabrication may furthermore have been reduced in Manda et al.‘s [17] work since variable solvent recovery has been considered, whereas it has been knowingly omitted in our study because of industrial practices.
A consequence of these different result representations is that the three main ReCiPe impact categories that emerge in Manda et al.‘s [17] analysis (i.e. freshwater eutrophication, marine ecotoxicity, freshwater ecotoxicity) are amongst the least affected categories in the present study.
The influence of such site specific conditions provides relevance to the process modelling – LCA methodological approach of considering operating conditions (e.g. polymer solution composition) in the study of environmental impacts.
3.3. Impacts for membrane fabrication only
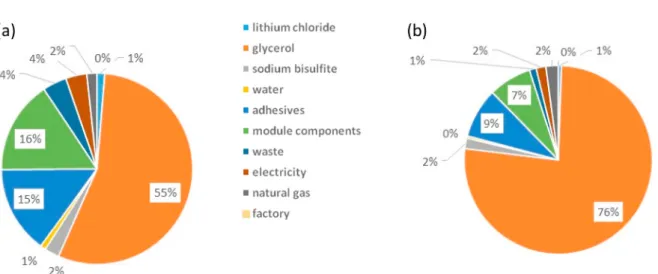
Membrane fabrication being the group with the greatest contribution to environmental impacts in the reference situation, its scores are
disaggregated by cluster in Fig. 8. The impact of glycerol fabrication clearly appears: 55 and 76% of the GWP100a and ReCiPe endpoint scores, respectively. It should be noted that the cluster “glycerol” con-tributes more to environmental impacts than the group “polymer fabrication” and in a similar manner as “solvent fabrication”. For example, glycerol accounts for 49% of the total ReCiPe endpoint score and 25% of the total IPCC GWP100a score, while contributions of sol-vent fabrication equal 25% and 40% respectively. The influence of this pre-conditioning liquid is further discussed in a later section.
Two other important contributors to environmental impacts are adhesives and module components, which have similar contributions to environmental impacts (6–15% and 7–16% respectively, depending on the assessment method). Between 83% and 98% of impacts linked to the “module components” cluster is due to glass fiber fabrication for module housings. This value is in line with the high mass contribution (i.e. 85%) of the chemical to the cluster’s total mass. Regarding the “adhesive” cluster, epoxy resin fabrication accounts for the majority of impacts (56–83%); this chemical contributes 53% of the cluster’s total mass. It should be reminded that the adhesive hardener has been approximated to a generic organic chemical because its corresponding unit process is absent from the ecoinvent database.
The contribution of energy is limited to 4–9% of scores. Specific consumption per m2 of fabricated membrane is 5.23 kWh, 64% of which is provided by electricity and the remaining 36% by natural gas (see Supplementary information for details on each unit process). An explanation for the limited impact of energy and electricity in particular is the French electricity mix used in this study. The membrane fabrica-tion plant is indeed assumed to be located in France. The French elec-tricity mix largely relies on nuclear energy and thereby generates reduced fossil depletion and climate change impacts compared to other countries’ electricity mixes [31]. Other electricity mixes and, more generally, geographic locations of the membrane fabrication plant are studied in a later section.
Category Cluster Process inputs and
outputs Quantity (per m
2
membrane) Ecoinvent v3.4 unit process
Membrane
fabrication Lithium chloride Glycerol Lithium chloride (kg) Glycerol (kg) 0.0151 0.780 Market for lithium chloride [GLO] Market for glycerine [GLO]
Sodium bisulfite Sodium bisulfite (kg) 0.0818 Market for sodium hydrogen sulfite [GLO]
Water Tap water (kg) 117 Tap water production, ultrafiltration treatment [Europe without Switzerland]
Softened water (kg) 26.6 Market for water, completely softened, from decarbonised water at user [GLO]
Adhesives Epoxy resin (kg) 0.127 Market for epoxy resin [GLO] Adhesive hardener (kg) 0.0677 Market for chemical, organic [GLO]
Calcium carbonate (kg) 0.0428 Market for calcium carbonate, precipitated [GLO]
Module
components Glass fiber
1 (kg) 0.255 Market for glass fiber [GLO]
Polyethylene2 (kg) 0.0391 Market for polyethylene, high density, granulate [GLO] Polyvinylchloride3 (kg) 3.64 10−4 Market for polyvinylchloride, bulk polymerised [GLO] Noryl4 (kg) 6.36 10−3 Market for polystyrene, high impact [GLO]
Waste Liquid waste (m3) 0.143 Treatment of wastewater, average, capacity 4.7E10 l/year [CH] Solid waste (kg) 0.287 Treatment of municipal solid waste, incineration [FR]
Electricity Electricity (kWh) 3.35 Market for electricity, medium voltage [FR]
Natural gas Natural gas (m3) 0.166 Market for natural gas, low pressure [RoW]
Factory Factory (unit) 7.02 10−14 Market for chemical factory, organics [GLO]
Solvent fabrication – NMP (kg) 0.588 Market for N-methyl-2-pyrrolidone [GLO]
Polymer fabrication – CTA (kg) 0.151 N/A
N/A non available; 1 for the membrane housing; 2 for the grids and end caps; 3 for the venting plugs; 4 for the flange.
Table 3
3.4. Sensitivity analysis
Following the above attributional life cycle analysis, a sensitivity analysis is conducted to investigate to what extent environmental im-pacts vary according to key parameters. The influence of operating conditions is first explored (see section 3.4.1.). Then, the nature of the pre-conditioning liquid and the production’s geographic location are studied (see sections 3.4.2 and 3.4.3.).
3.4.1. Influence of operating conditions
The underlying purpose of the model is to identify how operating conditions influence environmental impacts. The various conditions considered in this study specifically relate to fiber properties (scenarios A1, A2 and B), energy (scenario C) and glycerol as pre-conditioning liquid (scenario D) (see Table 5). Among these parameters, only those selected in scenarios A1, A2 and B could influence the quality of the obtained membrane. However, their range of variation is chosen to be compatible with industrial practices and for obtaining good quality membranes.
From a technical perspective, the increase in polymer mass fraction in the polymer solution in scenarios A1 and A2 prevents finger initiation during phase inversion due to increased viscosity [32]. Changes in polymer solution viscosity, and density, nonetheless impact on dissi-pated power density during stirring. Scenarios A1 and A2 consider, respectively, a turbulent and laminar flow regime in the stirred vessel (i. e. dissipated power density proportional to polymer solution density and viscosity, respectively). Since the relationship between polymer mass fraction and polymer solution viscosity is unknown, a 10-fold viscosity rise is taken when shifting from 20 wt% to 30 wt% polymer [32]. The dissipated power density varies accordingly.
Whereas LCA scores of scenario A1 are similar to the reference sit-uation, those of scenario A2 are slightly greater (see Fig. 9.): 11.1 kg CO2-eq and 1.93 points compared to 10.6 kg CO2-eq and 1.91 points for IPCC GWP100a and ReCiPe endpoint respectively. In scenario A2, total electricity consumption indeed more than doubles from 3.3 to 7.4 kW m−2 due to high stirring energy demand and 54% more polymer is needed to fabricate 1 m2 of membrane. The associated impacts are not fully offset by the lower solvent and glycerol consumptions (− 11% and − 7% respectively) that stem from lower membrane porosity. Polymer fabrication thereby contributes more significantly to impacts than in the reference situation: 22% and 16% instead of 15% and 11% for IPCC GWP100a and ReCiPe endpoint respectively. Overall, increasing poly-mer mass fraction as an indirect manner to lower glycerol consumption and hence environmental impacts does not provide a conclusive solu-tion. In any case, a sound industrial logic would be to use appropriate stirrers in order to limit avoidable energy overconsumption (e.g. anchor stirrer for fluid viscosity ~102 Pa s [27]).
The spinning speed is another operating condition that may influ-ence the fiber’s final properties; increasing it leads to a greater elonga-tion stress and a closer-packed polymer structure [33]. In scenario B, constant membrane porosity has been assumed regardless of changes in spinning speed. Productivity can furthermore be boosted with varying spinning time required for a given polymer solution batch. Only time-dependent energy consumptions, such as those related to bundling, plant lighting and heat loss compensation during extrusion are
Process inputs
and outputs Manda et al., 2014
a Ecoinventb Percentage change (%) compared to modelled value Comment Percentage change (%) compared to modelled value Comment CTA 29 13.4 wt% PES in polymer solution 38 Input in final module only NMP −33 60.3 wt% NMP in polymer solution – – Glycerol −88 6.9 wt% glycerol in polymer solution – –
Epoxy resin −41 Polyurethane −82 Input in final module only Glass fiber −53 Glass-
reinforced plastic −41 Input in final module only Polyethylene −84 – – – Polyvinylchloride 17,100 – – – Electricity 143 – −97 Generic unit processes of extrusion and injection moulding Natural gas 131 – −96
aInitial inventory in kg m−3 water is converted to kg m−1 membrane with data
from Table 1 [17].
b Unit process “UF module production, hollow fiber” based on a PALL UNA-
620 A module (50 m2).
Fig. 6. Contribution of categorized process inputs and outputs of membrane fabrication process to (a) IPCC GWP100a and (b) ReCiPe endpoint results. Table 4
impacted. As can be shown for scenario B in Fig. 9, environmental im-pacts are completely insensitive to variations in the spinning speed, which can be explained by the minor contribution of energy consump-tions, let alone time-dependent ones, to total environmental scores. This of course holds for a low carbon energy supply.
A similar interpretation can be given for scenario C for which discontinuous and continuous unit operations are considered to operate without any heat loss. Although thermally isolating equipment may be suggested to gain in thermal efficiency, scenario C does not offer any improvements in terms of environmental impacts.
The greatest effect on environmental scores is observed for Scenario D: 9.3 kg CO2-eq and 1.4 points for IPCC GWP100a and ReCiPe
Fig. 7. ReCiPe endpoint score per impact category for 1 m2 membrane.
Fig. 8. Contribution of cluster process inputs and outputs of membrane fabrication only (excluding solvent and polymer fabrication) to (a) IPCC GWP100a and (b)
ReCiPe endpoint results.
Table 5
Scenarios and their operating conditions.
Scenario Operating condition Value
Reference Scenario
A A1 to
A2 Polymer mass fraction (− ) 0.20 0.30
A1 Stirring dissipated power density (kWh
m−3) 15.0 15.6
A2 150
B Spinning speed (m min−1) 20 30
C Thermal transfer efficiency for
discontinuous unit operations (− ) 0.15 1.0 Thermal transfer efficiency for continuous
unit operations (− ) 0.93 1.0
D Glycerol temperature (◦C) 30 60
Glycerol input-output flow ratio (− ) 5.0 2.5
glycerol due to the difference in density. A given unit of mass of the former is also intrinsically less impactful than the latter, from − 42% for IPCC GWP100a to − 94% for ReCiPe endpoint. Interestingly, lower mitigations are achieved in our scenarios when acting on the nature rather on the sourcing of the pre-conditioning liquid. This offers in-dustrial perspectives, whereby the scenario with the least changes gives amongst the greatest mitigation.
3.4.3. Influence of the geographic location
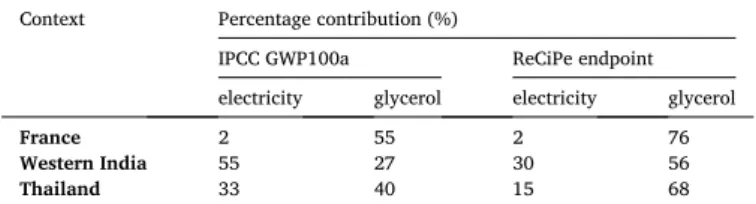
An environmental analysis requires that the geographic context be taken into account, notably as regards transportation of raw materials, production mix of electricity and waste management. Previous results applied to a French context with electricity produced predominantly (75%) with nuclear power. Sensitivity to geographic location is inves-tigated through results of two other contexts whose electricity is pro-duced mainly with the world’s main primary energy source [34]: Western India (82% from hard coal) and Thailand (70% from natural gas). For the former, scores increase by 50% and 26% for IPCC GWP100a and ReCiPe endpoint, respectively, compared to the French context. For the latter, scores increased by 20% and 10%, respectively. The overall increase is clearly attributable to the energy production mix and is highlighted by the contribution percentages. The production of elec-tricity indeed generates impacts in the same order of magnitude as the production of glycerol (see Table 6). Electricity in the French context contributed to only 2% of GWP100a and ReCiPe endpoint scores, whereas contributions rise to 15%–55% in the Asian contexts. It thereby becomes relevant to not only focus on glycerol for environmental miti-gation but also on electricity consumption. For example, in the case of unit operations without any heat loss (i.e. scenario C in section 3.3), impacts avoided in Western India are 5.5 and 2.5 greater for GWP100a and ReCiPe endpoint, respectively, than in France.
4. Conclusion
Accurate decision-making tools are necessary to inform researchers and industrials who wish to fabricate greener membranes;
Fig. 10. Percentage change (%) of impacts of pre-conditioning liquid scenarios compared to the reference situation. Table 6
Percentage contribution (%) of electricity and glycerol to GWP100a and ReCiPe endpoint scores depending on the geographic location.
Context Percentage contribution (%)
IPCC GWP100a ReCiPe endpoint electricity glycerol electricity glycerol
France 2 55 2 76
Western India 55 27 30 56
Thailand 33 40 15 68
endpoint, respectively, which is a 12% and 25% drop compared to the reference situation. In this scenario, it is supposed that temperature has the same effect on the diffusion of glycerol in membrane pores as its input-output flow ratio. Such a configuration requires 50% less glycerol and only 0.1% more electricity than the reference situation. Given the respective contributions of glycerol and electricity to total scores, favourable conditions of the former (i.e. low input-output flow ratio) outweigh by far the unfavourable conditions of the latter (i.e. high temperature); results reveal a high sensitivity to this glycerol-related parameter.
3.4.2. Influence of the pre-conditioning liquid
Pre-conditioning is a pre-requisite for module assembly. A chemical is indeed used to lower the surface tension of the air-liquid interface inside pores and prevent them from collapsing during drying. Hollow fibers are dried for their effective adhesion inside the membrane hous-ing. The nature of the pre-conditioning liquid can vary depending on if it is evaporated (e.g. alcohol, acetone) or remains in pores (e.g. glycerol, isopropanol) during drying. Based on known industrial practices, the latter option has been considered in our reference situation.
The influence of the pre-conditioning liquid is studied through three scenarios: (1) change in glycerol sourcing, (2) substitution of glycerol by isopropanol and (3) removal of pre-conditioning. In scenario 1, glycerol is produced from purified waste cooking oil instead of conventionally from oil seed crops. It is hypothesized that the alternative and conven-tional glycerol have the same technical properties and performances. For scenario 2, model parameters related to the pre-conditioning liquid (i.e. density, specific heat capacity) are adapted to isopropanol. Glycerol is used as bore liquid only. Scenario 3 could be made possible with the use of moisture-insensitive adhesives; its chemical composition is approximated to that of a conventional epoxy-based adhesive. Less intensive drying is required before gluing and pores stay filled with water from rinsing.
As shown in Fig. 10, similar significant environmental mitigations for 1 m2 of fabricated membrane are observed for a change in glycerol sourcing and the removal of pre-conditioning: from − 19% to − 49% depending on the evaluation method. Not only is conventional glycerol the predominant contributor to pre-conditioning but it impacts 21% and 25% more on IPCC GWP100a and ReCiPe endpoint scores, respectively, than alternative glycerol. What clearly differs between scenarios 1 and 3 is the ease of implementation at the industrial scale. The former does not imply any modification of the fabrication process whereas R&D efforts on the use of moisture-insensitive adhesives is necessary for the latter.
Although lower mitigations (− 11% to − 38%) are obtained with glycerol substitution by isopropanol than for the other two scenarios, it can nonetheless be noted that the nature of the pre-conditioning liquid influences on environmental scores. This arises from the fact that 7.8% less isopropanol by mass is needed for pre-conditioning compared to
Acknowledgements
The authors acknowledge the financial support of Universit´e F´ed´erale de Toulouse (PRES) and R´egion Occitanie/Pyr´en´ees- M´editerran´ee, France, and are grateful for the technical expertise of Aquasource (SUEZ). Special thanks to Dr. Philippe Aptel for his valuable comments.
Appendix A. Supplementary data
Supplementary data to this article can be found online at https://doi. org/10.1016/j.memsci.2020.118594.
References
[1] R.W. Baker, Membrane Technology and Applications, third ed., John Wiley & Sons
Ltd., Chichester, 2012, ISBN 9780470743720.
[2] M. Cheryan, Ultrafiltration Handbook, Technomic Publishing Co. Inc., Lancaster,
1986. ISBN: 87762-456-9, 1986.
[3] S. Loeb, Sea water demineralization by means of an osmotic membrane, Adv.
Chem. 38 (1962) 117–132.
[4] H. Strathmann, K. Kock, P. Amar, R.W. Baker, The formation mechanism of
asymmetric membranes, Desalination 16 (1975) 179–203.
[5] Y. Medina-Gonzalez, P. Aimar, J.F. Lahitte, J.C. Remigy, Towards green
membranes: preparation of cellulose acetate ultrafiltration membranes using
methyl lactate as a biosolvent, Int. J. Sust. Eng. 4 (2011) 75–83.
[6] A. Figoli, T. Marino, S. Simone, E. Di Nicol`o, X.M. Li, T. He, S. Tornaghi, E. Drioli,
Towards non-toxic solvents for membrane preparation: a review, Green Chem. 16
(2014) 4034–4059.
[7] F. Pr´ez´elus, D. Chabni, L. Barna, C. Guigui, J.C. Remigy, A metrics-based approach
to preparing sustainable membranes: application to ultrafiltration, Green Chem. 21
(2019) 4457–4469.
[8] A. Moriya, T. Maruyama, Y. Ohmukai, T. Sotani, H. Matsuyama, Preparation of
poly(lactic acid) hollow fiber membranes via phase separation methods, J. Membr.
Sci. 342 (2009) 307–312.
[9] A. Hanafia, C. Faur, A. Deratani, P. Guenoun, H. Garate, D. Quemener, C. Pochat-
Bohatier, D. Bouyer, Fabrication of novel porous membrane from biobased water-
soluble polymer (hydroxypropylcellulose), J. Membr. Sci. 526 (2017) 212–220.
[10] ISO ‒ International Organization for Standardization, ISO 14040:2006
Environmental Management - Life Cycle Assessment - Principles and Framework, 2006.
[11] A. Ahmadi, L. Tiruta-Barna, A Process Modelling-Life Cycle Assessment-
MultiObjective Optimization tool for the eco-design of conventional treatment
processes of potable water, J. Clean. Prod. 100 (2015) 116–125.
[12 ] J. Clavreul, H. Baumeister, T.H. Christensen, A. Damgaard, An environmental assessment system for environmental technologies, Environ. Model. Software 60
(2014) 18–30.
[13] A.B.B. de Faria, A. Ahmadi, L. Tiruta-Barna, M. Sp´erandio, Feasibility of rigorous
multi-objective optimization of wastewater management and treatment plants,
Chem. Eng. Res. Des. 115 (2016) 394–406.
[14] L. Gerber, M. Gassner, F. Mar´echal, Systematic integration of LCA in process
systems design: application to combined fuel and electricity production from
lignocellulosic biomass, Comput. Chem. Eng. 35 (2011) 1265–1280.
[15] P. Loubet, P. Roux, V. Bellon-Maurel, WaLA, a versatile model for the life cycle
assessment of urban water systems: formalism and framework for a modular
approach, Water Res. 88 (2016) 69–82.
[16] Y. Mery, L. Tiruta-Barna, I. Baudin, E. Benetto, E. Igos, Formalization of a technical
procedure for process ecodesign dedicated to drinking water treatment plants,
J. Clean. Prod. 68 (2014) 16–24.
[17] B.K. Manda, E. Worrell, M.K. Patel, Innovative membrane filtration system for
micropollutant removal from drinking water–prospective environmental LCA and
its integration in business decisions, J. Clean. Prod. 72 (2014) 153–166.
[18] N. Tangsubkul, K. Parameshwaran, S. Lundie, A.G. Fane, T.D. Waite,
Environmental life cycle assessment of the microfiltration process, J. Membr. Sci.
284 (2006) 214–226.
[19] E. Friedrich, Life-cycle assessment as an environmental management tool in the
production of potable water, Water Sci. Technol. 46 (2002) 29–36.
[20] F. Vince, E. Aoustin, P. Br´eant, F. Marechal, LCA tool for the environmental
evaluation of potable water production, Desalination 220 (2008) 37–56.
[21] M. Beery, A. Hortop, G. Wozny, F. Knops, J.U. Repke, Carbon footprint of seawater
reverse osmosis desalination pre-treatment: initial results from a new
computational tool, Desalination Water Treat 31 (2012) 164–171.
[22] N.T. Hancock, N.D. Black, T.Y. Cath, A comparative life cycle assessment of hybrid
osmotic dilution desalination and established seawater desalination and
wastewater reclamation processes, Water Res. 46 (2012) 1145–1154.
[23] K. Tarnacki, M. Meneses, T. Melin, J. Van Medevoort, A. Jansen, Environmental
assessment of desalination processes: reverse osmosis and Memstill®, Desalination
296 (2012) 69–80.
[24] A. Bonton, C. Bouchard, B. Barbeau, S. Jedrzejak, Comparative life cycle
assessment of water treatment plants, Desalination 284 (2012) 42–54.
[25] W.K. Biswas, Life cycle assessment of seawater desalinization in Western Australia,
Eng. Technol. 56 (2009) 8.
environmental hotspots first need to be identified to be acted upon and implemented improvements are to be assessed from an environmental point of view. The methodological novelty put forth in this study is relevant to address these issues. Process modelling has been coupled with LCA and the resulting model provides hands-on information not only on contributions of input raw materials and energy but also on the influence of operating conditions related to UF hollow fibers prepared by NIPS.
This generic model may be applied to membrane materials other than cellulose acetate, albeit with a few adjustments. In particular, input raw materials (i.e. polymer, solvent, additive, adhesive) and their related parameters would need to be adapted to the membrane material. If necessary, the modular configuration of the model allows to modify, add or delete separate unit operations with ease. Hence, the model can be made to fit similar fabrication processes of other membrane manu-facturers, or even processes based on temperature-induced phase sepa-ration (TIPS). For the latter, the coagulation bath in the model can be assimilated to a TIPS quenching bath. In any case, the model remains valid for hollow fibers. Expanding it to other geometries, in particular flat membranes, would require important transformations of unit op-erations related to the extrusion, spinning chain and module fabrication process.
In the framework of the studied membrane, NMP and glycerol, used as a solvent and pre-conditioning liquid respectively, have been iden-tified as major contributors to environmental impacts. At a process- level, glycerol-related parameters are valuable levers for environ-mental mitigation. Impacts, and resulting adjustment parameters, moreover depend on the geographic context of membrane preparation, in particular on the electricity production mix. Energy-related parame-ters consequently gain in relevancy for membrane preparation in countries with carbon-based energy.
The technical and economic feasibility of improvement strategies derived from the model are two other criteria to be considered for a full eco-design approach of membrane preparation. Strong technical con-straints for example exist on certain operating conditions, in particular those related to phase inversion and thus on the final properties of hollow fibers. Mechanistic and predictive relations between operating conditions and fiber filtration properties are hardly conceivable, and experimental data is thus necessary to link these parameters together. Such technical feasibility studies would allow to specifically address the main limitation of this study, namely the systematic adequacy of membrane selectivity and permeability regardless of applied operating conditions.
Such a methodology should be taken into account by scientists who want to elaborate “green membranes” to tackle true environmental problems. This methodology must be coupled with membrane use and end-of-life to tackle the overall impact. Ultimately, the actual filtration stage and end-of-life of membranes are to be evaluated with a similar approach.
CRediT authorship contribution statement
Flavie Pr´ez´elus: Methodology, Investigation, Formal analysis, Conceptualization, Writing - original draft, Visualization, Writing - re-view & editing. Ligia Tiruta-Barna: Conceptualization, Formal anal-ysis, Validation, Supervision, Funding acquisition, Writing - review & editing. Christelle Guigui: Conceptualization, Formal analysis, Vali-dation, Supervision, Funding acquisition, Writing - review & editing. Jean-Christophe Remigy: Conceptualization, Formal analysis, Vali-dation, Supervision, Funding acquisition, Writing - review & editing. Declaration of competing interest
The authors declare that they have no known competing financial interests or personal relationships that could have appeared to influence the work reported in this paper.
[26] R.G. Raluy, L. Serra, J. Uche, Life cycle assessment of water production technologies Part 1: life cycle assessment of different commercial desalination
technologies (MSF, MED, RO), Int. J. Life Cycle Assess. 10 (2005) 285–293.
[27] S.M. Kresta, A.W. Etchells III, D.S. Dickey, V.A. Atiemo-Obeng, Advances in
Industrial Mixing: a Companion to the Handbook of Industrial Mixing, John Wiley
& Sons, Hoboken, 2015, ISBN 978-0-470-52382-7.
[28] J. Brandrup, E.H. Immergut, E.A. Grulke, A. Abe, D.R. Bloch, Polymer Handbook,
vol. 89, Wiley, New York, 1999, ISBN 978-0-471-16628-3.
[29] F.P. Incropera, A.S. Lavine, T.L. Bergman, D.P. DeWitt, Fundamentals of Heat and
Mass Transfer, John Wiley & Sons, Hoboken, 2007. ISBN: 10471457280.
[30] B. Nesbitt, Handbook of Pumps and Pumping, Elsevier, Oxford, 2006, ISBN 978-1-
85617-476-3.
[31] Ecoinvent v3.4. https://www.ecoinvent.org accessed 7 January 2020.
[32] I. Cabasso, E. Klein, J.K. Smith, Polysulfone hollow fibers. I. Spinning and
properties, J. Appl. Polym. Sci. 20 (1976) 2377–2394.
[33] K.Y. Wang, T. Matsuura, T.S. Chung, W.F. Guo, The effects of flow angle and shear
rate within the spinneret on the separation performance of poly(ethersulfone)(PES)
ultrafiltration hollow fiber membranes, J. Membr. Sci. 240 (2004) 67–79.
[34] IEA ‒ International Energy Agency. https://www.iea.org/, 2019 accessed 7 January 2020.
![Table 3 to other inventories in the literature. Furthermore, Beery et al.‘s [ 21 ] work is based on industrial fabrication data of material and energy inputs but figures are unfortunately not made available in the published version](https://thumb-eu.123doks.com/thumbv2/123doknet/2937880.78795/7.892.56.432.969.1111/inventories-literature-furthermore-industrial-fabrication-unfortunately-available-published.webp)