Coordination, Common Knowledge and an H1N1 Outbreak
45
0
0
Texte intégral
(2) CIRANO Le CIRANO est un organisme sans but lucratif constitué en vertu de la Loi des compagnies du Québec. Le financement de son infrastructure et de ses activités de recherche provient des cotisations de ses organisations-membres, d’une subvention d’infrastructure du Ministère du Développement économique et régional et de la Recherche, de même que des subventions et mandats obtenus par ses équipes de recherche. CIRANO is a private non-profit organization incorporated under the Québec Companies Act. Its infrastructure and research activities are funded through fees paid by member organizations, an infrastructure grant from the Ministère du Développement économique et régional et de la Recherche, and grants and research mandates obtained by its research teams. Les partenaires du CIRANO Partenaire majeur Ministère de l'Enseignement supérieur, de la Recherche, de la Science et de la Technologie Partenaires corporatifs Autorité des marchés financiers Banque de développement du Canada Banque du Canada Banque Laurentienne du Canada Banque Nationale du Canada Banque Scotia Bell Canada BMO Groupe financier Caisse de dépôt et placement du Québec École de technologie supérieure (ÉTS) Fédération des caisses Desjardins du Québec Financière Sun Life, Québec Gaz Métro Hydro-Québec Industrie Canada Institut national de la recherche scientifique (INRS) Investissements PSP Ministère des Finances et de l’Économie Power Corporation du Canada Rio Tinto Alcan State Street Global Advisors Transat A.T. Ville de Montréal Partenaires universitaires École Polytechnique de Montréal HEC Montréal McGill University Université Concordia Université de Montréal Université de Sherbrooke Université du Québec Université du Québec à Montréal Université Laval Le CIRANO collabore avec de nombreux centres et chaires de recherche universitaires dont on peut consulter la liste sur son site web. Les cahiers de la série scientifique (CS) visent à rendre accessibles des résultats de recherche effectuée au CIRANO afin de susciter échanges et commentaires. Ces cahiers sont écrits dans le style des publications scientifiques. Les idées et les opinions émises sont sous l’unique responsabilité des auteurs et ne représentent pas nécessairement les positions du CIRANO ou de ses partenaires. This paper presents research carried out at CIRANO and aims at encouraging discussion and comment. The observations and viewpoints expressed are the sole responsibility of the authors. They do not necessarily represent positions of CIRANO or its partners.. ISSN 1198-8177. Partenaire financier.
(3) Coordination, Common Knowledge and an H1N1 Outbreak* Jim Engle-Warnick†, Sonia Laszlo‡, Natalia Mishagina§, Erin Strumpf. **. Résumé / Abstract Nous mesurons de façon expérimentale l’aptitude de sujets à coordonner sur des questions portant sur la grippe H1N1 avant et après une éruption majeure du virus. Notre instrument consiste en une enquête H1N1 convertie en jeu de coordination. Nous montrons une augmentation, suite à l’éruption, du degré de coordination dans les croyances portant sur (1) la prévention du H1N1, (2) les effets secondaires du vaccin H1N1 et (3) les actions à prendre en cas de maladie. De façon plus générale, notre étude est la première à présenter un test de coordination sur des étiquettes stratégiques en réaction à un système de coordination présent naturellement. Nos résultats permettent de mieux comprendre les croyances en réponse à un choc majeur à la santé. Mots clés : Jeu de coordination, croyances communes, économie expérimentale, H1N1.. We experimentally measure the ability of subjects to coordinate on issues related to the H1N1 influenza virus before and after an outbreak. Our instrument consists of an H1N1 survey converted into a coordination game. We show that the degree of coordination on beliefs about (1) H1N1 prevention, (2) H1N1 vaccine side effects, and (3) actions to take if sick all increase after the outbreak. More generally we provide the first test of coordination on meaningful strategy labels in response to a naturally occurring field coordination device. Our results provide a unique insight into the responses of beliefs to a major health event. Keywords: Coordination game, Salience, focal point, common beliefs, experimental economics, H1N1.. *. We thank Juan Robledo for research assistance and participants at Dalhousie University for valuable comments. We acknowledge The Centre for Interuniversity Research and Analysis on Organizations and the Social Science and Humanities Research Council for funding. † McGill University and CIRANO, jim.engle-warnick@mcgill.ca ‡ McGill University and CIRANO. § CIRANO. ** McGill University and CIRANO..
(4) 1. Introduction. Social norms are rules of behavior that coordinate interactions between people (Young, 2007). Social norms increase efficiency, largely by reducing transaction costs when the structure of the decision-making environment contains multiple equilibria. Once a rule is established it becomes self-reinforcing from the expectation people form that others will follow it. It is safe to say that social norms underlie the majority of social interactions (Ostrom, 2005; Sugden, 1986; Young, 1998). How societies settle on a particular equilibrium through a norm is an important question because of the efficiencies that can be gained with a good social norm or lost with a bad one. Young (2007), for example, identifies top-down, bottom-up, and lateral influences on the evolution of societal norms and lists examples of each. Theory explaining the evolution of norms involves learning dynamics (Young, 1993), and typical examples of societal norms involve a description of the history or the evolution of societal rules. Underlying a norm is the formation of common beliefs that facilitate coordination. Typical non-laboratory observation of coordination tends to be indirect.1 One can infer that coordination exists given institutional features that are consistent with the formation of common beliefs. One of the best examples is the well-known television ad campaign for Listerine mouthwash (the “halitosis” ads). Watching a person become aware of her halitosis (bad breath) problem on television makes the viewer aware of his/her own halitosis. The common viewing of the television ad provides the common belief across viewers of the existence of the problem (and its solution) resulting in the coordinated use of the mouthwash. Chwe (2000) provides many fascinating examples of institutional details that tend to facilitate similar transmission of common beliefs. However, the direct measure of how common beliefs 1. There are a wealth of experimental results that show that in general, depending on the payoff structure of the game, as a coordination device communication and timing can be effective. Some early examples include, e.g., Cooper, Dejong, Forsythe and Ross (1990,1994) and Rappaport (1997). Ochs (1995) and Crawford (1997) provide surveys of coordination in the laboratory..
(5) change or evolve in specific response to a coordination device is rare, if existing. Measuring responses of common beliefs to an actual coordination device would take a step further in understanding norms and coordination. An opportunity to observe a reallife event that affects common beliefs, combined with an instrument to measure the degree to which common beliefs are affected by the event, would advance our knowledge of how coordination is achieved. In effect, it would identify a mechanism through which coordination is established. Such an exercise is difficult because measuring common beliefs cannot be done with standard surveys. The instrument required for measuring common beliefs, an incentivized coordination game, exists in the experimental laboratory. The real-life event we exploit in this paper is an outbreak of the H1N1 influenza virus in a large metropolitan area. The common beliefs we measure are beliefs about preventing contraction of the virus, the H1N1 vaccine, and actions to take after contracting the virus, all deemed important for public health. Our experimental design is simple: we ask subjects in an experimental laboratory to coordinate their responses to a survey before and after a major outbreak of the virus. That is, we simply turn a survey into a coordination game. Our goal is to measure the responses of commonly held beliefs to information transmitted through the outbreak. That is, our goal is to measure the responses of beliefs to a coordination device. How does turning a survey into a coordination game measure common beliefs? If strategies in a coordination game have meaningful labels, then the saliency of the labels can act as a focal point, which provides a mechanism to form a common belief required for coordination (Schelling, 1960). In our experiment, we pose a question about the H1N1 virus and give five possible responses, while providing an incentive for the subjects to match their selected response. Thus, each of the five possible responses is a strategy with a label that has some bearing on knowledge about the virus. We measure the extent to which these labels are focal. Bacharach and Berlesconi (1997) define a label to be focal based on its attributes and. 2.
(6) on the chances that others will recognize these attributes. In a multiple-choice survey, for example, response options may have the attributes of being correct or incorrect. Response options may have many attributes, such as silly, irrelevant, or surprising. Some of the attributes may be known to the respondents but not to the researchers. The point is that strategy labels have attributes, attributes lead to focality, focality leads to coordination, and coordination can lead to efficiencies, particularly in a social matter of public health. Our coordination game with labels, combined with the coordination device of an outbreak, will allow us to learn more about how coordination occurs. In this paper we measure the degree to which information and experience associated with the 2009 outbreak of the H1N1 influenza virus (the swine flu) acted as a coordination device for preferences, beliefs, and strategies with regard to contracting the virus and preventing the illness. We first provided a group of subjects with an H1N1 questionnaire, asking them for all of the answers to the questions they could think of. Using these responses to generate coordination games, we then provided a second group of subjects with the H1N1 questionnaire before and after a major outbreak in a large metropolitan area. Subjects were given the incentive to match their responses to the survey with the responses of other subjects without communication. We analyze responses to the questions (1) what can people do to prevent the flu, (2) what are the side effects of the vaccine, and (3) what measures would they take if they experienced flu-like systems. Subjects were paid only if their responses were identical to those of another, randomly selected subject in the study. This mind-reading exercise provided the incentive to form common beliefs and provided us with a laboratory instrument that directly measured the response of coordination to a naturally occurring coordination device within the framework of an important public health issue. We show that subjects were better able to form common beliefs post-outbreak with regard to preventing contracting the virus. We identify attributes in the strategy labels, and. 3.
(7) show that coordination increases and decreases in sensible and important ways. With regard to prevention, subjects increasingly coordinated on getting vaccinated. This is surprising, as health authorities concentrated on simpler measures such as washing hands and using hand sanitizer. With regard to the vaccine side effects, subjects increasingly coordinated on correct responses rather than incorrect responses or “I don’t know”. Moreover, coordination on “I don’t know” reduced more than coordination on incorrect responses. With regard to measures to take after contracting the flu, subjects increasingly coordinated on measures that provide public benefits, moving out of measures that primarily benefit only the individual. Thus, subjects were switching from coordinating on a private good to a public good, precisely matching the goals of the public health campaigns. Our study is important because it measures the degree to which an affected population responds to both experience and public announcements on a matter of significant importance to public health. The outbreak itself was significant: it resulted in pleas by the public health authorities for infected people to stay away from work, school, and emergency rooms, and triggered blanket amnesty from local universities for missing scheduled exams. Many public health announcements had the flavor of an attempt to create common beliefs about the virus: information was transmitted on television and radio, and posted on public bulletin boards, including the Internet. These are all places where a person would know that others would see the identical posted information. Our study is unique because it measures the degree to which people become more or less coordinated after being exposed to a social coordinating device. While much has been written on the apparent effectiveness of different exogenously given devices (e.g., the halitosis campaign of Listerine or the role of social media in the Arab Spring), directly measuring the effect on the common beliefs of the target audience is rare, if existing. In the following sections, we detail the experimental design and procedures, followed by the experimental results and conclusions.. 4.
(8) 2. Experimental Design. Formally, we design a matching game with strategies that are meaningfully labeled to test for common beliefs on H1N1. Designing the game requires first identifying the strategies in the game. Once identified, the game is simply a matching game where both players earn the same utility for any match. We take the position that as observers to this process we do not know the strategies that exist in this game, but the subjects do. The first phase of the experiment, therefore, is an elicitation of the menu of strategies from a group of subjects in the experimental laboratory (further referred to as “menu elicitation phase”). The second phase is the use of the elicited labels to generate the coordination games and to observe the behavior that results (further referred to as “coordination phase”).. 2.1. Menu Elicitation Phase. We design the coordination games by treating the strategy labels as unknown to the researcher but known to the subjects. We thus presented a group of subjects with 18 survey questions about the H1N1 virus and asked them to freely respond to each question with as many answers as they could think of. We adapted the May 2009 Questionnaire from the Harvard School of Public Health’s Harvard Opinion Research Program to elicit the labels.2 The survey elicits beliefs, strategies, and knowledge about a wide variety of topics related to H1N1. All 18 questions in our survey are listed in Appendix A. We elicited rather than imposed the menu of strategies so that we could observe behavior in as realistic a game situation as possible. We report here on three questions for which we can objectively identify attributes in the strategy labels. These attributes are either objective (such as correct or incorrect) or taken from the categories of responses assigned in the original survey (SteelFisher et al., 2010) or 2. http://www.hsph.harvard.edu/horp/files/2012/09/topline_-_public_views_of_h1n1_ii.pdf Last accessed March 6, 2013.. 5.
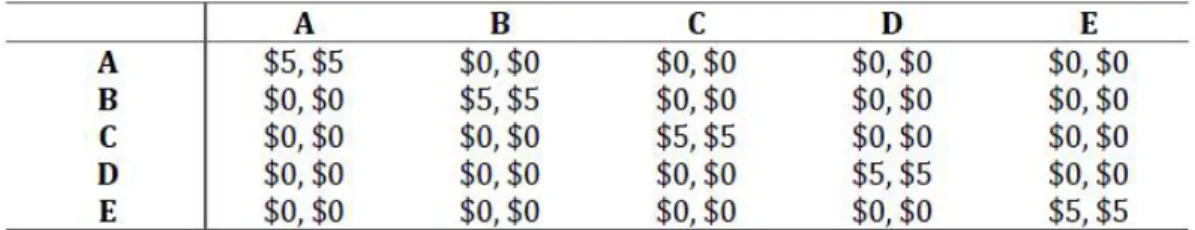
(9) from information provided by public health authorities. Specifically, we report responses for the three questions listed in Table 1. Question 1 asks what measures people can take to avoid contracting the virus (further referred to as “prevention methods”). Question 2 asks to list the side effects of the vaccine (further referred to as “side effects”).3 Finally, Question 3 asks what the person would do if developing flu-like symptoms, i.e., in the face of the possibility of having contracted the virus (further referred to as “actions if sick”). These topics are all covered in one way or another, for example, by publications of the Public Health Agency of Canada (PHAC), where we use the Canadian public health source because the experiments were run in Canada.4 Appendix B presents the Flu Prevention Checklist, which is relevant to all three of these questions.. 2.2. Coordination Phase. We used the menu of strategy labels elicited from the survey responses to construct the coordination games. For each survey question, we constructed 15 multiple-choice questions with five alternatives. The overall design thus consists of 270 two-player one-shot symmetrical matching games, i.e., coordination games in which all equilibria have the same payoffs for each player. The three questions we focus on here comprise a total of 45 coordination games embedded randomly within the 270 game total. Every game has five strategies for each player. Each alternative in the multiple-choice question was randomly drawn from the database of responses elicited during the menu elicitation phase. Each multiple-choice question is properly thought of as an instance of a coordination game. Figure 1 presents an actual example of a single coordination game in the study. In the game there is a row and a column player. The context of the game is the question, “What 3. The arrival of the H1N1 vaccine was widely met with fear. See for instance a New York Times oped “Nothing to fear but the flu itself” published on October 11, 2009, during the peak of the epidemic. http://www.nytimes.com/2009/10/12/opinion/12offit.html?_r=0 4 This is not limited to Canada: the US Centers for Disease Control and Prevention present similar information on the H1N1-related webpage (http://www.cdc.gov/h1n1flu).. 6.
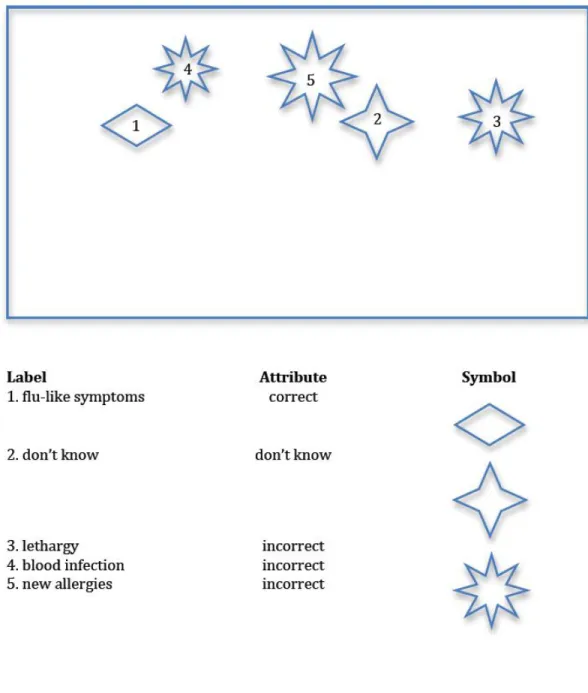
(10) side effect could a vaccine for H1N1 or ‘swine flu’ have on someone’s health?” The strategies available to the players in Figure 1 are shown below the game matrix. The strategies, denoted A-E, are the following: A: “flu-like symptoms”; B: “don’t know”; C: “lethargy”; D: “blood infection”; E: “new allergies”. Notice that in a typical coordination game, the labels A-E would suffice to describe the game, and nothing about the strategy labels would suggest coordinating on any particular one of them. There would be five pure-strategy equilibria: {A,A}, {B,B}, {C,C}, {D,D}, and {E,E}, with nothing to say regarding equilibrium selection. However, in this game, the detailed labels should, in many cases, enhance coordination through their relative saliency. This is made clear through the attribute-subtlety trade-off notion of Bacharach and Bernasconi (1997). In their definition of focality, labels have attributes, and attributes have probabilities of being noticed, called subtlety. For this example, we suggest three attributes the labels in Figure 1 may carry: 1) correct response, 2) don’t know, and 3) incorrect response. Strategies are likely to have other unobserved attributes, i.e., attributes are likely to be multi-dimensional; however, our chosen attributes are obvious and important as health issues. In Figure 1, for example, label A is a correct response; label B, “don’t know”, is a response in a category of its own. Labels C, D, and E are incorrect responses under a reasonable interpretation. Figure 2 illustrates the concept symbolically, representing the five strategies as symbols. In the bottom of the figure, a horizontal diamond is assigned to the correct response; a star is assigned to the response “I don’t know”; and a sunburst is assigned to each of the three incorrect responses. The diagram in the top-half of the figure represents the coordination game itself, with the subjects’ task to choose one of the five figures for coordination. Notice that each of the three sunbursts, for strategies 3, 4, and 5, are of slightly different size. These different sizes depict attribute subtlety, where subjects, if they notice the difference in sizes and believe that others will as well, may gain additional. 7.
(11) information for coordinating. This roughly represents the notion that subjects may be more likely to notice that one response is correct rather than another. Thus, subjects, when confronted with this coordination game, can use the content of the strategy labels to classify responses, and those classifications assist in coordination. If subjects believe that the other subjects are doing the same thing, then we can measure the ability of the labels to act as coordination devices. Note that subjects could assign different rules for selecting a symbol for coordination. Subjects could adopt a rule to always choose a correct response; another rule could be to choose the oddest or most unique response; still another rule could be to never choose an incorrect response. Given meaningful labels, how does coordination occur, i.e., where do decision rules come from? Theories of coordination include cognitive hierarchy (Bacharach and Stahl, 2000) and team reasoning (Sugden, 1995). Under cognitive hierarchy, players reason to different levels giving them the ability to form common beliefs to different degrees. Under team reasoning, players essentially make decision that answer the question “What should we do?” when trying to form common beliefs. While this paper does not distinguish between these two theories, Bardsley, Mehta, Starmer, and Sugden (2010) provide a laboratory test to distinguish between them. Mehta, Starmer, and Sugden (1992) provide the classic laboratory test for label salience.. 2.3. Experimental Design Overview. In summary, subjects play the coordination game both pre- and post-outbreak of the virus. The labels, unknown to the researcher, are elicited from the subjects. The label attributes, also unknown to the researcher, are taken as given. Since the attributes are unknown, individual coordination games are not designed to test any specific hypothesis of behavior. Rather, the games are randomly generated from the database of responses so that we can infer the existence of commonly known attributes from the data. We thus measure the 8.
(12) coordinating effect of the strategy labels before and after the information transmitting effect of the outbreak. Eighteen survey questions with 15 multiple-choice questions each resulted in 270 total multiple-choice questions about H1N1 issues. Each multiple-choice question is an instance of a coordination game. Each coordination game consists of five strategies; each strategy has a label. The change in the distribution of responses in a coordination game, caused by the change in saliency of the strategy labels post-outbreak, is our primary variable of interest in the experiment. A complete listing of the coordination games we analyze in this paper is given in Appendix C.. 3. Experimental Procedures. 3.1. Strategy Menu Elicitation and Coordination Game Design. The subjects were presented with the survey, and told that their responses would be used in a task in a future experiment. They were not informed as to what that task would be. Subjects were paid a flat fee of $10 for showing up (standard at our off-campus experimental laboratory) and $20 for completing the survey. Forty-one subjects in total reported to the experimental laboratory in two sessions to answer the survey questions as free responses. We encouraged the subjects to write down as many responses to each question as they could think of. The result of the menu elicitation phase was a database of possible responses to each survey question. We collected combined individual responses that were worded very closely with obviously identical meanings, but otherwise kept every single response, right or wrong, in the database.. 9.
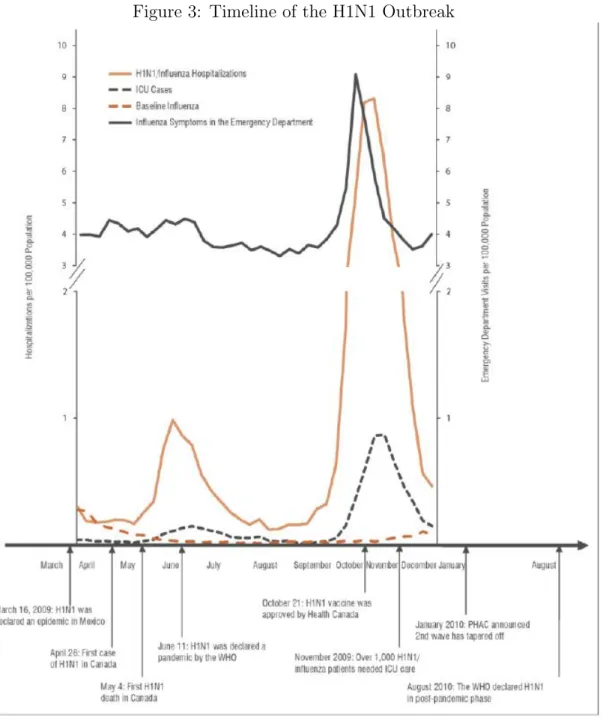
(13) 3.2. Coordination Game. A different set of subjects reported to the experimental laboratory to play a coordination game using the multiple-choice questions fashioned from the menu elicitation phase. Five responses were selected for each game by choosing randomly without replacement from the elicited menu of responses. Specifically, for each experimental session, subjects answered a randomly chosen 60 out of the 270 coordination games on H1N1. Responses to 10 games were then randomly selected for each subject, and subjects were compensated $5 for each response that exactly matched the response of another randomly chosen and anonymous subject in the room. A computer presented each game from the coordination game database in random order, and the subjects entered their responses into the computer interface. One group of subjects was recruited in September, 2009, just before the second and most pronounced outbreak of H1N1. In January, 2010, after the outbreak, those same subjects were recalled but were not informed that they would participate in the same type of experiment at the time of recruiting. Figure 3 shows the timeline of the outbreak in our area, and confirms that our sessions occurred just before and after the outbreak. Onehundred ninety-eight subjects participated in the first sessions, earning an average of $27.60 (including a laboratory-standard $10 show-up fee), and 122 subjects returned for the second session earning an average of $28.69. Subjects did not respond to the same set of coordination games they saw pre-outbreak. To prevent subjects from using history as a coordination device, we chose to randomly assign the coordination games to each subject again the second time to break up any possible attempt at a repeated-game coordination strategy (see Van Huyck, Wildenthal, and Battalio (2002), and Crawford and Haller (1990) for laboratory studies of history as a coordination device). A second method we used to break up coordination on game history was the fact that we analyze results from 45 games embedded within a total of 270 games making the games of interest impossible to identify from the point of view of the subjects. Subjects also responded 10.
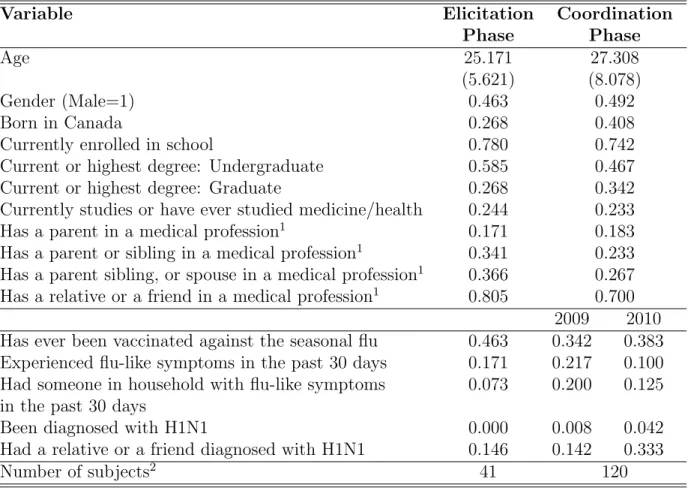
(14) to a brief socio-economic survey, which also included questions about their knowledge of and history with medical information and exposure to the virus. A summary of responses to this survey is given in Table 2. The table is divided between subjects who participated in menu elicitation phase (left column) and coordination phase (right column) of the experiment. The table reports the average age, gender, schooling, ways of acquiring personal knowledge about health issues, and personal experience with H1N1. On average, subjects in the menu elicitation phase were 25 years old, and 46% of them were men. About a quarter of subjects (24.4%) have ever studied medicine or health, and about 80% of them had a family member or a friend employed in a medical profession. At the time of the survey, no subjects had been diagnosed with H1N1 and about 15% had a friend or relative diagnosed with the disease. Finally, about half of them (46%) reported having ever been vaccinated against seasonal flu. Out of 122 subjects in coordination phase, two subjects were excluded due to their refusal to fill out the socio-economic survey in 2010. Among the remaining subjects, the average age was 27 years old, and about a quarter of subjects has ever studied medicine. Almost no one reported being diagnosed with H1N1 in 2009 (one subject), and 34% reported having ever been vaccinated against seasonal flu as of 2009.5 There were no statistically significant differences between subjects who did not return in 2010 and those who did (not shown in the table). Note that we did not run a treatment in which subjects simply chose their responses in the absence of a coordinating incentive. In this paper we assume that subjects respond to the coordination incentive. Our intent here is not to prove that the distribution of responses collapses under the coordination incentive, as this has already been shown numerous times (e.g., Mehta, Starmer, and Sugden (1994), Bardsly, Mehta, Starmer, and Sugden (2010), and Engle-Warnick and Soroka (2009)). Our intent is to measure the change in distribution of 5. The national vaccination rate in 2010 for the age group similar to that of our participants (i.e., 20-44 years old) was recorded to be 32.2% (Gilmour and Hoffman, 2010).. 11.
(15) responses, under the coordination incentive, before and after being exposed to a naturally occurring coordination device.. 3.3. Predictions. Recall that all coordination game labels were elicited from subjects in menu elicitation phase and then randomly assigned to the coordination games. This should allow the change in coordination to occur without bias from the experimental design. Base Conjecture. Changes in label saliency induce responses to become more coordinated when information is provided as common knowledge with the intent to focus behavior on a particular response. Each of our three questions was addressed with information provided as common knowledge at the time of the outbreak. Each question is unique with regard to a specific behavioral prediction. Question 1 (Prevention Methods) Conjecture. Prevention was a major component of information transmission strategies by the government. Responses should become more coordinated on labels consistent with prevention information provided by health authorities. Question 2 (Vaccine Side Effects) Conjecture. There was a wide variance in knowledge regarding the true expected side effects of the vaccine and a public campaign to reduce this variance. Responses should become more coordinated on correct labels. Question 3 (Actions if Sick) Conjecture. Prevention of the spread of the virus was still a major component of the information that was transmitted to the public regarding what actions to take upon catching the H1N1 virus. Responses should become more coordinated on actions that would enhance preventing the spread of the virus.. 12.
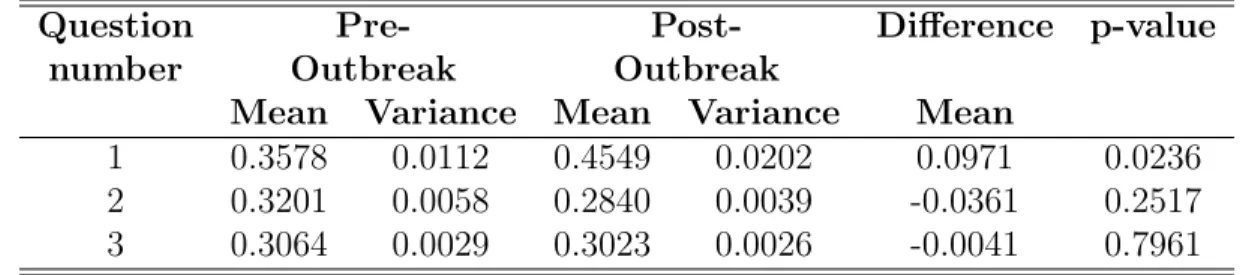
(16) 3.4. Index of Coordination. How well did the subjects coordinate on their responses? To answer this question, we compute the index of coordination for each game. Following Bardsley et al. (2010), let the set L = {l1 , l2 , ..., l5 } be the strategy labels in our coordination games, and let N be the number of subjects who played the coordination game. Let mj be the number of subjects who choose label lj . The coordination index is P c=. mj (mj − 1) N (N − 1). j. (1). Equation (1) is a measure of the chance that two subjects, chosen at random without replacement from the pool of subjects who played the coordination game, chose the same label. The index is increasing in coordination. The coordination index is comprised of j components, each of which is given by cj =. mj (mj − 1) N (N − 1). (2). Equation (2) is a measure of the chance that two subjects, chosen at random without replacement, chose label j. Equation (1) thus sums the chances of a match over all labels. Both equations (1) and (2) are applied to individual games. We will use equation (1) to measure overall coordination in the coordination games, and we will use equation (2) to detect changes in coordination on individual labels within a particular coordination game.. 4 4.1. Experimental Results Coordination Indices by Label. Table 3 presents the indices of coordination for each of the three questions in the study, computed for each strategy label. For each question we compute 15 indices of coordination, one for each coordination game. We report the average of the 15 indices. For example, 13.
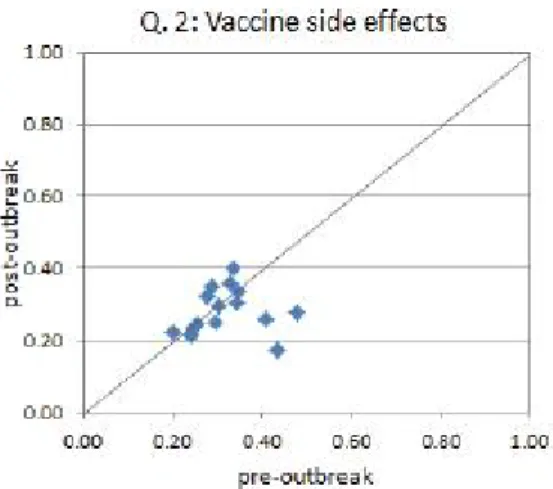
(17) the table shows that in Question 1 (prevention methods), the average coordination index increased from 0.36 to 0.45, which a robust rank order test reports to be significant at the 5% level. Questions 2 (side effects) and 3 (actions if sick) do not show significant differences in coordination indices: their average indices move from 0.32 to 0.28 and from 0.31 to 0.30, respectively. Figure 4 presents coordination indices for all 15 games by question on a scatter plot. The horizontal axis represents the coordination index pre-outbreak, and the vertical axis is for post-outbreak coordination index. The 45-degree line represents no-change from pre- to post-outbreak. There are 15 marks on the figure, one per coordination game. These figures show the exact distribution of coordination indices pre-and post-outbreak. Question 1 (Prevention Methods): Increased Coordination The upper-left panel of Figure 4 shows that for Question 1 (prevention methods), there are 11 instances of increases in the index, one instance of no change, and three instances of a decrease in the coordination index. Furthermore, if one restricts attention to the games in which the change is at least 0.10 in absolute value (recall that the interpretation here is that when randomly selecting two responses from the data, the chances of a match increase by 10%), seven responses increase by this amount. A robust rank order test (Table 2) confirms this at the 5% level. Question 2 (Side Effects): Decreased Coordination Question 2 (vaccine side effects) in the upper-right panel of Figure 4 exhibits the largest gameby-game decrease in coordination post-outbreak. Ten games decreased in coordination rates, while five increased. The magnitude of change in coordination of at least 10% occurred in three games; in fact, all three decreased by at least 15%. While the point estimate suggests that coordination decreases, a robust rank order test (Table 2) does not find statistical. 14.
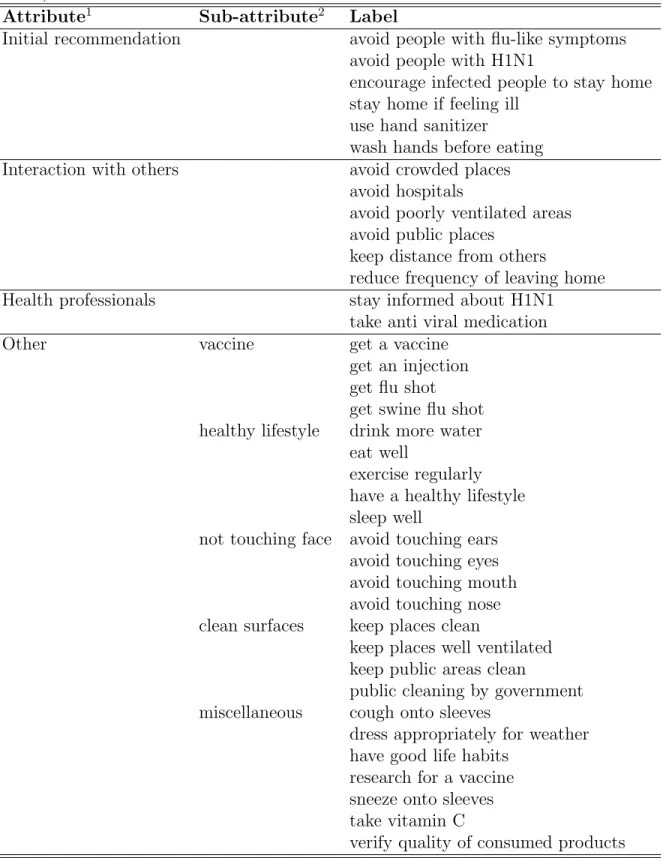
(18) significance of this result. Question 3 (Actions if Sick): Unchanged Coordination Question 3, which asks what subjects would do if they contract the flu, exhibits no change in coordination one way or the other post-outbreak. The lower panel of Figure 4 reveals that eight games showed an increase in coordination rates, whereas seven showed a decrease. Exactly two of the 15 coordination games had a change in the index of at least 0.10 in absolute value. A robust rank order test (Table 2) does not reject the null hypothesis that the median coordination index changes from pre- to post-outbreak.. 4.2. Attributes of the Strategy Labels. The aggregate coordination indices applied directly to the labels in the game imply that coordination increased on the question of preventative measures, but not vaccine side effects or actions upon contracting the virus. However, we have yet to identify attributes of the labels to get further insight into coordination pre- and post-outbreak. Table 4 summarizes the label attributes for all three questions. Question 1 (Prevention Methods) Prevention of the flu, the topic of Question 1, is a main topic in public health and carries with it specific relevant attributes with regard to measures that can be taken. For Question 1 we apply the response categories from SteelFisher et al (2010), which were behind the logic and intent of the original health survey from which we designed our coordination games. These categories (i.e., attributes) are: (1) initial recommendations (e.g., avoid people with flu-like symptoms), (2) interactions with others (e.g., avoid crowded places), and (3) health professionals (e.g., stay informed about H1N1).6 Original survey responses were grouped 6. See Table 1 of SteelFisher et al (2010). Our survey had no suitable labels for category “Physical contact with others during interaction”.. 15.
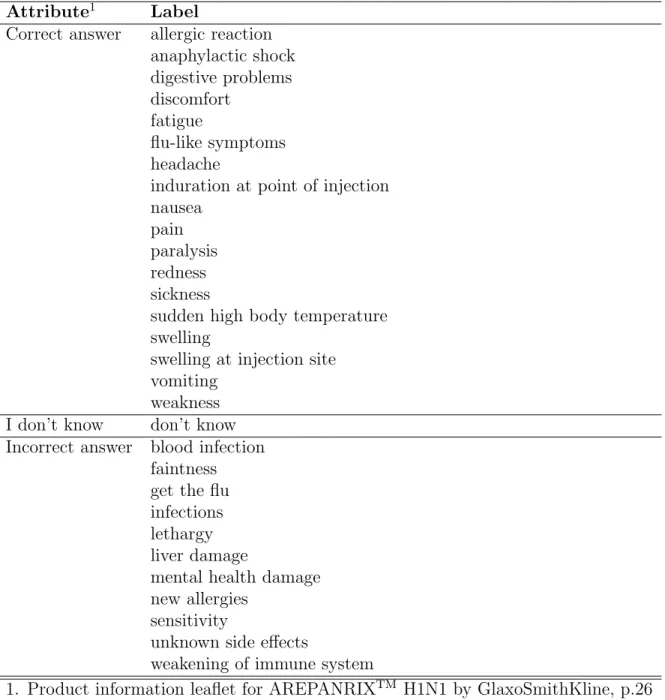
(19) into these categories, which will work nicely for us as label attributes. Responses that did not fall into any of these three categories were grouped together as “other”. Table 5 presents the mapping of labels into attributes for Question 1. Question 2 (Side Effects) For Question 2, vaccine side effects, people who have accurate knowledge of the side effects of the vaccine are more likely to accept it. We, therefore, applied the attributes as listed in Figure 2 of (1) correct (e.g., allergic reaction), (2) don’t know, and (3) incorrect responses (e.g., blood infection).7 Table 6 presents the mapping of labels into these three attributes. Question 3 (Actions if Sick) For Question 3, i.e., actions if sick, we define attributes that are again fundamental to preventing the spread of the virus. Measures that people can take involve those that provide themselves with a benefit, such as seeing a doctor, and those that provide others with a benefit, such as staying home to avoid contact. Health authorities were at the time transmitting information to prevent the spread of the virus, which mainly would have centered on actions that provide the public a benefit.8 We, therefore, apply the attributes of (1) take measures to prevent spreading the virus and (2) seek individual medical help to the response labels of this question. Table 7 shows how labels for Question 3 were assigned these attributes. Since we elicited a large number of labels for every question, it is inevitable that some labels will not fall into any attribute we apply. We add an additional “other” attribute to catch those additional labels. If our model is correct, this “other” attribute will appear as 7. Correct responses were identified based on the product information leaflet for AREPANRIX H1N1 by GlaxoSmithKline (http://www.hc-sc.gc.ca/dhp-mps/alt_formats/pdf/prodpharma/legislation/ interimorders-arretesurgence/prodinfo-vaccin-eng.pdf). 8 For example, Stay home if sick was a part of the flu prevention flyer provided by PHAC (Appendix C). In the USA, the Centers for Disease Control suggested infected individuals to “Stay away from others as much as possible to keep from making them sick”. (http://www.cdc.gov/h1n1flu/sick.htm, lastaccessedonFeb04,2013.). 16.
(20) noise in the results.. 4.3. Coordination Indices by Attribute. Figure 5 presents a re-examination of game coordination indices, now calculated by attribute. We grouped all labels together with a common attribute and analyzed labels with common attributes as a single strategy. Recall, in Figure 2, labels 3, 4 and 5 were collapsed into a single response category since they have identical attributes. We then analyzed the game as if it consisted of three labels: label 1, label 2, and the combined labels 3-5. Notice that the number of effective labels is no longer a constant five across all games. While this changes the interpretation of the index itself, we are primarily interested in which side of the scatter plot diagonal the index falls on. Question 1 (Prevention Methods): An increase in coordination persists Results for Question 1, in the top-left panel of Figure 5, are similar to those in the top-left panel of Figure 4. As prior to grouping by attribute, four games are below the 45-degree line. The mean coordination index is still higher post- than pre-outbreak (0.60 vs. 0.53, respectively). The magnitudes of the coordination indices generally increase; however, one expects this from the reduction of the number of effective labels in the game. The important feature of the data is that the majority of coordination indices are above the 45-degree line, indicating a general increase in the ability to match responses by attribute. We explore the individual attributes in the next section. Question 2 (Side Effects): From a decrease to an increase in coordination Results for Question 2, i.e., vaccine side effects, are located in the top-right panel of Figure 5. This figure tells a different story for Question 2 after grouping by attribute. There is now evidence for increasing coordination on attributes (but not strategy labels), with 10 games 17.
(21) increasing in coordination compared to five games reducing in coordination (mean indices pre- and post-outbreak: 0.52 and 0.57, respectively). We explore the results by individual attribute in the next section. Question 3 (Actions if Sick): From no to a slight decrease in coordination Results for Question 3, i.e., actions if sick, are presented on the lower panel in Figure 5. Overall, there is a slight decrease in coordination (mean indices pre- and post-coordination: 0.47 vs. 0.45, respectively). Slightly over half of the games are now below the 45-degree line, indicating a decrease in the probably of an attribute match. The main change induced by measuring coordination by attribute instead of by label is that now games are more dispersed on the graph than before. We elaborate on the individual attributes in the next section.. 4.4. Coordination on Individual Attributes. In order to understand changes in coordination in each question, we next investigate coordination probabilities by attribute using equation (2), i.e., the chances that two randomly drawn subjects select the label in question, for each attribute of the three questions. Our results are presented in Figures 6-8 as changes in coordination probabilities for each attribute from pre- to post-outbreak. The games are located on the horizontal axis labeled 1-15. The vertical axis is the difference between coordination probabilities pre- and post-outbreak. The bar graphs allow us to see not only the magnitude of changes in the coordination probabilities but also the correlation between these changes among the attributes. Question 1 (Prevention Methods): Coordination increases in the “other” attribute Figure 6 shows that an increase in coordination in this question was driven by labels in category “other”: in nine games coordination probabilities for this attribute increased by at 18.
(22) least 0.01 post-outbreak. At the same time, for the remaining three attributes all but six games decreased post-outbreak. Labels in attribute “initial recommendation” showed mostly a decrease in probabilities to coordinate (i.e., eight out of nine games where this attribute was present). A one-tailed sign-test (Table 6) of the conjecture that initial recommendations increased in coordination does not reject the null that the coordination has not changed (middle column).9 Similar results are obtained for other attributes defined using SteelFisher et al (2010). As for the remaining attribute, “other”, our original expectation was that due to being noisy, coordination on this attribute should not change because of the outbreak. However, a two-tailed sign-test rejects the null that coordination was the same on this attribute pre-outbreak as post-outbreak (right-hand column). To understand which labels drove changes in attribute “other”, we investigate this attribute in more detail below. To do so, labels with attribute “other” were further grouped by sub-attribute. Five sub-attributes were considered: vaccine (e.g., get flu shot), healthy lifestyle (e.g., exercise regularly), don’t touch face (e.g., avoid touching nose), clean surfaces (e.g., keep places clean), and miscellaneous (e.g., dress appropriately for the weather). The first four subattributes were based on the Flu Prevention Checklist by PHAC presented in Appendix B. Table 5 shows the mapping of labels from attribute “other” into sub-attributes.10 Coordination probabilities were calculated for each sub-attribute using equation (2), with j now corresponding to a sub-attribute, mj – the number of subjects who chose sub-attribute j – and as before N is the total number of subjects who played the coordination game containing sub-attribute j. Figure 9 presents changes in coordination probabilities from pre- to post-outbreak by sub9 Since we no longer have the same number of labels per game, the sign-test is seen as a more appropriate way to compare coordination probabilities, as we are interested in their change over time rather than the magnitude of that change. 10 Although listed on the Flu Prevention Checklist as a category of their own, labels “cough onto sleeves” and “sneeze onto sleeves” were assigned sub-attribute “miscellaneous” due to their low frequency (one game each). Label “have good life habits” was judged to be too ambiguous to be assigned to a specific attribute (such as “healthy lifestyle” or “initial recommendations”), so it was assigned to “miscellaneous”.. 19.
(23) attribute and game. The figure clearly demonstrates that the main changes in coordination occurred for sub-attribute “vaccine”: an improvement in coordination in this sub-attribute has the largest magnitude. This sub-attribute occurs in seven out of nine games in which coordination increased on the category “other” (marked with a circle in Figure 9). Coordination increased on “vaccine” all seven times it occurred in a game.11 This result is strong: the magnitude of change by far exceeded 10%, and in four cases out of seven it exceeded 30%. This result is interesting, as the health researchers whose design was used in this study (SteelFisher et al, 2010) did not originally include vaccination as a preventive measure. Our experimental design picked this label up as part of the menu of strategies in the game, and then again as the label that increased in focality the most post-outbreak. Question 2 (Side Effects): Coordination increases in the “correct response” attribute First, Figure 7 suggests that an increase in coordination in Question 2 occurred due to increased coordination on correct responses: 14 out of 15 games had an increase in coordination on the “correct” response attribute. Second, the figure suggests that this increase in coordination occurred at the expense of coordinating on “don’t know”. In 10 out of 15 games, an increase in coordination on attribute “correct” is accompanied by a decrease in coordination in attribute “don’t know”. Third, a one-tailed sign-test of an increase in coordination on attribute “correct” is significant (right-hand column, Table 8). 11. In the two games without sub-attribute “vaccine” (5 and 10), attribute “other” gained 0.01 and 0.035 in coordination probability, respectively, which were the lowest gains for the nine games in question.. 20.
(24) Question 3 (Actions if Sick): Coordination increases in the “take measures to prevent spreading virus” attribute Figure 8 shows that no notable change in the overall coordination for this question was masking an interesting and important change of attributes on which subjects coordinated pre- and post-outbreak. Eleven out of 15 coordination probabilities for “take measures to prevent spreading” increased post-outbreak. At the same time in 12 out of 15 games coordination reduced for “seek individual medical help”. Subjects were clearly switching from coordinating on the private good, i.e., on measures that benefitted themselves, to coordinating on the public good, i.e., on measures that benefit others and more effectively curb the spread of the virus. A one-tailed sign test of an increase in coordination on this label is significant (middle column, Table 8). The changes in probability of coordination on the “other” attribute look noisy, moving up and down approximately the same number of times.. 5. Conclusion. We experimentally measured the ability of subjects to coordinate on issues related to the H1N1 virus before and after a large outbreak of the virus. We converted a health survey into a coordination game with labels. We first elicited the labels from the subjects themselves. We then tested the ability of subjects to use the labels to match their responses to the survey questions. We showed that the degree of coordination on three issues, prevention, vaccine side effects, and actions to take if sick changed after the outbreak. We found that, contrary to the original design of the health survey, subjects found the vaccine to be the most salient label about prevention after the outbreak. This is in spite of the fact that other highly-publicized measures such as coughing onto one’s sleeve or washing one’s hands are simpler, accessible to everyone, and require no extra effort to do. Given the. 21.
(25) benefits of vaccination (Ward, Forthcoming), this result should be of particular interest to public health authorities. We found that subjects coordinated better after the outbreak on correct responses to the expected side effects of the vaccine. Finally, we found that subjects better coordinated on prevention methods that carry a public rather than private benefit after the outbreak, even though the overall degree of coordination for this question has not changed. More generally we provided the first test of the focality of strategy labels in response to a naturally occurring field coordinating device. Our results provide a unique insight into the responses of beliefs to a major health event.. 22.
(26) References Bacharach, M. and D. Stahl (2000). “Variable-frame level-n theory”. Games and Economic Behavior 33, 220-246. Bacharach, M. and M. Berlesconi (1997). “The variable frame theory of focal points: an experimental study”. Games and Economic Behavior 19, 1-45. Bardsley, N., J. Mehta, C. Starmer, and R. Sugden (2010). “Explaining focal points: cognitive hierarchy theory versus team reasoning”. Economic Journal 120, 40-79. Camerer, C. (2002). Behavioral Game Theory: Experiments in Strategic Interaction. Princeton University Press: Princeton. Chwe, M. (2001). Rational Ritual: Culture, Coordination, and Common Knowledge. Princeton University Press: Princeton. Cooper, R., D. DeJong, B. Forsythe, and T. Ross (1990). “Selection criteria in coordination games: some experimental results”, American Economic Review 80, 781-804. Cooper, R., D. DeJong, B. Forsythe, and T. Ross (1994). “Alternative institutions for resolving coordination problems: experimental evidence on forward induction and preplay communication”, in J. Friedman (ed.) Problems of Coordination in Economic Activity. Dordrecht: Kluwer. Crawford, V. (1997). “Theory and experiment in the analysis of strategic interactions”, in D. Kreps and K. Wallis (Eds.), Advances in economics and econometrics: theory and applications, Seventh World Congress, Vol I., Cambridge, U.K.: Cambridge University Press. Crawford, V. and H. Haller (1990). “Learning how to cooperate: optimal play in repeated coordination games”. Econometrica 58, 571-595. Engle-Warnick, J. and S. Soroka. (2009).“Harnessing the Power of Focal Points to Measure Social Agreement”. CIRANO working paper 2009s-31. Gilmour, H. and N. Hoffman (2010). “H1N1 vaccination”. Statistics Canada, Catalogue no. 82-003-XPE Health Reports, Vol. 21, no. 4, December 2010. Lohmann, S. (1994). “The dynamics of informational cascades: the Monday demonstrations in Leipzig, East Germany, 1989-1991.” World Politics 47, 42-101. Mehta, J., C. Starmer, and R. Sugden (1992). “The nature of salience: an experimental investigation of pure coordination games”, American Economic Review 84, 658-673. Ochs, J. (1995). “Coordination problems”, in J. Kagel and A. Roth (Eds.), Handbook of Experimental Economics. Princeton University Press: Princeton. 23.
(27) Ostrom, E. (2005). Understanding Institutional Diversity. Princeton University Press: Princeton. Rappaport, A., (1997). “Order of play in strategically equivalent games in extensive form”.International Journal of Game Theory 26, 113-136. Schelling, T. (1960). The Strategy of Conflict. Harvard University Press: Cambridge Mass. SteelFisher, GK, RJ Blendon, MM Bekheit, and K. Lubell. (2010). “The Public’s Response to the 2009 H1N1 Influenza Pandemic”. The New England Journal of Medicine 362 (22): e65. Sugden, R. (1986). The Economics of Rights, Cooperation and Welfare. Oxford: Basil and Blackwell. Sugden, R. (1995). “A theory of focal points”. Economic Journal 105, 533-550. Van Huyck, J., J. Wildenthal, and R. Battalio (2002). “Tacit co-operation, strategic uncertainty, and coordination failure: evidence from repeated dominance solvable games.” Games and Economic Behavior 38, 156-175. Ward, C. (Forthcoming) “Influenza Vaccination Campaigns: Is An Ounce of Prevention Worth a Pound of Cure?” American Economic Journal: Applied Economics Young, P. (1993). “The evolution of conventions.” Econometrica 61, 57-84. Young, P. (1998). Individual Strategy and Social Structure. Princeton NJ: Princeton University Press.. 24.
(28) Table 1: H1N1 Survey Questions Experiment Survey Questions 1 To the best of your knowledge, what measure can people take to prevent catching the current H1N1 or “swine flu”? 2 What side effect could a vaccine for H1N1 or “swine flu” have on someones health? 3 What would you do if you were feeling sick and had flu-like symptoms?. Table 2: Summary Statistics for Subjects in Menu Elicitation and Coordination Phases Variable Elicitation Coordination Phase Phase Age 25.171 27.308 (5.621) (8.078) Gender (Male=1) 0.463 0.492 Born in Canada 0.268 0.408 Currently enrolled in school 0.780 0.742 Current or highest degree: Undergraduate 0.585 0.467 Current or highest degree: Graduate 0.268 0.342 Currently studies or have ever studied medicine/health 0.244 0.233 1 Has a parent in a medical profession 0.171 0.183 Has a parent or sibling in a medical profession1 0.341 0.233 1 Has a parent sibling, or spouse in a medical profession 0.366 0.267 1 Has a relative or a friend in a medical profession 0.805 0.700 2009 2010 Has ever been vaccinated against the seasonal flu 0.463 0.342 0.383 Experienced flu-like symptoms in the past 30 days 0.171 0.217 0.100 Had someone in household with flu-like symptoms 0.073 0.200 0.125 in the past 30 days Been diagnosed with H1N1 0.000 0.008 0.042 Had a relative or a friend diagnosed with H1N1 0.146 0.142 0.333 2 Number of subjects 41 120 1. Medical profession includes doctor, nurse, paramedic, public health official, and other health/medical professional 2. Two Coordination Phase subjects who returned were excluded due to non-responses to all survey questions.. 25.
(29) Table 3: Coordination Index by Question Question PrePostDifference number Outbreak Outbreak Mean Variance Mean Variance Mean 1 0.3578 0.0112 0.4549 0.0202 0.0971 2 0.3201 0.0058 0.2840 0.0039 -0.0361 3 0.3064 0.0029 0.3023 0.0026 -0.0041 p-value for the Fligner-Policello robust rank-order test. 1: Prevention Initial Recommendation Interaction with Others Health Professionals Other. p-value. 0.0236 0.2517 0.7961. Table 4: Label Attributes 2: Vaccine Side Effects 3: Flu Actions Correct Prevent Spreading I dont know Seek Individual Help Incorrect Other. 26.
(30) Table 5: Mapping of Labels into Attributes and Sub-Attributes for Question 1 (Prevention Methods) Attribute1 Sub-attribute2 Label Initial recommendation avoid people with flu-like symptoms avoid people with H1N1 encourage infected people to stay home stay home if feeling ill use hand sanitizer wash hands before eating Interaction with others avoid crowded places avoid hospitals avoid poorly ventilated areas avoid public places keep distance from others reduce frequency of leaving home Health professionals stay informed about H1N1 take anti viral medication Other vaccine get a vaccine get an injection get flu shot get swine flu shot healthy lifestyle drink more water eat well exercise regularly have a healthy lifestyle sleep well not touching face avoid touching ears avoid touching eyes avoid touching mouth avoid touching nose clean surfaces keep places clean keep places well ventilated keep public areas clean public cleaning by government miscellaneous cough onto sleeves dress appropriately for weather have good life habits research for a vaccine sneeze onto sleeves take vitamin C verify quality of consumed products 1. SteelFisher et al (2010), Table 1; 2. Flu Prevention Checklist (Appendix B) 27.
(31) Table 6: Mapping of Labels into Attributes and Sub-Attributes for Question 2 (Vaccine Side Effects) Attribute1 Label Correct answer allergic reaction anaphylactic shock digestive problems discomfort fatigue flu-like symptoms headache induration at point of injection nausea pain paralysis redness sickness sudden high body temperature swelling swelling at injection site vomiting weakness I don’t know don’t know Incorrect answer blood infection faintness get the flu infections lethargy liver damage mental health damage new allergies sensitivity unknown side effects weakening of immune system 1. Product information leaflet for AREPANRIXTM H1N1 by GlaxoSmithKline, p.26 http://www.hc-sc.gc.ca/dhp-mps/alt_formats/pdf/prodpharma/legislation /interimorders-arretesurgence/prodinfo-vaccin-eng.pdf. 28.
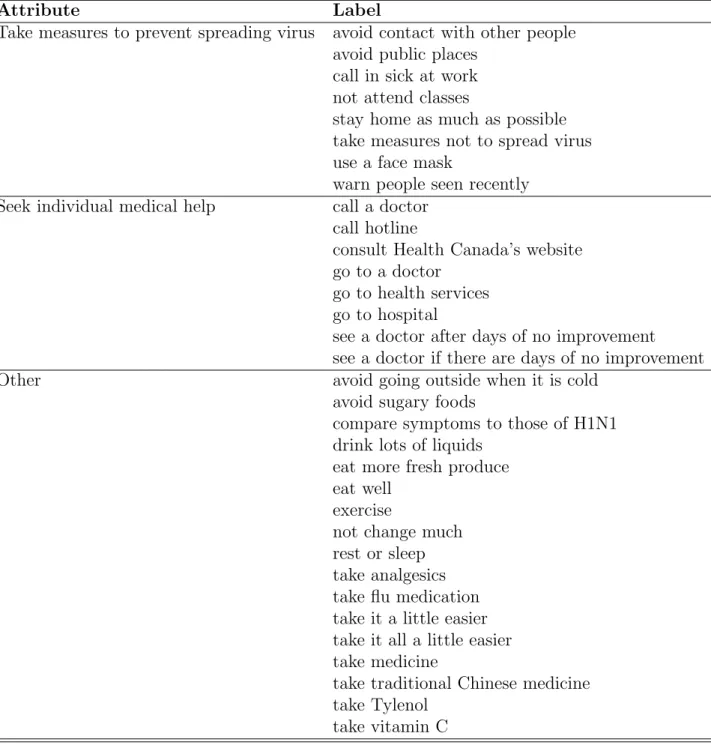
(32) Table 7: Mapping of Labels into Attributes and Sub-Attributes for Question 3 (Actions if Sick) Attribute Label Take measures to prevent spreading virus avoid contact with other people avoid public places call in sick at work not attend classes stay home as much as possible take measures not to spread virus use a face mask warn people seen recently Seek individual medical help call a doctor call hotline consult Health Canada’s website go to a doctor go to health services go to hospital see a doctor after days of no improvement see a doctor if there are days of no improvement Other avoid going outside when it is cold avoid sugary foods compare symptoms to those of H1N1 drink lots of liquids eat more fresh produce eat well exercise not change much rest or sleep take analgesics take flu medication take it a little easier take it all a little easier take medicine take traditional Chinese medicine take Tylenol take vitamin C. 29.
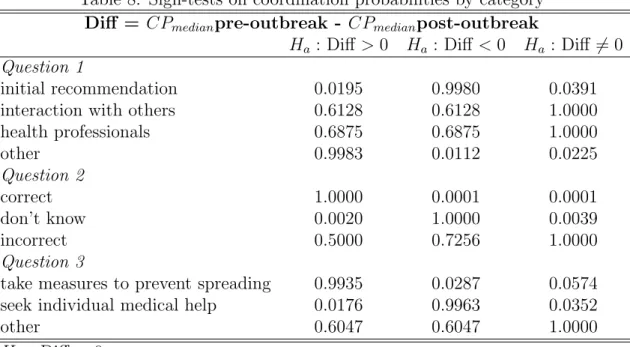
(33) Table 8: Sign-tests on coordination probabilities by category Diff = CPmedian pre-outbreak - CPmedian post-outbreak Ha : Diff > 0 Ha : Diff < 0 Ha : Diff 6= 0 Question 1 initial recommendation 0.0195 0.9980 0.0391 interaction with others 0.6128 0.6128 1.0000 health professionals 0.6875 0.6875 1.0000 other 0.9983 0.0112 0.0225 Question 2 correct 1.0000 0.0001 0.0001 don’t know 0.0020 1.0000 0.0039 incorrect 0.5000 0.7256 1.0000 Question 3 take measures to prevent spreading 0.9935 0.0287 0.0574 seek individual medical help 0.0176 0.9963 0.0352 other 0.6047 0.6047 1.0000 Ho : Diff = 0. 30.
(34) Figure 1: Example Coordination Game. 31.
(35) Figure 2: Labels, Attributes and subtlety. 32.
(36) Figure 3: Timeline of the H1N1 Outbreak. 33.
(37) Figure 4: Changes in Coordination Indices by Game Pre-Outbreak to Post-Outbreak. 34.
(38) Figure 5: Changes in Coordination Indices by Game after Grouping by Attribute PreOutbreak to Post-Outbreak. 35.
(39) Figure 6: Changes in Coordination Probabilities by Attribute in Question 1 (Prevention Methods). 36.
(40) Figure 7: Changes in Coordination Probabilities by Attribute in Question 2 (Vaccine Side Effects). 37.
(41) Figure 8: Changes in Coordination Probabilities by Attribute in Question 3 (Actions if Sick). 38.
(42) Figure 9: Changes in Coordination Probabilities by Sub-Attribute for Attribute “Other” in Question 1 (Prevention Methods). 39.
(43) Appendix A: Complete List of H1N1 Survey Questions From which source have you obtained information about the H1N1 virus or “swine flu”? To the best of your knowledge, how can people catch the current H1N1 virus or “swine flu”? To the best of your knowledge, what measure can people take to prevent catching the current H1N1 or “swine flu”? What health, demographic, economic or social condition makes somebody more likely to die than the average person if they were to catch the H1N1 or “swine flu”? What side effect could a vaccine for H1N1 or “swine flu” have on someone’s health? In response to reports of H1N1 or “swine flu”, what measure have you followed to prevent catching it? What would you do if you were feeling sick and had flu-like symptoms? What health, demographic, economic or social condition makes somebody more likely to catch the current H1N1 or “swine flu” than the average person? What is a symptom of the H1N1 virus or “swine flu”? In response to reports of H1N1 or “swine flu”, what measure have members of your family followed to prevent catching it? How long after contracting the H1N1 virus or “swine flu” do people tend to show symptoms? How long after contracting the H1N1 virus or “swine flu” are people likely to be contagious? What would you do if the university was to close for two weeks because of the H1N1 virus or “swine flu”, and you were feeling healthy? What place where you normally go would you avoid if the university was to close for two weeks because of the H1N1 or “swine flu”, and you were feeling healthy? What would you do if authorities asked people to avoid public gatherings for two weeks because of the H1N1 or “swine flu”, and you were feeling healthy? What place where you normally go would you avoid if authorities asked people to avoid public gatherings for two weeks because of the H1N1 or “swine flu”, and you were feeling healthy? How many people living in Canada will catch the H1N1 virus or “swine flu” in 1 month / 6 months / 1 year? (Keep in mind that Canada’s population is approximately 33,000,000) How many people living in Canada will die from the H1N1 virus or “swine flu” in 1 month / 6 months / 1 year? (Keep in mind that Canada’s total population is approximately 33,000,000). 40.
(44) Appendix B: Flu Prevention Checklist. 41.
(45) Appendix C: Complete List of Coordination Games. 42.
(46)
Figure
+7
Documents relatifs
For example, Canon G3 and Canon S100 received high sentiment scores on attributes like lens and color, while Nikon Coolpix 4300 and Canon PowerShot SD500 received high
Various systems (e.g. energy systems, management systems, and computer systems) take sustainability as an objective for reaching a high quality level. Penzenstadler,
Each disease/disorder mention has the following 10 different attributes: Nega- tion Indicator, Subject Class, Uncertainty Indicator, Course Class, Severity Class, Conditional
Attribute exploration is a formal concept analytical tool for knowledge discovery by interactive determination of the implications holding between a given set of attributes..
Font specific attributes, such as bold, italic and case can be used in knowledge mapping and information retrieval to encode addi- tional data in texts, lists and labels to
The document describes the elements of contact tracing; the procedures for conducting contact tracing up to the point of discharging the contacts; precautions to
This could be characterised as a different type of representation relation: not is about (which is the paradigmatic ‘aboutness’ relation of representation for information
In the case where A, B, C, D are items which can be represented in terms of the same set of features, a formal definition has been proposed for analogical proportions in the setting
