HAL Id: hal-02521896
https://hal.archives-ouvertes.fr/hal-02521896
Submitted on 27 Mar 2020HAL is a multi-disciplinary open access
archive for the deposit and dissemination of sci-entific research documents, whether they are pub-lished or not. The documents may come from teaching and research institutions in France or abroad, or from public or private research centers.
L’archive ouverte pluridisciplinaire HAL, est destinée au dépôt et à la diffusion de documents scientifiques de niveau recherche, publiés ou non, émanant des établissements d’enseignement et de recherche français ou étrangers, des laboratoires publics ou privés.
In Situ Magnetic Resonance Imaging of a Complete
Supercapacitor Giving Additional Insight on the Role of
Nanopores
Ghenima Oukali, Elodie Salager, Mohamed Ramzi Ammar,
Charles-Emmanuel Dutoit, Vincent Sarou-Kanian, Patrice Simon,
Encarnacion Raymundo-Piñero, Michaël Deschamps
To cite this version:
Ghenima Oukali, Elodie Salager, Mohamed Ramzi Ammar, Charles-Emmanuel Dutoit, Vincent Sarou-Kanian, et al.. In Situ Magnetic Resonance Imaging of a Complete Supercapacitor Giving Additional Insight on the Role of Nanopores. ACS Nano, American Chemical Society, 2019, 13 (11), pp.12810-12815. �10.1021/acsnano.9b04998�. �hal-02521896�
OATAO is an open access repository that collects the work of Toulouse
researchers and makes it freely available over the web where possible
This is an author's version published in:
http://oatao.univ-toulouse.fr/25727
Official URL: https://doi.org/10.1021/acsnano.9b04998
Any correspondence concerning this service should be sent
to the repository administrator:
tech-oatao@listes-diff.inp-toulouse.fr
To cite this version:
Oukali, Ghenima and Salager, Elodie and Ammar, Mohamed Ramzi and Dutoit,
Charles-Emmanuel and Sarou-Kanian, Vincent and Simon, Patrice
and
Raymundo-Piñero, Encarnacion and Deschamps, Michaël In Situ Magnetic
Resonance Imaging of a Complete Supercapacitor Giving Additional Insight on the
Role of Nanopores. (2019) ACS Nano, 13 (11). 12810-12815. ISSN 1936-0851
In Situ Magnetic Resonance Imaging of a
Complete Supercapacitor Giving Additional
Insight on the Role of Nanopores
Ghenima Oukali,
†,‡Elodie Salager,
*
,†,‡Mohamed Ramzi Ammar,
‡Charles-Emmanuel Dutoit,
†,‡Vincent Sarou-Kanian,
†,‡Patrice Simon,
†,||Encarnacion Raymundo-Piñero,
*
,†,‡and Michaël Deschamps
*
,†,‡†Réseau sur le Stockage Électrochimique de l’Énergie (RS2E), CNRS FR3459, 33 rue Saint Leu, 80039 Amiens, France ‡CNRS, CEMHTI UPR3079, Orléans University, 1D avenue de la recherche scientifique, 45071 Orléans Cedex 2, France ||Université Paul Sabatier, CIRIMAT UMR CNRS 5085, 118 route de Narbonne, 31062 Toulouse, France
ABSTRACT: Nuclear magnetic resonance is one of the rare techniques able to probe selectively the ions inside the nanoporous network in supercapacitor devices. With a magnetic resonance imaging method able to detect all ions (adsorbed and nonadsorbed), we record one-dimensional concentration profiles of the active ions in supercapacitors with an electrode configuration close to that used in industry. Larger anionic concentration changes are probed upon charge and discharge in a carbide-derived carbon (CDC) with micropores smaller than 1 nm compared to a conventional nanoporous carbon (CC) with a larger distribution of pore sizes, up to 2 nm. They highlight the
increased interaction of the anions with CDC and provide a better understanding of the enhanced capacitance in CDC-based supercapacitors.
KEYWORDS: supercapacitor, nanopore, carbon, nuclear magnetic resonance, magnetic resonance imaging
T
he progression toward all-electric devices calls for ever-improving energy storage systems. Among them, carbon-based supercapacitors (electrochemical double layer capacitors) with organic electrolytes are emerging as powerful energy-saving devices with their extremely long cycle life and large specific powers.1 The supercapacitor’s energy storage mechanism relies on the electrostatic attraction between the electronic charges stored on a nanoporous material and the counterions of opposite charge in the electrolyte. The observation2,3 of a large anomalous increase of the capacity for pore sizes smaller than 1 nm raised a lot of questions about the interactions between electronic charges, ions, and solvent molecules inside the nanoporous network but also about the influence of the active material structure in the adsorption and accommodation of ions and electronic charges. The full understanding of the electrolyte structure at the electrode/electrolyte interface is essential to achieve optimal performances.Few experimental techniques are suitable for the character-ization of a f ull supercapacitor device, such as those used on a commercial scale. Among them, electrochemical quartz crystal microbalance measurements provide in situ ionic fluxes and
dynamics in electrodes under polarization.4,5Nuclear magnetic resonance (NMR) spectroscopy is one of the rare techniques capable of detecting selectively one species in the electrolyte to provide relative concentrations of adsorbed species, informa-tion on the local environment, or self-diffusion coefficients.6−9
RESULTS AND DISCUSSION
Ex situ solid-state NMR and exchange experiments10 on nanoporous carbon electrodes charged in tetraethylammonium tetrafluoroborate in acetonitrile showed that the charging mechanism is based on ion exchanges at the positive and negative electrodes, where the counterion concentrations increase and the co-ions leave the carbon porous network. Nevertheless, the supercapacitor disassembly before each measurement leads to partial evaporation, which could distort the electrolyte structure. In situ experiments are needed to probe the functioning device, but the signal of the two
electrodes are overlapping in conventional NMR spectra. Spectra of individual electrodes can be recorded in situ using a shifted bagcell design with overlaid current collectors, so that a single electrode is inside the detection coil.11,12However, this design leads to degraded electrochemical performances mainly due to ohmic losses and transport issues (Figures S1 and S2). The combination of NMR spectroscopy and magnetic resonance imaging (MRI) techniques with the classical chemical shift imaging (CSI) experiment appears as desirable to monitor changes operando in each electrode of a
supercapacitor while maintaining good electrochemical per-formances.13The main issue with CSI experiments lies in the long echo time (>1 ms), which leads to signal loss from fast transverse relaxation. In this paper, we opt for an MRI method dedicated to ultrashort transverse relaxation times for the in situ study of a fully functioning supercapacitor, and we explore the effects of the carbon texture at the nanometer scale on the ionflux and charging mechanism by comparing a conventional nanoporous carbon (CC) and a carbide-derived carbon (CDC). The 1D concentration profiles along the vertical axis
Figure 1. (A)In situ electrochemical cell containing the supercapacitor (5 mm diameter, 600 μm thickness once assembled). (B) Vertical19F
spin density profile obtained from the19F NMR signal of the electrolyte.
Figure 2. (A,C)1H and (B,D)19F 1D concentration profiles of a supercapacitor made of a CC (A,B) and CDC (C,D), during OCV before charging and at 2.5 V. The profiles of the concentration changes on charge (between 2.5 V and OCV) are displayed on the right of the profiles as filled red curves.
are recorded, and the relative variations in the concentration of the electrolyte ions can be compared, as the only experimental parameters that are changed are the carbon nature and the applied voltage (Figure 1).
It must be noted that quantitative measurements are difficult to achieve in NMR, as fast relaxation issues with paramagnetic centers, internal gradients, and changes in dielectric properties may lead to signal losses.
The better approach to overcome the signal loss due to short transverse relaxation (T2 < 100s μs) consists of acquiring
points in the k-space as soon as possible, that is, just after magnetization has been flipped in the transverse plane.14−16 Experimentally, a short excitation pulse is applied with the gradient already switched on (Figure S5). The 1H and 19F
NMR spectra spread over 5 kHz, so that strong magnetic pulsedfield gradients are needed to achieve a relevant spatial resolution. The 1D concentration profile of the electrolyte in the supercapacitor is recorded with a spatial resolution of 70 μm using commercially available strong uniaxial pulsed magnetic field gradient systems (180 G/cm). However, the presence of the strong gradient does not allow us to distinguish adsorbed versus nonadsorbed species from the chemical shifts. We assume that far away from the electronic charges carried by the porous carbon, outside the porosity, the concentration should remain stable and homogeneous after a few minutes and over the duration of our experiments (i.e., several hours) as
electrolyte species diffuse rapidly. Therefore, the ion concentration changes we are observing result from the charge compensation phenomena inside the porosity, modifying the electrolyte structure at the nanometer scale.
Supercapacitors were tested with two carbons: the first, a conventional carbon (CC), is a commercially available nanoporous carbon, and the second one, CDC, is a carbon derived from titanium carbide.2The structural organization of the CC is slightly higher than that of the CDC from Raman spectroscopy (Figure S3). Importantly, the micropore size distribution reaches 2 nm for CC, whereas CDC features mainly micropores smaller than 1 nm (Figure S4 and Table S1). As expected, the supercapacitor made with CDC displays a capacitance of about 125 F/g (25% increase from CC).
All electrodes are prepared by spreading a paste of nanoporous carbon powder (85 w%), polytetrafluoroethylene (PTFE) binder (10 w%), and carbon black (5 w%). The 5 mm diameter, 170 μm thick electrodes are punched out and assembled with two 200μm thick glass fiber separators in an electrochemical cell suitable for NMR measurements17 and soaked with organic electrolyte: a 1 mol·L−1 solution of tetraethylammonium tetrafluoroborate (TEA+/BF
4−) in
deu-terated acetonitrile. We followed the modifications of the cationic (1H) and anionic (19F) concentration profiles during charge and discharge. In both cases, a concentration profile was recorded with no applied voltage (open-circuit voltage, OCV,
Figure 3. (A,B) Open-circuit contents of the pores for (left) CC and (right) CDC. The CC has both small and large nanopores, whereas the CDC has a majority of small nanopores, displayed here as slit-shaped spaces between carbon layers. Charge mechanism in (C,D) for the positive electrode and (E,F) for the green negative electrode, showing the observed anion and cationflux in the carbon electrode upon charging.
conditions) for an overview of the initial distribution of ions. Then, the supercapacitor was charged to 2.5 V and maintained at that voltage for the duration of a second measurement of the concentration profile (2−3 h). The supercapacitor was then discharged and maintained at 0 V for the third profile.
The concentration profiles for OCV and 2.5 V (Figure 2) contain contributions from the electrolyte species (TEA+ or BF4−) inside the electrodes and the separator and from residues on the cell walls and the current collectors. There is also a small broad signal from the PTFE binder and the Kel-F polymer (PCTFE or polychlorotrifluoroethylene) of the cell in
19F profiles or from residual protons in the carbons for 1H
profiles. Deuterated acetonitrile was used, and therefore, the solvent was never detected in these1H profiles. The variations
in TEA+and BF4−concentrations are visualized by subtracting
the profiles and are displayed as filled red curves on the right of each profile in Figure 2, using the same scale (see the
Supporting Information for the definition of the scale). This procedure also removes the undesired contributions, which are expected to remain unchanged during the experiments. Note that the increase in the shift of the adsorbed species observed upon charging and alignment issues between the super-capacitor axis and the z-pulsed field gradient may result in partial overlap of the contributions of the spins inside the electrodes and the separator.
We detected a reproducible and reversible increase in the total signal area at 2.5 V of about 6 and 3% in the case of1H
and19F, respectively. We could not assign them to changes in transverse or longitudinal relaxation times; they are probably due to a conductivity decrease upon charging, which results in an improvement of the probe quality factor and an increase of the overall signal.18 To account for this small effect, we adjusted the intensity of the whole profile to keep the total signal identical for the three states of charge (Figure S6).
In CC (Figure 2A,B), the1H and19F relative concentration
changes show ion exchange during charging: upon charging, TEA+ migrate toward the negative electrode and are ejected from the positive electrode. At the same time, the BF4− population at the negative electrode decreases slightly, whereas it increases in similar proportions into the positive electrode.
Those experiments evidence some ion exchange at both electrodes (counterions, co-ions out), in agreement with previous reports.10,19 However, compared to the flow of cations, theflux of anions is reduced. The mechanism at the negative electrode is therefore counterion adsorption with a small contribution from anion desorption (i.e., from ion exchange), which also confirms previous results.19 At the positive electrode, there is co-ion desorption (TEA+) and a small influx of counterions (BF4−).
On discharge, the relative concentration changes (filled orange inFigure S7) display the reverse behavior. In addition, the similar concentration profiles (at 0 V and OCV) indicate a good reversibility of the charge of the supercapacitor. This is in agreement with the previous observations by ex situ NMR experiments.10
The carbide-derived carbon was then studied with in situ1H and 19F 1D MRI. The relative ionic concentration profiles, normalized to the same area, are reported in Figure 2C,D. Interestingly, the relative concentration changes in TEA+ and BF4− are of similar shape in both carbons, but we detect an increased interaction with the anions in CDC (Figure 2D) compared to that in CC. The charge−discharge mechanism is therefore more tilted toward ion exchange with now an
increaseflux of anions, out of the negative electrode and into the positive one (Figure 3).
These differences can be rationalized with the carbon texture. The ions located in the small or sub-nanometer micropores are considered as the key players for the anomalous increase of capacitance in nanoporous carbon electrodes,2,3 and we provide here an experimental probe for this behavior. In conventional activated carbons (like CC), before any charge, the TEA+are spontaneously in excess inside the small micropores, whereas the anions are rather located nearby, in the connected larger micropores, that is, 1−2 nm (Figure 3A). This is clearly seen from previously published 13C and 11B NMR spectra of the same carbon soaked with a similar electrolyte solution: there are 3 times more TEA+ than BF4−
adsorbed in the micropores (without any voltage being applied), which are both identified from their signals shifted by−6 to −8 ppm in the NMR spectrum.10 This preferential adsorption of TEA+ may result from their hydrophobic ethyl
groups and explain the dissymmetric behavior of these electrodes. This localized violation of electroneutrality has also been observed by NMR in aqueous electrolytes.20As there is less BF4−adsorbed in the smallest micropores, these anions are less likely to be repelled by electronic negative charges (Figure 3E), and the anion flux is therefore limited (Figure 3C). This is possible because the BF4−anions can reside in the
large micropores close the small ones to maintain electro-neutrality at the nanometer scale, while staying slightly away from the carbon surface, as seen from their larger unshifted NMR signal in soaked electrodes. This may be also linked to a stronger affinity for the acetonitrile molecules, which may prevent them from entering the smallest micropores. All in all, the longer distance to the carbon surface is likely to result in lesser electrostatic interactions with anions upon charging. However, we cannot exclude a reorganization of the anions inside the positive electrode, where previously free anions can then enter the smaller pores, replacing the exiting cations. However, we expect the quantity of incoming anions to be limited to what is available in nearby large nanopores and what is expelled from the negative electrode.
In CDC, the large proportion of small micropores is considered as the driving force behind increased capaci-tance.21,22It favors the joint adsorption of cations and anions, and we infer this from the similar 19F and 1H ex situ NMR
spectra of a very similar CDC carbon soaked with TEABF4in
deuterated acetonitrile in ref23(Figure 3B). These previously published NMR spectra clearly show a very close proportion of adsorbed species for cations and anions, which hints toward a symmetric behavior for anions and cations upon charging/ discharging this CDC-based supercapacitor. This might be expected in CDC, as the narrower pore size distribution will force anions to also come close to the carbon surface, as larger micropores are not available. Therefore, BF4−anions are now
attracted/repelled by the electronic charge in the same proportions as TEA+ cations (Figure 3B,D). Therefore, in both electrodes, the ion exchange mechanism dominates with similar contributions from the cations and anions.
We also recorded the 1H profile for a supercapacitor made
with CC and a 1 mol·L−1 solution of TEABF4 in
non-deuterated acetonitrile to probe the solvent’s part in the process (Figure 4A). As expected, the1H concentration profile
contains a contribution from the solvent. The 1H concen-tration changes are, however, of the same order of magnitude as those observed for TEA+ alone (Figure 4B). Although we
cannot rule out a rearrangement of the solvent at the nanometer scale, nor that small changes in solvent concen-trations are harder to detect, we can safely assume that no significant macroscopic change in the solvent concentration occurs in the electrodes, which agrees well with previous results from electrochemical quartz crystal microbalance measurements.5 This also implies that we do not see a flux of solvents molecules resulting from desolvation. Although desolvation was inferred from the relative size of pores and solvated/desolvated ions2 and confirmed with the decrease of the adsorbed NMR solvent signal at the negative electrode in previous experiments,10 our results indicate that the solvent molecules stay in the vicinity of adsorbed ions.
CONCLUSIONS
As a conclusion, we managed with a 1D MRI analysis to follow the ionic concentration changes in supercapacitors with an electrode configuration close to that used in industry and with good electrochemical performances. The strong magneticfield gradient (180 G/cm) allows for the monitoring of theflux of ions in and out of each electrode. In a microporous carbon with a large pore size distribution from 0.5 to 2.0 nm as in a conventional carbon, our MRI measurements indicate TEA+
adsorption at the negative electrode and desorption at the positive electrode, whereas the BF4−oppositeflux is observed in lesser proportions. In a microporous carbon with a narrow pore size distribution around 0.7 nm (CDC), we see an increased interaction with the anions, which tilts the charge
mechanism, in both electrodes, toward ion exchange, with counterions entering and co-ions leaving each electrode.
We explain this phenomenon by the porous texture of CDC: cations and anions are now in equal concentration in the small micropores because of the absence of large micropores, which leads to a more symmetrical behavior of the ions during charge and discharge and an increased capacitance.
The present method is applicable to the operando studies of various devices (batteries, fuel cells, electrochemical cells, etc.) by magnetic resonance imaging.
METHODS
Electrode Preparation. The electrodes are prepared by spreading the paste of nanoporous carbon powder (85 w%) mixed with a PTFE binder (10 w%, Aldrich) and carbon black (5 w%, Pure Black, Superior Graphite Co., USA). The 5 mm diameter, 170μm thick electrodes are punched out and assembled with two 200 μm thick glassfiber separators (Whatman) in an electrochemical cell suitable for NMR measurements17and soaked with an organic electrolyte: a 1 mol·L−1 solution of tetraethylammonium (TEA+)−tetrafluoroborate
(BF4−) in deuterated acetonitrileall purchased from Sigma-Aldrich
and used without further purification.
Electrochemical Cycling. The supercapacitors are precondi-tioned before the NMR experiments: the cells are cycledfive times at a rate of 2 mV·s−1between 0.9 and 1.1 V thenfive times between 0.9 and 1.3 V and so on until reaching 2.5 V. The first NMR profile measurement is carried out in open-circuit voltage conditions for an overview of the species distribution (cations or anions) before charging. The supercapacitor is then charged with a rate of 2 mV·s−1
to 2.5 V and heldfloating at this voltage to perform the second NMR profile measurement (supercapacitor in charge) for approximately 3 h. The supercapacitor is then discharged at the same rate (2 mV·s−1) and heldfloating at 0 V for approximately 3 h during the third NMR profile measurement corresponding to the discharged state.
To that end, we set up a potentiostat and NMR spectrometer synchronization. A cable connects the potentiostat with the NMR spectrometer (IPSO card). The potentiostat sends a TTL pulse once the desired voltage is reached. The NMR pulse sequence is modified to include a waiting time for this TTL pulse before the measurement starts.
1D Concentration Profile Recording. Experimentally, a short excitation pulse is applied with the gradient already switched on (see Figure S5). This MRI experiment is identical to that originally proposed by Lauterbur,14 later renamed BLAST15 or ZTE.16 The name only differs because of the data processing (2D or 3D image reconstruction). We record the 1D concentration profile along the vertical axis, which is obtained from a simple Fourier transform of the data. The missing points (=2) in the center of the k-space due to the dead time of the probe are not numerically calculated. The pulse sequence allows for a significant reduction of the delay between excitation and acquisition. Yet the short dead time (TE) still creates a first-order phase shift and has a significant effect on the concentration profiles and their differences. The concentration profiles were therefore processed in magnitude mode. The 1D concentration profiles were measured with the pulse sequence shown inFigure S5 on a Bruker 200 MHz wide bore Avance III spectrometer equipped with a Bruker Diff30 probe (1H and19F 10 mm inner diameter saddle
coils) and a GREAT60 (60 G·A−1·cm−1) gradient amplifier. The
strength of the pulsed magneticfield gradient was ramped up to 180 G·cm−1 in 500μs and stabilized for 1 ms before a 30° hard pulse
excitation with a duration of 3.5μs (25 W). The probe dead time (TE) is set to 6.5μs, and the signal is recorded for 2 ms. For the1H
concentration profiles, a recovery delay of 5 s was sufficient to ensure the complete relaxation of the spin system, and 2048 scans were used for each concentration profile. For the 19F concentration profiles, a
recovery delay of 10 s was necessary and 1024 scans per concentration profile were recorded. The spin density profiles for1H and19F spread
over a frequency of around 46 kHz. The resolution is limited by the Figure 4. Charge/discharge 1D TEA+concentration profiles (left)
during OCV, at 2.5 and 0 V, and the corresponding changes on the same scale (right: red for charge and orange for discharge) observed for a supercapacitor made with CC with (A) non-deuterated and (B) non-deuterated acetonitrile.
width of the spectrum under no gradient (5 kHz), corresponding to around 70μm in1H and19F.
ASSOCIATED CONTENT
*
S Supporting InformationThe Supporting Information is available free of charge on the
ACS Publications websiteat DOI:10.1021/acsnano.9b04998. Electrochemical and ex situ NMR characterization of the supercapacitor designs, structural characterization of the carbons, details on experimental and processing procedures, concentration profiles and changes on discharge (PDF) AUTHOR INFORMATION Corresponding Authors *E-mail:elodie.salager@cnrs-orleans.fr. *E-mail:raymundo@cnrs-orleans.fr. *E-mail:michael.deschamps@univ-orleans.fr. ORCID Elodie Salager:0000-0002-5443-9698 Patrice Simon:0000-0002-0461-8268 Encarnacion Raymundo-Piñero: 0000-0001-9712-3987 Michaël Deschamps: 0000-0001-8309-3932 Notes
The authors declare no competingfinancial interest.
ACKNOWLEDGMENTS
The authors acknowledge financial support from the French national network“Réseau sur le Stockage Electrochimique de l’Energie” (RS2E) FR CNRS 3459, and from Laboratory of Excellence program STORE-EX (ANR 10-LABX-0076). G.O. thanks the Agence Nationale de la Recherche (ANR) with the LABEX STORE-EX (ANR-10-LABX-76) for Ph.D. funding.
REFERENCES
(1) Miller, J. R.; Burke, A. F. Electrochemical Capacitors: Challenges and Opportunities for Real-World Applications. Electrochem. Soc. Interface 2008, 17, 53−57.
(2) Chmiola, J.; Yushin, G.; Gogotsi, Y.; Portet, C.; Simon, P.; Taberna, P. L. Anomalous Increase in Carbon Capacitance at Pore Sizes Less Than 1 Nanometer. Science 2006, 313, 1760−1763.
(3) Raymundo-Piñero, E.; Kierzek, K.; Machnikowski, J.; Béguin, F. Relationship between the Nanoporous Texture of Activated Carbons and Their Capacitance Properties in Different Electrolytes. Carbon 2006, 44, 2498−2507.
(4) Levi, M. D.; Levy, N.; Sigalov, S.; Salitra, G.; Aurbach, D.; Maier, J. Electrochemical Quartz Crystal Microbalance (EQCM) Studies of Ions and Solvents Insertion into Highly Porous Activated Carbons. J. Am. Chem. Soc. 2010, 132, 13220−13222.
(5) Tsai, W.-Y.; Taberna, P.-L.; Simon, P. Electrochemical Quartz Crystal Microbalance (EQCM) Study of Ion Dynamics in Nano-porous Carbons. J. Am. Chem. Soc. 2014, 136, 8722−8728.
(6) Lee, S.-I.; Saito, K.; Kanehashi, K.; Hatakeyama, M.; Mitani, S.; Yoon, S.-H.; Korai, Y.; Mochida, I.11B NMR Study of the BF
4−Anion
in Activated Carbons at Various Stages of Charge of EDLCs in Organic Electrolyte. Carbon 2006, 44, 2578−2586.
(7) Borchardt, L.; Oschatz, M.; Paasch, S.; Kaskel, S.; Brunner, E. Interaction of Electrolyte Molecules with Carbon Materials of Well-Defined Porosity: Characterization by Solid-State NMR Spectrosco-py. Phys. Chem. Chem. Phys. 2013, 15, 15177−15184.
(8) Forse, A. C.; Griffin, J. M.; Presser, V.; Gogotsi, Y.; Grey, C. P. Ring Current Effects: Factors Affecting the NMR Chemical Shift of Molecules Adsorbed on Porous Carbons. J. Phys. Chem. C 2014, 118, 7508−7514.
(9) Forse, A. C.; Griffin, J. M.; Merlet, C.; Carretero-Gonzalez, J.; Raji, A.-R. O.; Trease, N. M.; Grey, C. P. Direct Observation of Ion Dynamics in Supercapacitor Electrodes Using In Situ Diffusion NMR Spectroscopy. Nat. Energy 2017, 2, 16216.
(10) Deschamps, M.; Gilbert, E.; Azais, P.; Raymundo-Piñero, E.; Ammar, M. R.; Simon, P.; Massiot, D.; Béguin, F. Exploring Electrolyte Organization in Supercapacitor Electrodes with Solid-State NMR. Nat. Mater. 2013, 12, 351−358.
(11) Wang, H.; Köster, T. K.-J.; Trease, N. M.; Ségalini, J.; Taberna, P.-L.; Simon, P.; Gogotsi, Y.; Grey, C. P. Real-Time NMR Studies of Electrochemical Double-Layer Capacitors. J. Am. Chem. Soc. 2011, 133, 19270−19273.
(12) Wang, H.; Forse, A. C.; Griffin, J. M.; Trease, N. M.; Trognko, L.; Taberna, P.-L.; Simon, P.; Grey, C. P. In Situ NMR Spectroscopy of Supercapacitors: Insight into the Charge Storage Mechanism. J. Am. Chem. Soc. 2013, 135, 18968−18980.
(13) Ilott, A. J.; Trease, N. M.; Grey, C. P.; Jerschow, A. Multinuclear In Situ Magnetic Resonance Imaging of Electrochemical Double-Layer Capacitors. Nat. Commun. 2014, 5, 4536.
(14) Lauterbur, P. C. Image Formation by Induced Local Interactions: Examples Employing Nuclear Magnetic Resonance. Nature 1973, 242, 190−191.
(15) Hafner, S. Fast Imaging in Liquids and Solids with the Back-Projection Low Angle ShoT (BLAST) Technique. Magn. Reson. Imaging 1994, 12, 1047−1051.
(16) Weiger, M.; Pruessmann, K. P.; Hennel, F. MRI with Zero Echo Time: Hard versus Sweep Pulse Excitation. Magn. Reson. Med. 2011, 66, 379−389.
(17) Salager, E.; Sarou-Kanian, V.; Sathiya, M.; Tang, M.; Leriche, J.-B.; Melin, P.; Wang, Z.; Vezin, H.; Bessada, C.; Deschamps, M.; Tarascon, J.-M. Solid-State NMR of the Family of Positive Electrode Materials Li2Ru1−YSnYO3 for Lithium-Ion Batteries. Chem. Mater.
2014, 26, 7009−7019.
(18) Houlleberghs, M.; Hoffmann, A.; Dom, D.; Kirschhock, C. E. A.; Taulelle, F.; Martens, J. A.; Breynaert, E. Absolute Quantification of Water in Microporous Solids with1H Magic Angle Spinning NMR
and Standard Addition. Anal. Chem. 2017, 89, 6940−6943. (19) Griffin, J. M.; Forse, A. C.; Tsai, W.-Y.; Taberna, P.-L.; Simon, P.; Grey, C. P. In Situ NMR and Electrochemical Quartz Crystal Microbalance Techniques Reveal the Structure of the Electrical Double Layer in Supercapacitors. Nat. Mater. 2015, 14, 812−819.
(20) Luo, Z.-X.; Xing, Y.-Z.; Ling, Y.-C.; Kleinhammes, A.; Wu, Y. Electroneutrality Breakdown and Specific Ion Effects in Nano-confined Aqueous Electrolytes Observed by NMR. Nat. Commun. 2015, 6, 6358.
(21) Futamura, R.; Iiyama, T.; Takasaki, Y.; Gogotsi, Y.; Biggs, M. J.; Salanne, M.; Ségalini, J.; Simon, P.; Kaneko, K. Partial Breaking of the Coulombic Ordering of Ionic Liquids Confined in Carbon Nano-pores. Nat. Mater. 2017, 16, 1225−1232.
(22) Salanne, M.; Rotenberg, B.; Naoi, K.; Kaneko, K.; Taberna, P.-L.; Grey, C. P.; Dunn, B.; Simon, P. Efficient Storage Mechanisms for Building Better Supercapacitors. Nat. Energy 2016, 1, 16070.
(23) Forse, A. C.; Griffin, J. M.; Wang, H.; Trease, N. M.; Presser, V.; Gogotsi, Y.; Simon, P.; Grey, C. P. Nuclear Magnetic Resonance Study of Ion Adsorption on Microporous Carbide-Derived Carbon. Phys. Chem. Chem. Phys. 2013, 15, 7722.
S1
Supplementary Information
In Situ Magnetic Resonance Imaging of a Complete Supercapacitor
Giving Additional Insight on the Role of Nanopores
Ghenima Oukali,
†,‡Elodie Salager,
†,‡,*Mohamed Ramzi Ammar,
‡Charles-Emmanuel Dutoit,
†,‡Vincent
Sarou-Kanian,
†,‡Patrice Simon,
†,||Encarnacion Raymundo-Piñero,
†,‡,*Michaël Deschamps
†,‡,*† Réseau sur le Stockage Electrochimique de l’Energie (RS2E), CNRS FR3459, 33 rue Saint Leu, 80039 Amiens, France ‡ CNRS, CEMHTI UPR3079, Université d’Orléans, 1D avenue de la recherche scientifique, 45071 Orléans Cedex 2, France || Université Paul Sabatier, CIRIMAT UMR CNRS 5085, 118 route de Narbonne, 31062 Toulouse, France
Electrodes configuration effect Electrochemical study
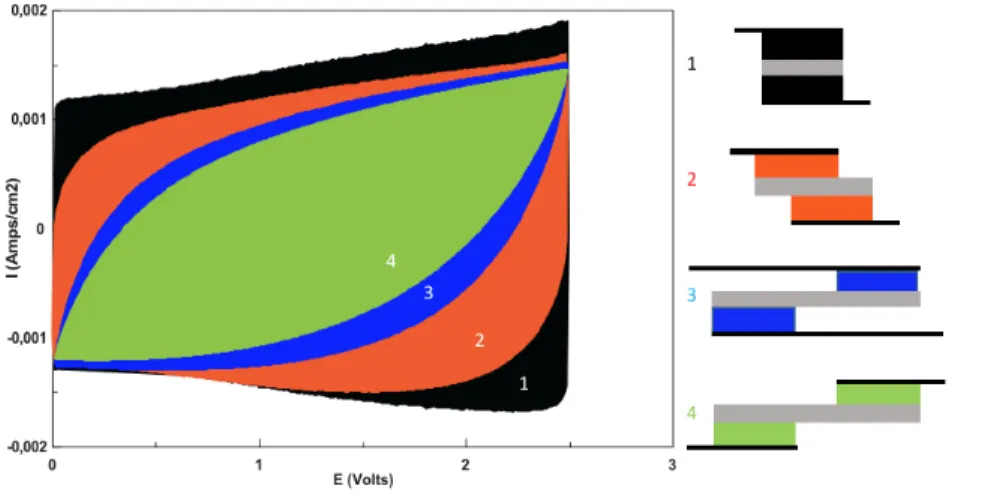
We performed cyclic voltammetry experiments on several supercapacitor configurations (figure S1) to compare their perfor-mances. We observed that the conventional parallel configuration provides the greatest capacity with a nearly rectangular voltammogram while shifted electrodes display degraded performances. The charge stored on the electrode surface is reduced as the electrode contact surface decreases. This implies that for a given applied voltage, we expect that the amount of immo-bilized counter-ions and the electric potential will vary inside the electrodes and that their charged state may lead to inhomo-geneous ion concentrations.
Figure S1. Cyclic voltammetry of different supercapacitors, with (1) conventional parallel configuration (black), (2) with slightly shifted electrodes (orange), (3) with shifted electrodes and overlapping current collectors (blue) and (4) shifted elec-trodes and no overlapping current collectors.
S2
Ex situ Nuclear Magnetic Resonance (NMR) study
11B ex situ Magic Angle Spinning (MAS)-NMR spectra were recorded in order to characterize the effect of the supercapacitor
cell configuration on the proportion of ions stored inside the electrodes. The electronic density on the carbon was shown to affect the resonance frequency of adsorbed species.1 DFT calculations showed that the addition or removal of electrons to a
delocalized system induces considerable changes in the NMR shift of nearby spins.2
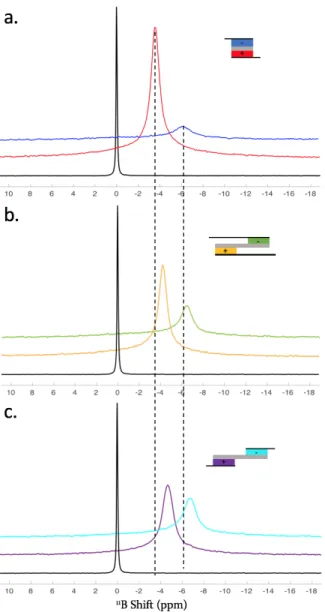
Figure S2 shows the ex situ 11B MAS-NMR spectra of positive and negative electrodes for three supercapacitor cell designs,
after each were charged at 2.5 V (at a rate of 2 mV/s) and disassembled straight after the charge. The electrode material was detached from the current collectors and placed inside a 4 mm rotor. The sample spinning rate was set to 5 kHz and 1D spectra were recorded in a Bruker 200 MHz Avance HD spectrometer equipped with a 4 mm WVT 1H-19F/X double resonance probe,
using a long recovery delay of 20 s to ensure full relaxation of the spin system.
Figure S2. Ex situ 11B MAS-NMR spectra of the positive and negative electrodes of different supercapacitor cell designs
charged at 2.5 V (schemes displayed on the right-hand side of each spectrum). (a) conventional parallel configuration, (b) design with shifted electrodes and overlapping current collectors and (c) design featuring shifted electrodes and no overlap of the current collectors. The spectrum obtained for the free electrolyte is shown in black for reference. The dashed lines are guides for the eye.
The conventional design, the “long cell design” and the overlaid cell design introduced by Wang et al.3 for easier in situ NMR
experiment were tested. All the NMR spectra display a peak corresponding to BF4- anions in the electrode porosity after
charg-ing. The first observation concerns the differences in peak intensities between the positive electrode (larger peak) and the negative electrode (smaller peak): as expected, the positive electrode contains more anions. The more resistive designs display a lesser difference in intensities, which reflect their lower electronic charges in agreement with the voltammograms. This is
S3
confirmed by the peak positions. Inside the porosity, the chemical shift is modified by -6 ppm/-8 ppm. This effect is reduced upon charging.2 The peak for the anions in the parallel design is closer to the electrolyte peak compared to the other designs
and confirms the larger electronic density reached in the electrodes of the conventional design.
CC and CDC structural characterisation
Two types of carbons were used: the first, (CC), is a commercially available nanoporous carbon (Norit (Cabot) DLC Super 50) and the second one (CDC) is a carbon derived from titanium carbide, chlorinated at 900°C.4
Structural study by Raman scattering
Vibrational Raman studies were performed in ambient conditions using a Renishaw Invia Reflex spectrometer equipped with an Ar+ laser source (2.41eV/514.5nm). The spectra were collected under a Leica DM2500 optical microscope (×50
objec-tives/N.A.= 0.75). Very low incident power (~1mW) was used to avoid heating effects or a possible modification of the local structural organization.
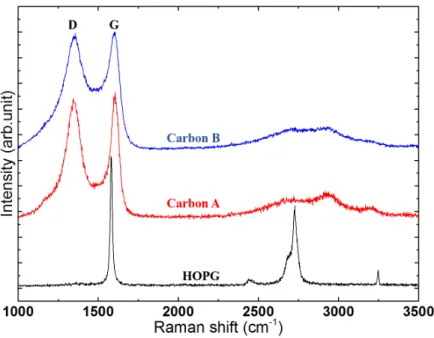
The Raman spectrum of Highly Oriented Pyrolytic Graphite is used here as a reference and it is characterized by symmetry-allowed modes. The band located at 1581cm-1 (the G band) corresponds to one-phonon Raman scattering process at the 1st
Brillouin zone center G (q~0, q stands for the phonon wavevector) and consists of the collective in-plane bond stretching of the polyaromatic carbon atoms (E2g symmetry). The band located at around 2700 cm-1 (The so-called G’ or 2D band), appearing
as a doublet, corresponds to the totally symmetric transversal phonon A'1 located in the vicinity of the high symmetry phonon
points (K or K'). The activation of this mode is satisfied by the scattering by two phonons with opposite wavevector (q¹0). The doublet is generally the signature of tri-periodic structure of graphene layers.
Disordered sp2 carbons are characterized by the appearance the so-called D band, in the first-order Raman spectrum, located
at around 1350 cm-1. It is the first order of the G’ or 2D band requiring defects to be activated. At relatively low defect density,
the D band intensity increases with increasing disorder. This is accompanied by the increase of the width of the Raman bands as well as the weakening of the second order bands.
The analysis of the Raman spectra (Figure S3) indicates, based on those parameters, that the structural organization of C is slightly higher than the CDC.
Figure S3. Raman spectra obtained for CC (carbon A - red) and CDC (carbon B - blue), using a laser energy of 2.41 eV (514.5 nm). The spectrum of HOPG (Highly oriented pyrolytic graphite) is displayed as a reference in black.
S4
Pore size distribution
The specific surfaces area and pore size distributions for the two carbone were obtained from the N2 and CO2 adsorption
isotherms at 77 K and 273 K, respectively. The total surface area (SBET) was obtained from the N2 isotherm with the BET
equation, the specific microporous surface (SDR) and ultramicropore volume (Vultramicro) were obtained by applying the
Dubinin-Raduskevich equation to the CO2 isotherm. The micropore (Vmicro) and mesopore (Vmeso) volumes were determined from the
N2 isotherm using the Nonlinear Differential Functional Theory pore size distribution (2D-NLDFT) assuming an energetic
heterogeneity of carbon pores.5
The pore size distribution is ranging from micro- to meso-pores for CC(carbon A – red), whereas CDC (carbon B - blue) features mainly micropores under 1 nm and a very little amount of large micropores and mesopores (Figure S4 and Table S1).
Figure S4. 2D-NLDFT Pore size distribution of a conventional carbon (CC : carbon A, in red) and a carbide derived carbon (CDC: carbon B in blue).
Table S1. Structural properties of conventional carbon (CC) and CDC
Origin SBET(N2) m2/g SDR(CO2) m2/g Vultramicroa (d<0.7nm) cm3/g Vmicrob (d<1nm) cm3/g Vmicrob (1<d<2nm) cm3/g Vmesob (2<d<50nm) cm3/g
CC carbonized and acti-From coconut fiber, vated with H2O
1560 1519 0.58 0.36 0.30 0.22
CDC
Derived from titanium carbide generated by
chlorination :
TiC + 2Cl 2 →
TiCl4 + C
1489 1602 0.61 0.51 0.10 0.09
a: obtained after applying Dubinin-Radushkevich equation to the CO2 adsorption data b: obtained after applying the 2D-NLDFT method to the N2 adsorption data
S5
1D concentration profile recording
Figure S5. Pulse sequence used for the measurement of the 1D concentration profiles.
Calculation of the profiles of concentration change
The concentration spatial variations were calculated by difference of the concentration profiles in magnitude mode. The con-centration profiles display an overall increased area upon charging, seemingly due to a small decrease in the overall conduc-tivity and an improved probe quality factor. We scaled down the overall area of the concentration profiles at 2.5 V and 0 V to compensate for these variations, as shown in Figure S6 below.
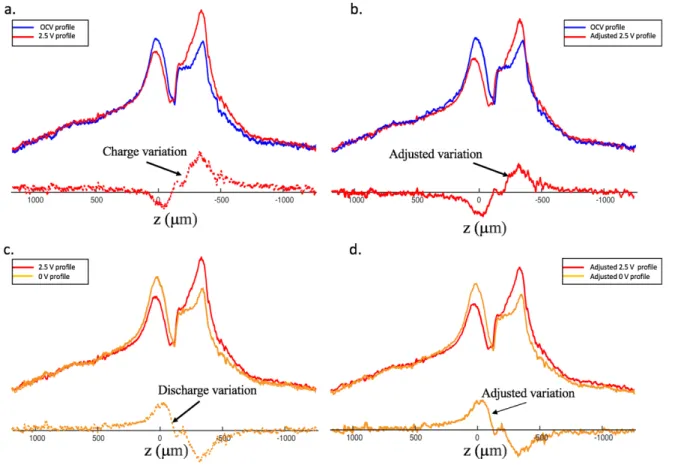
Figure S6. 1H concentration profiles of a supercapacitor under open circuit (blue), at 2.5 V (red) and at 0 V (yellow) after
discharge. Concentration variation profiles for charge (a. and b.) and discharge (c. and d.), with no scaling (left) and scaling (right).
S6
Changes in concentration profiles for carbon A and carbon CDC upon charge and discharge
The concentration profile unit is arbitrary. We assumed that the ions do not disappear from the detection zone and we calibrated the total area of all the concentration profiles to be identical for a given cell, as explained above.
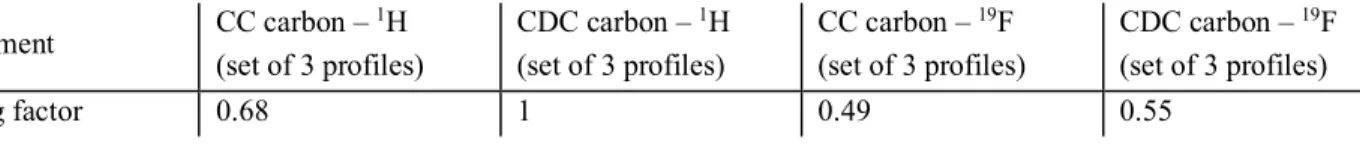
The areas of the signals differed between the four cells (slight variations in the amount of electrolyte present in the detection zone, slight variations in the conductivity of the cell). In order to compare the profiles of CC and CDC carbons in Figures 2 and S7 the set of 1H concentration profiles (OCV, 2.5 V, 0 V) for the CC carbons were calibrated to obtain the same area as
the 1H concentration profiles for the CDC carbon. A single scaling factor is needed as the 3 profiles (after the processing
explained above). The profiles of relative concentration variations are displayed using the same scale as the concentration profiles so that their intensity can be compared. The relative concentration variations are therefore only due to changes in the position (and potentially shift) of the ions.
There is no physical reason for the 19F area to be identical to the 1H area, notably because the 19F NMR detection coil does not
have the same sensitivity as the 1H NMR detection coil. Here, the 19F concentration profiles for CC and CDC were calibrated
to the same area as the 1H concentration profiles to get comparable relative scales for the differences.
Table S2: Relative scaling factors for the profiles in figure 2 and figure S7 Experiment CC carbon – 1H (set of 3 profiles) CDC carbon – 1H (set of 3 profiles) CC carbon – 19F (set of 3 profiles) CDC carbon – 19F (set of 3 profiles) Scaling factor 0.68 1 0.49 0.55
S7
Figure S7. 1H (a,c) and 19F (b,d) 1D concentration profiles of a supercapacitor made of CC (a,b) and CDC (c,d) carbons, during
OCV before charging (blue), at 2.5 V (red) and 0 V(yellow). The concentration variations on charge (between 2.5 V and OCV) are displayed on the right of the profiles as filled red curves, and the concentration changes on discharge (between 2.5 V and 0 V) are displayed as filled orange curves.
+ -+ -600 µm 600 µm OCV 0 V 2.5 V CC carbon CDC carbon TEA+ BF4 -0 10 20 0 10 20 0 10 20 0 10 20 a b d c position (µm) position (µm) position (µm) position (µm) -500 0 500 -500 0 500 -500 0 500 -500 0 500 Charge Discharge 19F concentration profile 1H concentration profile 19F concentration profile 1H concentration profile TEA+ relative concentration variarions BF4 - relative concentration variations TEA+ relative concentration variations BF4 - relative concentration variations
S8
REFERENCES
(1) Deschamps, M.; Gilbert, E.; Azais, P.; Raymundo-Piñero, E.; Ammar, M. R.; Simon, P.; Massiot, D.; Béguin, F. Exploring Electrolyte Organization in Supercapacitor Electrodes with Solid-State NMR. Nat. Mater. 2013, 12, 351–358. (2) Forse, A. C.; Griffin, J. M.; Presser, V.; Gogotsi, Y.; Grey, C. P. Ring Current Effects: Factors Affecting the NMR Chemical Shift of Molecules Adsorbed on Porous Carbons. J. Phys. Chem. C 2014, 118, 7508–7514.
(3) Wang, H.; Forse, A. C.; Griffin, J. M.; Trease, N. M.; Trognko, L.; Taberna, P.-L.; Simon, P.; Grey, C. P. In Situ NMR Spectroscopy of Supercapacitors: Insight into the Charge Storage Mechanism. J. Am. Chem. Soc. 2013, 135, 18968– 18980.
(4) Chmiola, J.; Yushin, G.; Gogotsi, Y.; Portet, C.; Simon, P.; Taberna, P. L. Anomalous Increase in Carbon Capacitance at Pore Sizes Less Than 1 Nanometer. Science 2006, 313, 1760–1763.
(5) Jagiello, J.; Olivier, J.P. 2D-NLDFT Adsorption Models for Carbon Slit-Shaped Pores with Surface Energetical Heterogeneity and Geometrical Corrugation. Carbon 2013, 55, 70-80