V
IV
Disproportionation Upon Sodium Extraction
From Na
3
V
2
(PO
4
)
2
F
3
Observed by Operando X-ray
Absorption Spectroscopy and Solid State NMR
Thibault Broux
a,b,e, Tahya Bamine
a,e, Laura Simonelli
c, Lorenzo Stievano
d,e,f,
François Fauth
c, Michel Ménétrier
a,e, Dany Carlier
a,e, Christian Masquelier
b,e,fand
Laurence Croguennec
a,e,f,**
a
CNRS, Univ. Bordeaux, Bordeaux INP, ICMCB UPR 9048, F-33600 Pessac, France.
b
Laboratoire de Réactivité et de Chimie des Solides, CNRS-UMR#7314, Université de Picardie Jules Verne, F-80039 Amiens Cedex 1, France
c
CELLS - ALBA synchrotron, E-08290 Cerdanyola del Vallès, Barcelona, Spain
d
CNRS, Univ. Montpellier, Institut Charles Gerhardt Montpellier UMR 5253, F-34095 Montpellier Cedex 5, France
e
RS2E, Réseau Français sur le Stockage Electrochimique de l’Energie, FR CNRS 3459,F-80039 Amiens Cedex 1, France
f
ALISTORE-ERI European Research Institute, FR CNRS 3104, F-80039 Amiens Cedex 1, France
Abstract
Among the series of polyanionic positive electrodes for Na-ion batteries having the general formula Na3V2(PO4)2F3-yOy (0 ≤ y ≤ 2), the composition Na3V2(PO4)2F3 (y = 0) has the highest theoretical energy that offers competitive electrochemical performances compared to sodium transition metal oxides. Recently the structural phase diagram from Na3V2(PO4)2F3 to Na1V2(PO4)2F3 has been thoroughly investigated by operando synchrotron X-ray diffraction revealing an unexpected structural feature for the end member composition. In fact the crystal structure of Na1V2(PO4)2F3 has two very different vanadium environments within each bi-octahedron that suggests a charge disproportionation of two VIV into VIII and VV. This work shows an operando X-ray absorption spectroscopy at vanadium K-edge during the electrochemical extraction of Na+ in order to monitor the redox processes involved in this compound. The large data set provided by this experiment has been processed by the principal component analysis combined with multivariate curve resolution. The results suggest that the bi-octahedra have to be considered as the basic structural unit. The peculiar geometry of this material combined with the mixed vanadium valence, directly investigated here along the reaction, seems to allow original electronic configurations. In particular the two vanadium sites into the basic bi-octahedra unit evolves from VIII - VIII to VIII - VIV and to a final VIII - VIV configuration. These observations are completed with 51V NMR sensitive to diamagnetic VV.
Introduction
The increasing need for electrochemical energy storage, either for portable electronic devices or for larger-scale applications such as hybrid electric vehicles or static renewable energy storage systems, causes renewed interest in alternatives to Li-ion batteries in order to overcome drawbacks associated to the availability and prize of lithium resources.1 In this context Na-ion batteries is an emerging field owing to lower price and very large earth-abundance of sodium.2 In terms of energy density Na-ion
batteries hardly competes with Li-ion ones due to the intrinsic properties of Na: a less negative standard reduction potential (-2.7 V vs SHE for the Na+aq/Na against -3.04 V for the Li
+
aq/Li one) and a higher molecular weight. Thus Na-ion technology can be addressed for targeted applications such as domestic energy storage and load leveling applications.
Among several polyanionic-based electrode materials,3-9 one of the most promising family turns out to be the sodium-vanadium fluorophosphate compounds Na3V2(PO4)2F3-yOy where y can vary from 0 to 2.10-20 This whole range of compositions from VIII-rich (y = 0) to VIV-rich (y = 2), can be oxidized to VIV-rich and VV-rich compounds respectively by the deintercalation of two sodium ions. For instance in Na3V2(PO4)2F3 (y = 0) the extraction of 2 Na
+
ions has been experimentally demonstrated with two main voltage-composition plateaus at around 3.7 and 4.2 V vs Na+/Na giving a theoretical energy density of 507 Wh/kg17, 21-22 (128 Ah/kg at an average potential of 3.95 V), competitive with that delivered by LiFePO4 in Li-ion batteries. As recently depicted by Bianchini et al.
15
the pristine Na3V
III
2(PO4)2F3 crystalizes in the Amam space group at room temperature. This structure consists of a tridimensional framework of V2O8F3 bi-octahedra which are connected by PO4 tetrahedra that generates large tunnels where Na+ ions are mobile upon extraction/insertion reactions.
The operando structural evolution has been extensively characterized by Bianchini et al.14 who described the phase diagram of Na3V
III
2(PO4)2F3 – Na1V IV
2(PO4)2F3 as a complex succession of biphasic reactions and solid solution domains. One important and also unexpected feature raised by this study was the assumed charge disproportionation of 2 VIV into 1 VV and 1 VIII observed at the end of the charge (i.e. after the extraction of 2 Na+ ions) for the composition Na1V
IV
2(PO4)2F3 (Na1VPF in the following). Such a charge disproportion was for instance also observed in LixV2O5,
23
whereas more generally charge separation is commonly observed in inorganic vanadium-rich compounds.24-28 Indeed the environment stabilized for vanadium, especially in oxides, changes drastically from an octahedron to a square pyramid with the oxidation state.
The fully charged composition Na1V2(PO4)2F3 is described using the Cmc21 space group which has two distinct vanadium crystallographic sites associated to VIII and VV instead of only one for the pristine material associated to VIII. This hypothesis of charge disproportionation is based on bond valence sum calculations which reveal significant different values for V(1) and V(2): +3.3 and +4.7 respectively. A description of all these features is summarized in Figure 1, with a comparison between Na3V
III
2(PO4)2F3 and Na1V IV
2(PO4)2F3 that emphasizes especially the vanadium environments of these two compositions.
In order to directly investigate this proposed disproportionation reaction and thus getting a better insight on the redox processes involved during the sodium extraction from Na3V2(PO4)2F3 an
operando vanadium K-edge X-ray absorption spectroscopy (XAS) study has been performed during
vanadium oxidation state and to the local structure around the vanadium centers. The whole dataset has been analyzed using chemometrics through principal component analysis (PCA) and multivariate curve resolution (MCR). Due to the peculiar environment of the vanadium in this material and its complex behavior during oxidation, the use of linear combinations of well-chosen XAS spectra, either standards or identified compositions upon sodium extraction, turned out to be not possible. The combined use of PCA and MCR offers a blind-source separation method to process a large data set of this operando XAS experiment by expressing the data based on their similarities and differences. These methods mainly used for following in situ catalysis reaction.29-32 Note that this method has also been used to analyze lithium insertion in graphite and lithium extraction in LiFePO4 via neutron powder diffraction33 which constitutes a relevant approach to investigate the operando behavior of batteries upon cycling. 51V MAS NMR (magic-angle spinning nuclear magnetic resonance) was performed on materials obtained at the end of the charge, close to the composition Na1V
IV
2(PO4)2F3, in order to confirm the formation of the diamagnetic ion VV (t2g
0
) which is in that case the probed nucleus. By the reported results of the combined use of XAS and NMR we were then able to follow the evolution of the local electronic and structural properties as a function of Na content in operando conditions and to reveal the coexistence of VIII and VV at the end of the charge.
1. Experimental part
The Na3V2(PO4)2F3 powder sample was synthetized according to the method already described in details elsewhere.15 From the direct comparison (given in supplementary information, Figure S1) with a previous XAS study performed on Na3V2(PO4)2F3-yOy (0 ≤ y ≤ 0.5)
19
the amount of VIV defect (y) was estimated to be 0.03 in the as-prepared material. Considering the small content of defects it was neglected in the discussion of the overall mechanism.
Electrodes were prepared by mixing Na3V2(PO4)2F3 with Carbon Super P (Csp) as conductive additive and polytetrafluoroethylene (PTFE) as the binder (60:30:10 wt%). The mixture was ground in a mortar until a homogeneous film was obtained. Small pellets of 8 mm diameter and ∼300 μm thickness were used in an in situ cell already described in details elsewhere.34 The electrochemically active part of the
cell is obtained from the stacking of the positive electrode, glass fiber separators (Whatman) wetted with a 1 M solution of NaPF6 (Strem Chemical; 99%) in a mixture of ethylene carbonate and dimethyl carbonate (EC:DMC = 1:1) and sodium metal as the counter electrode. This stacking is inserted between two beryllium windows acting as X-ray-transparent current collectors. The internal pressure within the cell is applied through a spring to ensure an optimal electrical contact. The comparison of
the electrochemistry obtained in this in-situ cell is compared in Figure S2 (given in supplementary information) to that obtained in classical coin cells, excellent reproducibility was obtained.
Vanadium K-edge XAS measurements were collected in the fluorescence mode at the CLÆSS beamline35 of the ALBA Synchrotron (Barcelona, Spain) using a single channel silicon drift detector. The synchrotron radiation of a wiggler source was monochromatized by means of a Si(111) double crystal monochromator. Rh-coated collimating and toroidal mirrors were used to optimize the energy resolution and to reject higher harmonics and to control the beam size at the sample position (0.7 x 1.5 mm2). The calibration of the monochromator was performed by measuring the spectrum of a vanadium metal foil in transmission mode. The absolute energy reproducibility of the measured spectra was ± 0.1 eV. The incoming energy resolution around the vanadium K-edge can be estimated below 0.4 eV. The incoming and, in the case of calibration, outcoming flux have been measured by customized ionization chambers. During the electrochemical cycle, 200 individual spectra were recorded in continuous mode (around 4 min per spectrum) in the XANES (X-ray Absorption Near-Edge Structure) region of vanadium K-edge (5465 eV) with equidistant energy steps of ΔE = 0.2 eV.
First of all, the operando XANES spectra were normalized to the atomic absorption estimated by a linear fit to the data in the EXAFS (Extended X-ray Absorption Fine Structure) region after a pre-edge linear background subtraction. To increase the signal-to-noise ratio the scans were merged in bunches of 5 which give a total of 40 spectra representing the complete charge. Then the data were globally analysed using a statistical tool named PCA using the computer program Matlab.36 PCA is a chemometric factor analysis tool generally used to discover the minimal particular structures in multivariate spectral data sets. Here it allows to determine the number of independent component contributing to the whole series of collected spectra during the electrochemical cycling. The number of principal components determined was then used as the basis for Multivariate Curve Resolution-Alternating Least Squares (MCR-ALS) analysis.37-38 This algorithm allows the stepwise reconstruction of the spectral components which is necessary for interpreting the whole set of operando spectra. The same electrochemical setup, using classical cells and without binder, was used to prepare the deintercalated compositions near Na1VIV2(PO4)2F3. The cells were charged in galvanostatic mode at a C/20 rate up to 4.3 V vs Na+/Na, and maintained at this voltage for several hours (C rate is corresponding to the exchange of one electron per hour per mole of compound). The materials as obtained were subsequently washed in DMC to remove any traces of the electrolyte salt and then dried in vacuum. The so-obtained powders were stored under inert atmosphere and subsequently characterized by capillary synchrotron XRD and 51V MAS NMR. The ex situ characterization of the phase pure Na1V2(PO4)2F3 is difficult due to its lack of stability because of its high equilibrium potential. It is revealed by the presence, as a secondary phase, of the more reduced composition
Na1.3V2(PO4)2F3 already identified in a previous work. 14
Its presence as a secondary phase is not an issue since it does not prevent the detection of the possible VV signature in the major phase Na1VPF. High resolution Synchrotron powder X-ray diffraction (SXRD) data were collected using the MSPD diffractometer at ALBA (Barcelona, Spain). The powders were placed in a 0.5 mm diameter capillary and data recorded in Debye-Scherrer geometry with a wavelength of 0.9540 Å in the 2θ angular range of 1 – 70 ° with a 0.005 ° step and an accumulation time of 6 minutes.
51
V MAS NMR spectra were recorded on a Bruker Avance III 500 MHz spectrometer (131.5 MHz resonance frequency for 51V) using a standard Bruker 2.5 mm MAS probe with a 30 kHz typical spinning frequency. The recycle time D0 = 0.2 s is long enough to avoid T1 saturation effects. The baseline distortions resulting from the spectrometer dead time (5-10 µs) were removed computationally using a polynomial baseline correction routine. α-VOPO4 with a single V site that exhibits a signal located at -765 ppm39 was used as secondary reference.
2. Results and discussion
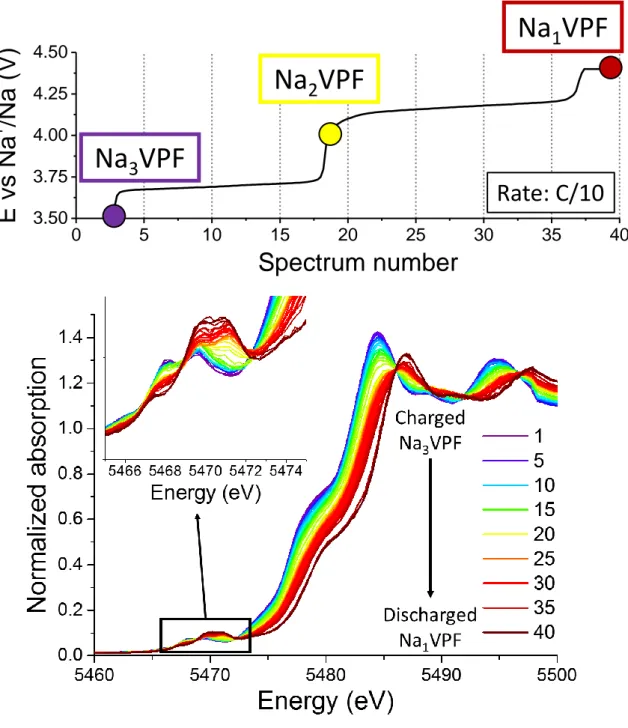
Figure 2 displays the electrochemical data obtained during the operando XAS experiment at the rate
of C/10 up to 4.4 V vs. Na+/Na as a function of the number of normalized collected spectra. The so-obtained electrochemical curve is identical to those already reported in previous studies.14-15 Figure 2 displays also a series of selected XAS spectra obtained during the charge between Na3V
III
2(PO4)2F3 (Na3VPF - purple line) and Na1V
IV
2(PO4)2F3 (Na1VPF - brown line). The inset focuses on the pre-edge region.
Vanadium K-edge XANES exhibits several features as already largely testified by experimental and theoretical studies.40-42 The main absorption edge, at around 5485 eV, is related to the valence state of the transition metal and corresponds to the strong contribution of the 1s → 4p dipole allowed transition. The weak pre-edge contributions around 5470 eV, arise from 1s → 3d forbidden quadrupolar transitions that become allowed by orbital 3d-p hybridizations.40 Both energy positions and intensity distributions of the pre-peak signals are linked to the electronic structure and the local structural environment of the probed element.
Firstly, the overall 2.5 eV shift of the main absorption edge towards higher energy from Na3V
III
2(PO4)2F3 (around 5484.5 eV) to Na1V IV
2(PO4)2F3 (around 5487 eV) is consistent with an increase of the vanadium average oxidation state. Pre-edge lines are complex to identify and attribute precisely since there are several contributions all along the electrochemical oxidation of NVPF. It can be stated however that their evolution is consistent with the increase of vanadium oxidation state since the contributions at higher energy are growing and the overall integrated intensity is increasing. In
fact, an increase of the contribution at higher energy can be ascribed to a progressive modification/distortion of the local symmetry40 that leads to an increasing 3d-4p orbital mixing, that means a larger overlap of the 3d vanadium orbitals with the 2p oxygen orbitals. This mixing enhances the theoretically forbidden 1s → 3d transition, inducing an increase in the pre-edge intensity.43
During sodium deintercalation, the vanadium oxidation state is expected to increase linearly, and the absorption edge is supposed to evolve in the same way. However the energy position of the main absorption edge shows a nonlinear evolution, in a way strongly correlated to the electrochemical data. In fact, a rapid evolution is observed between spectra 17 and 20, together with the sudden increase of potential in the voltage curve (Figure 3). This particular evolution suggests that the whole set of data cannot be described as a simple linear combination of the initial and final spectra, as it could have been expected for a process characterized by the gradual vanadium oxidation from the average VIII to VIV oxidation state. In fact more complex processes seem to occur during the redox reaction suggesting unexpected local electronic rearrangements. From this finding and the impossibility to do relevant comparisons with known references due to the specific environment of vanadium in the Na3V2(PO4)2F3 framework (i.e. in V2O8F3 bi-octahedra displayed in Figure 1) data were analyzed using principal component analysis (PCA) combined with multivariate curve resolution (MCR). In order to avoid an over-interpretation of the experimental data and to extract the maximum amount of useful information from the operando XANES spectra PCA was performed on the whole dataset. In this method each spectrum is considered as an n-dimensions vector (n corresponding to the number of measured absorption points). All measured spectra form a matrix, which can be reduced to its lowest dimensionality by the use of orthogonal factor space: this factor analysis is the principal component analysis (i.e. PCA).
The first principal component has the largest initial variance, i.e., alone it takes into account as much as possible the whole set of data. The following principal components are built orthogonal to the first one, and allow the reproduction of the experimental spectra with the highest possible variance via adapted linear combinations of them. An orthogonal basis of uncorrelated components whose the dimension is less than or equal to the number of original spectra is thus obtained. In the different linear combinations which are built to reconstruct each experimental spectrum, the multiplication factors of the principal components are commonly called scores.
The variance plot obtained from PCA analysis given in Figure 4 shows rather clearly that about 99.9 % of the variance of the XANES spectra can be described using only three principal components, the residual part being supposedly due to experimental noise. A visualisation of the evolution of the respective scores comforts this hypothesis, with both shape and contribution of the first three components varying gradually through the different processes (as expected in a gradual evolution of
the studied material during oxidation) and those of the following ones changing in a totally erratic way, thus probably representing mainly experimental noise.
Even though the so-obtained principal components are only orthogonal mathematical functions and not real XANES spectra, their determination reveals the number of independent spectral components that can be used to fit the whole set of experimental data. Several methodologies are then available to reconstruct the corresponding real XANES components as well as their evolution such as the MCR-ALS (Multivariate Curve Resolution - Alternating Least Squares) analysis tool.37-38 A detailed description of this method from a theoretical point of view is given by Tauler et al.44-45 who was the first to propose this method for the analysis of in situ spectroscopic data. On the other hand, the intrinsic limits of the application of this method are discussed in ref.46 In this work, the MCR-ALS analysis was performed by applying the following constraints for both spectral components and their respective concentrations, in order to reproduce a physically and chemically meaningful behavior: (i) non-negativity of the concentrations of the components, (ii) unimodality for one of the three components (only a single highest value of concentration) and (iii) closure (sum of the 3 components always equal to 100% of the intensity). MCR-ALS method converged after 25 iterations with a variance of 99.998 %.
As a result, the three XANES spectra shown in Figure 5 were obtained together with the evolution of their concentration along the electrochemical reaction path. According to the evolution of their relative concentrations, the three XANES spectra can be described as follows: the first component (C1) corresponds to the pristine electrode material Na3V
III
2(PO4)2F3 and the third component (C3) to the desodiated material Na1V
IV
2(PO4)2F3 obtained at the charged state. However the second component (C2) seems to be an intermediate component since it cannot be identified as a given composition. Concerning the evolution of their relative intensities, on the first voltage plateau it appears that C1 is continuously decreasing while C2 is increasing. On the other hand once the voltage jump is reached C3 starts growing while both C1 and C2 decrease gradually.
The XANES spectra extracted from the MCR-ALS analysis are in good agreement with the observations made considering the quantitative evolutions of the components: C1 and C3 are, as expected, almost identical to the first (number 1) and the last (number 40) operando measured XANES spectra, respectively. Since C2 never reaches 100 % of the relative quantity it cannot be identified with a measured spectrum. Comparing the absorption energy of the main edge jump obtained for each component, 5484.5 eV for C1, 5485.8 eV for C2 and 5486.9 eV for C3, it appears that it evolves linearly as a function of the oxidation state of vanadium, as expected, if the component C2 represents a composition with an average oxidation state between VIII and VIV, very close to V+3.5. Besides, during the first voltage plateau only VIII and VIV are expected to be present, so C2 can reasonably be ascribed to a mixture of about 50 % of VIII and 50 % of VIV. Assuming these
hypotheses, i.e. an average oxidation state of +3 for C1, +3.5 for C2 and +4 for C3, the overall average oxidation state which can be calculated from the relative quantities evolution is compared in Figure 6 to the actual oxidation state expected from the electrochemical experiment. It shows a rather good agreement despite a small deviation from the theoretical oxidation state given by the straight blue line. It is worth noticing that the evolution of the three components is much more simple compared to the complex phase diagram previously reported by Bianchini et al.14 that revealed complex structures showing for some of them commensurate modulations and thus complex charge and/or ionic rearrangements upon sodium extraction. Considering the peculiar framework whose basic units are the V2O8F3 bi-octahedra linked to each other by phosphates (see Figure 1), and that each vanadium has another vanadium in its local environment (V-V interatomic distance within V2O8F3 bi-octahedron: 3.96 Å), and only one (as the next V-V distance is: 4.73 Å), it is reasonable to assume that the components obtained here which are associated to local environments seen by XAS reflect the local pair arrangement. The three components can thus be expressed by the local pair arrangements VIII-VIII for C1, VIII-VIV for C2 and VIV-VIV for C3 (or VIII-VV in case of charge disproportionation) within vanadium bi-octahedron.
The pre-edge show four main contributions observed at 5466, 5468, 5469.5 and 5471 eV with different relative intensities along sodium deintercalation. As no fully relevant standards were found, it was difficult to give a full interpretation for each of the contribution. Nevertheless the increase from C1 to C3 of the whole pre-edge integrated intensity and the shift towards higher energies of the average energy position are in agreement with the decrease of the number of d electrons in the vanadium electronic configuration and to the increasing distortion of the octahedral coordination of the vanadium centres, thus with an increasing probability of the 1s to 3d transitions.
In Figure 7 we report the measured absorption pre-peak, the corresponding MCR calculated one and their corresponding difference. Considering the residues of the difference between the measured and the calculated data, they are subtle but still observable within the pre-edge. They could be attributed to slight modifications of the components along the reaction that are too small to be taken into account by the PCA as well by the MCR analysis. This could be responsible for the small deviation from the actual oxidation state mentioned before and shown in Figure 6, this limited “discrepancy” highlighting the accuracy of this mathematical analysis.
Nevertheless at this point of the study there is no clear proof of the presence of VV in the material. Comparing the spectrum obtained previously by Serras et al.47 at the end of the charge for the compound Na1V2(PO4)2F1.4O1.6 (showing an average oxidation state of +4.5 and thus a non-negligible amount of VV) gives only indirect but already interesting information. In this case the presence of the VV is mainly associated to the growth of a peak around 5471 eV in the pre-edge region. In our case, as depicted in Figures 2 and 5 a similar phenomenon is observed as a peak at 5471 eV rises concomitant
with the appearance of C3 which might indicate that the charge disproportionation is occurring at the first voltage jump from the extraction of the second Na+ ion. It is interesting to notice, that there is a delay in the apparition of the peak at 5471 eV in the spectra calculated using the MCR components compared to the experimental ones. This observation could explain the slightly lower average oxidation state of vanadium found by MCR compared to the one expected from electrochemistry. In order to ensure the presence of VV ions in the fully oxidized compound 51V MAS NMR was used. Indeed, NMR signals have been observed by high resolution MAS NMR at room temperature only for compounds contained diamagnetic VV ions as observed for α-VOPO4 that was used as secondary reference.48 Firstly, in order to assess the quality of the compound measured by 51V MAS NMR, a SXRD pattern was preliminary collected in a sealed capillary to prevent contact with ambient air. SXRD data of the near fully charged material were analyzed by Rietveld refinement using Cmc21 and
I4/mmm space groups to describe Na1VPF and Na1.3VPF respectively as displayed in Figure 8. This material is composed of 63 % of Na1V
IV
2(PO4)2F3 and 27 % of Na1.3V2(PO4)2F3 and its corresponding 51
V NMR MAS spectra are compared to those of Na3V2(PO4)2F3, and α-VOPO4. In agreement with literature α-VOPO4 exhibits a single narrow signal (-765 ppm) and a set of spinning side bands.
39 The absence of significant quadrupolar second-order lineshape indicates that the quadrupolar interaction is moderate.
No signals were observed for 51V in Na3V III
2 (PO4)2F3, as expected. The NMR spectrum shows however, some residual spinning sidebands of 23Na MAS NMR signal, as the sodium (23Na) and vanadium (51V) resonance frequencies are very close 132.3 and 131.5 MHz respectively. For the charged compound composed of 63 % of Na1V2(PO4)2F3 and 27 % of Na1.3V2(PO4)2F3, the spectrum exhibits clearly signals located in the [-650, -850] ppm region and their corresponding spinning sidebands. These signals are assigned to V5+ ions present in the charged compound. The signal located around -680 ppm may be assigned to V5+ in Na1V2(PO4)2F3 which is the major phase present and the others to V5+ ions in Na1.3V2(PO4)2F3 that may exhibit different environments versus Na
+ .
The presence of VV in the near charged state of the battery indicates that VV has to be considered in the redox processes. As previously proposed by Bianchini et al.,14 charge disproportionation really occurs and this information is contained in the third component that can be ascribed to Na1VIIIVV(PO4)2F3. The C3 quantity starts growing concomitantly with the voltage jump indicating that a partial charge disproportionation occurs from the average composition Na2V
III
VIV(PO4)2F3. In summary a possible explanation can be given if V2O8F3 bi-octahedra within this peculiar framework is considered to be one entity. During the first voltage plateau it is easier to oxidize VIII-VIII rather than a VIII-VIV entity whence the formation of VIII-VIV pairs up to reach Na2V
III
VIV(PO4)2F3 (i.e. average oxidation state +3.5). Once the Na2V
III
VIV(PO4)2F3 configuration is reached further sodium extraction (i.e. oxidation) leads to the formation of VIII-VV pairs. The appearance of the charge disproportionation
at this point of the charge is likely due to the fact that the structure does not allow the formation of VIV-VIV pair in V2(PO4)2F3 bi-octahedra.
Conclusion
Based on structural observations it has been proposed by Bianchini et al. that a charge disproportionation of 2VIV into VIII and VV occurs in Na1V
IV
2(PO4)2F3. 14
In this study 51V MAS NMR has confirmed the presence of the diamagnetic ions VV in the near fully deintercalated materials supporting that the charge disproportionation actually occurs. Furthermore, operando vanadium K-edge XANES study has shown that this phenomena does not occur only at the end of the charge, but immediately after the extraction of one Na+ ion i.e. after reaching the composition Na2V
III
VIV(PO4)2F3. One way to understand this feature is to consider the bi-octahedra, and not the octahedra, as the basic structural unit. This peculiar geometry combined with mixed valence seems to allow electronic exchanges that induce original configurations. The characterization of these electronic exchanges is crucial in order to establish the groundwork required to fully understand the sodium extraction/insertion mechanism combined with electronic properties in this compound and might be extended to other related compounds having this bi-octahedron geometry with the composition V2(PO4)2F3-xOx
Supporting Information
Comparison of XAS spectra for Na3V2(PO4)2F3-yOy (0 y 0.5) and electrochemical results obtained in in-situ cells and in classical coin cells
Acknowledgments
The authors thank Matteo Bianchini (ILL/LRCS/ICMCB) for his technical assistance and fruitful discussions, also C. Marini and W. Olszewski at CLÆSS beamline at ALBA (Barcelona, Spain) for their help while preparing the XAS experiment and MSPD beamline at ALBA for Synchrotron X-ray diffraction, and G. Gachot (LRCS) for fruitful discussions on the electrolyte. The authors also acknowledge RS2E for the funding of TB’s postdoctoral fellowship. This project has received funding from Région Nouvelle Aquitaine, the French National Research Agency (STORE-EX Labex Project ANR-10-LABX-76-01 and SODIUM Descartes project ANR-13-RESC-0001-02), and the European Union’s Horizon 2020 research and innovation program under grant agreement No 646433-NAIADES.
References
1. Tarascon, J.-M., Is lithium the new gold? Nature chemistry 2010, 2, 510.
2. Palomares, V.; Serras, P.; Villaluenga, I.; Hueso, K. B.; Carretero-González, J.; Rojo, T., Na-ion batteries, recent advances and present challenges to become low cost energy storage systems.
Energy & Environ. Sci. 2012, 5, 5884-5901.
3. Jian, Z.; Han, W.; Lu, X.; Yang, H.; Hu, Y. S.; Zhou, J.; Zhou, Z.; Li, J.; Chen, W.; Chen, D., Superior electrochemical performance and storage mechanism of Na3V2(PO4)3 cathode for room‐temperature sodium‐ion batteries. Adv. Energy Mater. 2013, 3, 156-160.
4. Sauvage, F.; Quarez, E.; Tarascon, J.-M.; Baudrin, E., Crystal structure and electrochemical properties vs. Na+ of the sodium fluorophosphate Na1.5VOPO4F0.5. Solid State Sci. 2006, 8, 1215-1221. 5. Shakoor, R.; Seo, D.-H.; Kim, H.; Park, Y.-U.; Kim, J.; Kim, S.-W.; Gwon, H.; Lee, S.; Kang, K., A combined first principles and experimental study on Na3V2(PO4)2F3 for rechargeable Na batteries. J. Mater. Chem. 2012, 22, 20535-20541.
6. Liu, Z.-M.; Wang, X.-Y.; Ying, W.; Tang, A.-P.; Yang, S.-Y.; He, L.-F., Preparation of NaV 1-xAlxPO4F cathode materials for application of sodium-ion battery. Trans. Nonferrous Met. Soc. China
2008, 18, 346-350.
7. Chihara, K.; Kitajou, A.; Gocheva, I. D.; Okada, S.; Yamaki, J.-I., Cathode properties of Na3M2(PO4)2F3 [M= Ti, Fe, V] for sodium-ion batteries. J. Power Sources 2013, 227, 80-85.
8. Kim, H.; Shakoor, R.; Park, C.; Lim, S. Y.; Kim, J. S.; Jo, Y. N.; Cho, W.; Miyasaka, K.; Kahraman, R.; Jung, Y., Na2FeP2O7 as a promising iron‐based pyrophosphate cathode for sodium rechargeable batteries: a combined experimental and theoretical study. Adv. Funct. Mater. 2013, 23, 1147-1155.
9. Masquelier, C.; Croguennec, L., Polyanionic (phosphates, silicates, sulfates) frameworks as electrode materials for rechargeable Li (or Na) batteries. Chem. Rev. 2013, 113, 6552-6591.
10. Serras, P.; Palomares, V.; Goñi, A.; de Muro, I. G.; Kubiak, P.; Lezama, L.; Rojo, T., High voltage cathode materials for Na-ion batteries of general formula Na3V2O2x(PO4)2F3-2x. J. Mater.
Chem. 2012, 22, 22301-22308.
11. Serras, P.; Palomares, V.; Goñi, A.; Kubiak, P.; Rojo, T., Electrochemical performance of mixed valence Na3V2O2x(PO4)2F3-2x/C as cathode for sodium-ion batteries. J. Power Sources 2013,
241, 56-60.
12. Park, Y.-U.; Seo, D.-H.; Kwon, H.-S.; Kim, B.; Kim, J.; Kim, H.; Kim, I.; Yoo, H.-I.; Kang, K., A new high-energy cathode for a Na-ion battery with ultrahigh stability. J. Am. Chem. Soc. 2013,
135, 13870-13878.
13. Park, Y. U.; Seo, D. H.; Kim, H.; Kim, J.; Lee, S.; Kim, B.; Kang, K., A Family of high‐performance cathode materials for Na‐ion batteries, Na3(VO1-xPO4)2F1+2x (0≤ x≤ 1): combined first‐principles and experimental study. Adv. Funct. Mater. 2014, 24, 4603-4614.
14. Bianchini, M.; Fauth, F.; Brisset, N.; Weill, F.; Suard, E.; Masquelier, C.; Croguennec, L., Comprehensive investigation of the Na3V2(PO4)2F3-NaV2(PO4)2F3 system by operando high resolution synchrotron X-ray diffraction. Chem. Mater. 2015, 27, 3009-3020.
15. Bianchini, M.; Brisset, N.; Fauth, F.; Weill, F.; Elkaim, E.; Suard, E.; Masquelier, C.; Croguennec, L., Na3V2(PO4)2F3 revisited: a high-resolution diffraction study. Chem. Mater. 2014, 26, 4238-4247.
16. Tsirlin, A.; Nath, R.; Abakumov, A.; Furukawa, Y.; Johnston, D.; Hemmida, M.; von Nidda, H.-A. K.; Loidl, A.; Geibel, C.; Rosner, H., Phase separation and frustrated square lattice magnetism of Na1.5VOPO4F0.5. Phys. Rev. B 2011, 84, 014429.
17. Gover, R.; Bryan, A.; Burns, P.; Barker, J., The electrochemical insertion properties of sodium vanadium fluorophosphate, Na3V2(PO4)2F3. Solid State Ionics 2006, 177, 1495-1500.
18. Song, W.; Ji, X.; Wu, Z.; Zhu, Y.; Li, F.; Yao, Y.; Banks, C. E., Multifunctional dual Na3V2(PO4)2F3 cathode for both lithium-ion and sodium-ion batteries. RSC Adv. 2014, 4, 11375-11383.
19. Broux, T.; Bamine, T.; Fauth, F.; Simonelli, L.; Olszewski, W.; Marini, C.; Ménétrier, M.; Carlier, D.; Masquelier, C.; Croguennec, L., Strong impact of the oxygen content in Na3V2(PO4)2F 3-yOy (0≤y≤0.5) on its structural and electrochemical properties. Chem. Mater. 2016, 28, 7683-7692.
20. Ponrouch, A.; Dedryvère, R.; Monti, D.; Demet, A. E.; Mba, J. M. A.; Croguennec, L.; Masquelier, C.; Johansson, P.; Palacín, M. R., Towards high energy density sodium ion batteries through electrolyte optimization. Energy Environ. Sci. 2013, 6, 2361-2369.
21. Barker, J.; Gover, R.; Burns, P.; Bryan, A., Hybrid-ion a lithium-ion cell based on a sodium insertion material. Electrochem. Solid-State Lett. 2006, 9, A190-A192.
22. Barker, J.; Gover, R.; Burns, P.; Bryan, A., Li4/3Ti5/3O4‖ Na3V2(PO4)2F3: An example of a hybrid-ion cell Using a Non-graphitic Anode. J. Electrochem. Soc. 2007, 154, A882-A887.
23. Rao, K.; Pecquenard, B.; Gies, A.; Levasseur, A.; Etourneau, J., Structural and electrochemical behaviour of sputtered vanadium oxide films: oxygen non-stoichiometry and lithium ion sequestration. Bull. Mater. Sci. 2006, 29, 535-546.
24. Schindler, M.; Hawthorne, F.; Baur, W., Crystal chemical aspects of vanadium: polyhedral geometries, characteristic bond valences, and polymerization of (VOn) polyhedra. Chem. Mater. 2000,
12, 1248-1259.
25. Seo, H.; Fukuyama, H., Charge ordering and spin gap in NaV2O5. J. Phys. Chem. Solids 1999,
60, 1095-1097.
26. Nakao, H.; Ohwada, K.; Takesue, N.; Fujii, Y.; Isobe, M.; Ueda, Y.; Zimmermann, M. v.; Hill, J.; Gibbs, D.; Woicik, J., X-Ray Anomalous Scattering Study of a charge-ordered state in NaV2O5. Phys. Rev. Lett. 2000, 85, 4349.
27. Ballhausen, C. J.; Gray, H. B., The electronic structure of the vanadyl ion. Inorg. Chem. 1962,
1, 111-122.
28. Ohama, T.; Yasuoka, H.; Isobe, M.; Ueda, Y., Mixed valency and charge ordering in NaV2O5.
Phys. Rev. B 1999, 59, 3299-3302.
29. Voronov, A.; Urakawa, A.; van Beek, W.; Tsakoumis, N. E.; Emerich, H.; Rønning, M., Multivariate curve resolution applied to in situ X-ray absorption spectroscopy data: An efficient tool for data processing and analysis. Anal. Chim. Acta 2014, 840, 20-27.
30. Rochet, A.; Baubet, B.; Moizan, V.; Devers, E.; Hugon, A.; Pichon, C.; Payen, E.; Briois, V., Influence of the preparation conditions of oxidic NiMo/Al2O3 catalysts on the sulfidation ability: a quick-XAS and raman spectroscopic study. J. Phys. Chem. C 2015, 119, 23928-23942.
31. Cassinelli, W. H.; Martins, L.; Magnani, M.; Pulcinelli, S. H.; Briois, V.; Santilli, C. V., Time-resolved XAS/MS/Raman monitoring of mutual copper self-reduction and ethanol dehydrogenation reactions. RSC Adv. 2016, 6, 20453-20457.
32. Cassinelli, W. H.; Martins, L.; Passos, A. R.; Pulcinelli, S. H.; Santilli, C. V.; Rochet, A.; Briois, V., Multivariate curve resolution analysis applied to time-resolved synchrotron X-ray Absorption Spectroscopy monitoring of the activation of copper alumina catalyst. Catal. Today 2014,
229, 114-122.
33. Rodriguez, M. A.; Van Benthem, M. H.; Ingersoll, D.; Vogel, S. C.; Reiche, H. M., In situ analysis of LiFePO4 batteries: signal extraction by multivariate analysis. Powder Diffraction 2010, 25, 143-148.
34. Leriche, J.; Hamelet, S.; Shu, J.; Morcrette, M.; Masquelier, C.; Ouvrard, G.; Zerrouki, M.; Soudan, P.; Belin, S.; Elkaïm, E., An electrochemical cell for operando study of lithium batteries using synchrotron radiation. J. Electrochem. Soc. 2010, 157, A606-A610.
35. Simonelli, L.; Marini, C.; Olszewski, W.; Avila Perez, M.; Ramanan, N.; Guilera, G.; Cuartero, V.; Klementiev, K., CLÆSS: The hard x-ray absorption beamline of the ALBA CELLS synchrotron. Cogent Phys. 2016, 3, 1231987.
36. Massart, D. L.; Vandeginste, B. G. M.; Buydens, L. M. C.; Jong, S. D.; Lewi, P. J.; Smeyers-Verbeke, J., Handbook of Chemometrics and Qualimetrics: Part A. 1997, 1-867.
37. Jaumot, J.; de Juan, A.; Tauler, R., MCR-ALS GUI 2.0: New features and applications.
Chemometr. Intell. Lab. 2015, 140, 1-12.
38. Jaumot, J.; Gargallo, R.; de Juan, A.; Tauler, R., A graphical user-friendly interface for MCR-ALS: a new tool for multivariate curve resolution in MATLAB. Chemometr. Intell. Lab. 2005, 76, 101-110.
39. Siegel, R.; Dupré, N.; Quarton, M.; Hirschinger, J., 51V magic angle spinning NMR in VOPO4 phases. Magn. Reson. Chem. 2004, 42, 1022-1026.
40. Wong, J.; Lytle, F.; Messmer, R.; Maylotte, D., K-edge absorption spectra of selected vanadium compounds. Phys. Rev. B 1984, 30, 5596.
41. Poumellec, B.; Kraizman, V.; Aifa, Y.; Cortes, R.; Novakovich, A.; Vedrinskii, R., Experimental and theoretical studies of dipole and quadrupole contributions to the vanadium K-edge XANES for VOPO4⋅2H2O xerogel. Phys. Rev. B 1998, 58, 6133.
42. Wu, Z.; Xian, D.; Hu, T.; Xie, Y.; Tao, Y.; Natoli, C.; Paris, E.; Marcelli, A., Quadrupolar transitions and medium-range-order effects in metal K-edge x-ray absorption spectra of 3d transition-metal compounds. Phys. Rev. B 2004, 70, 033104.
43. Salem, S.; Chang, C.-N.; Nash, T., Energy shift and structure of the K-absorption edge of vanadium in some vanadium compounds. Phys. Rev. B 1978, 18, 5168.
44. Tauler, R., Multivariate curve resolution applied to second order data. Chemometr. Intell. Lab.
Syst. 1995, 30, 133-146.
45. De Juan, A.; Tauler, R., Chemometrics applied to unravel multicomponent processes and mixtures: revisiting latest trends in multivariate resolution. Anal. Chim. Acta 2003, 500, 195-210. 46. Ruckebusch, C.; Blanchet, L., Multivariate curve resolution: a review of advanced and tailored applications and challenges. Anal. Chim. Acta 2013, 765, 28-36.
47. Serras, P.; Palomares, V. lonso, . harma, N. pe del mo, J. M.; Kubiak, P.; Fdez-Gubieda, M. L.; Rojo, T. f., Electrochemical Na extraction/insertion of Na3V2O2x(PO4)2F3-2x. Chem.
Mater. 2013, 25, 4917-4925.
Figure captions
Figure 1: Cristal structures of Na3V2(PO4)2F3 and Na1V2(PO4)2F3 with PO4 in green, VO4F2 octahedra in blue and Na atoms in red. In Na1V2(PO4)2F3 significant different vanadium environments are highlighted with light and dark blue corresponding to regular and distorted environments respectively.
Figure 2: Top: voltage as a function of the spectrum number and corresponding to the galvanostatic
charge obtained at C/10 during operando XAS data collection. Bottom: operando vanadium K-edge XANES spectra collected during the charge. The inset is focused on the pre-edge region.
Figure 3: Left: voltage (black line) as a function of the spectrum number and corresponding to the
galvanostatic charge obtained at C/10 during operando XAS data collection with the associated 1st derivative (blue line). Right: 2D projection of operando vanadium K-edge XANES spectra collected during the charge and emphasizing discontinuities at voltage jumps.
Figure 4: Variance plot of PCA analysis. Evolution of the scores of the 6 first components.
Figure 5: Top: three components extracted from MCR analysis. The inset is focused on the pre-edge
region. Bottom: evolution of the relative quantities of the three principal components compared with the experimental electrochemical data (black solid line).
Figure 6: Experimental electrochemical curve (black solid line) associated to the expected oxidation
state (blue solid line). The blue dotted line represents the oxidation state calculated from the relative quantities of the three components associated with their observed oxidation state: C1 = +3; C2 = +3.5 and C3 = +4.
Figure 7: 2D projection of operando vanadium K-edge XANES spectra of the pre-edge – Top:
measured data – Middle: reconstructed data from MCR analysis – Bottom: difference between the measured data and the reconstructed data.
Figure 8: Top: Rietveld refinement of the electrochemically oxidized compound using Cmc21 and I4/mmm space groups for Na1VPF and Na1.35VPF respectively. Bottom: 51V MAS NMR spectra NMR of the electrochemically oxidized compound (red line), of the pristine material Na3VPF (purple line) and of VVPO4O (green line).
Figure 1
Na(1) Na(2) Na(3)
V(1)
Na(1)
V(1)
V(2)
F(1)
F(2)
F(1)
1.97 Å
1.98 Å
F(3)
F(2)
F(1)
1.87 Å
1.88 Å
2.00 Å
1.75 Å
2V
3+
(t
2g
2
e
g
0
)
2V
4+(t
2g1e
g0)
or
1V
5+(t
2g0e
g0) and 1V
3+(t
2g2e
g0)
Na
3
V
2
(PO
4
)
2
F
3
- Space group: Amam
Figure 2
0 5 10 15 20 25 30 35 40 3.50 3.75 4.00 4.25 4.50E
vs Na
+/Na (
V
)
Spectrum number
Na
3
VPF
Na
2
VPF
Na
1
VPF
Rate: C/10
Figure 3
Please this figure has to be a two columns figure
Na3VPF
Na2VPF
Figure 4
0 5 10 15 20 10-5 10-4 10-3 10-2 10-1 100 101 102Number of component
Variance plot
0 10 20 30 40 -0.162 -0.160 -0.158 -0.156 -0.154PC1
0 10 20 30 40 -0.2 0.0 0.2 0.4PC2
0 10 20 30 40 -0.4 -0.2 0.0 0.2PC3
0 10 20 30 40 -0.4 -0.2 0.0 0.2 0.4PC4
Spectrum number
0 10 20 30 40 -0.4 -0.2 0.0 0.2 0.4PC5
0 10 20 30 40 -0.4 -0.2 0.0 0.2 0.4PC6
Figure 6
0
5
10
15
20
25
30
35
40
3.0
3.2
3.4
3.6
3.8
4.0
4.2
4.4
Expected oxidation state Calculated oxidation state with C1 = +3 ; C3 = +4 and C2 = +3.5