HAL Id: hal-01999063
https://hal.archives-ouvertes.fr/hal-01999063
Submitted on 30 Jan 2019HAL is a multi-disciplinary open access archive for the deposit and dissemination of sci-entific research documents, whether they are pub-lished or not. The documents may come from teaching and research institutions in France or abroad, or from public or private research centers.
L’archive ouverte pluridisciplinaire HAL, est destinée au dépôt et à la diffusion de documents scientifiques de niveau recherche, publiés ou non, émanant des établissements d’enseignement et de recherche français ou étrangers, des laboratoires publics ou privés.
On the importance of Incorporating Explicit
3D-Resolved Electrode Mesostructures in Li–O2 Battery
Models
Amangeldi Torayev, Pieter C. M. M. Magusin, Clare P. Grey, Céline Merlet,
Alejandro A. Franco
To cite this version:
Amangeldi Torayev, Pieter C. M. M. Magusin, Clare P. Grey, Céline Merlet, Alejandro A. Franco. On the importance of Incorporating Explicit 3D-Resolved Electrode Mesostructures in Li–O2 Battery Models. ACS Applied Energy Materials, ACS, 2018, 1 (11), pp.6433-6441. �10.1021/acsaem.8b01392�. �hal-01999063�
OATAO is an open access repository that collects the work of Toulouse researchers and makes it freely available over the web where possible
Any correspondence concerning this service should be sent
This is an author’s version published in: http://oatao.univ-toulouse.fr/21670
To cite this version:
Torayev, Amangeldi and Magusin, Pieter C. M. M. and Grey, Clare P. and Merlet, Céline and Franco, Alejandro A. Importance of Incorporating Explicit
3D-Resolved Electrode Mesostructures in Li–O2 Battery Models. (2018) ACS
Applied Energy Materials, 1 (11). 6433-6441. ISSN 2574-0962
On the Importance of Incorporating Explicit
3D-resolved Electrode Mesostructures in Li-O
2
Battery
Models
Amangeldi Torayev 1,2,3, Pieter C. M. M. Magusin 2,3, Clare P. Grey 2,3, Céline Merlet 3,4,5, Alejandro A. Franco 1,3,4,6
1 Laboratoire de Réactivité et Chimie des Solides (LRCS), UMR CNRS 7314, Université de
Picardie Jules Verne, HUB de l’Energie, Rue Baudelocque, 80039 Amiens, France
2 Department of Chemistry, University of Cambridge, Lensfield Road, Cambridge CB2 1EW,
United Kingdom
3 ALISTORE-European Research Institute, FR CNRS 3104, HUB de l’Energie, Rue Baudelocque,
80039 Amiens, France
4 Réseau sur le Stockage Electrochimique de l'Energie (RS2E), FR CNRS 3459, HUB de l’Energie,
Rue Baudelocque, 80039 Amiens, France
5 CIRIMAT, Université de Toulouse, CNRS , Bât. CIRIMAT, 118, route de Narbonne 31062
Toulouse cedex 9, France
AUTHOR INFORMATION
Corresponding Author: alejandro.franco@u-picardie.fr
ABSTRACT.
Lithium-oxygen batteries are attractive for reversible energy storage because of their theoretically high capacities. Practically, high capacities are challenging to achieve due to key issues such as the transport and growth of the Li2O2 discharge product. Numerous carbon-based cathode
mesostructures have been studied experimentally and computationally aiming to reach higher capacities. One-dimensional continuum models are widely used to study the discharge capacities of electrode mesostructures. Here, we investigate the capabilities and shortcomings of such models to represent different electrode mesostructures, Li2O2 growth mechanisms, and their impact on the
discharge performance by comparing them to pore network models which consider an explicit representation of the three-dimensional pore mesostructure. The continuum model can accurately predict discharge capacities when the discharge products grow through surface mechanism, but fails to provide reasonable results when this growth includes a solution mechanism. Conversely, the pore network model results are in agreement with experiments. We attribute the better accuracy of the pore network model to a more accurate representation of the electrode mesostructures, particularly the explicit consideration of the pore interconnectivity. The pore network model allows us to reconcile, within a single theoretical framework, the scattered correlations between discharge capacity and electrode mesostructure descriptors reported in the literature.
KEYWORDS. Li-O2 battery, Pore interconnectivity, Continuum model, Pore Network Model,
Li2O2 growth mechanism, Pore size distributions.
1. Introduction
Aprotic lithium-oxygen (Li-O2) batteries are promising candidates for electrochemical energy
storage systems due to their theoretically high gravimetric capacity (1168 mAh.gLi2O2-1).1–3
Tremendous research efforts have been devoted to understand the underlying principles and limitations of these systems in order to improve their practical capacity. A Li-O2 battery consists
of a negative electrode (the anode, often made of Li-metal), a lithium ion conducting electrolyte and a porous positive electrode (the cathode) exposed to air or pure oxygen gas. During discharge, lithium ions migrate from the negative electrode to the positive electrode, and react with oxygen in the positive electrode to form solid discharge products, predominantly Li2O2. On charge, Li2O2
discharge products decompose and form Li+ and O
2 species. Lithium ions migrate back to the
anode and are reduced. O2 molecules are released back to the oxygen gas source. Processes taking
place in the cathode of Li-O2 batteries are the main focus of research since this is where most of
the performance limiting phenomena occur. These include the oxygen reduction reaction, the formation of discharge products on discharge, their subsequent decomposition on charge, and most of the parasitic and degradation reactions.2 The role of the positive electrode is to conduct the
porous carbons are usually favored as they are cheap and easy to synthesize. Cathode mesostructure plays a vital role in determining the Li-O2 cell performance.
Correlations between the structural properties of some carbons and their discharge capacities have been examined in a number of works. Here, we briefly outline some of the experimental results published on the topic. Meini et al. compared discharge capacities of several carbon black type electrodes (Timcal Super C65, Vulcan XC72, Ketjenblack EC600JD, Black Pearls 2000) and obtained larger discharge capacities for the electrodes with larger carbon surface areas (CSA).4
Ding et al. measured the discharge capacities of various carbon blacks, mesoporous carbons, multi-walled carbon nanotubes and reduced graphene oxide.5 Their study showed that the
discharge capacity is positively correlated with the pore size but they did not establish any clear correlation between the discharge capacity and the CSA or the pore volume. In the same study, Ding et al. synthesized several electrodes with different pore sizes via silica templating to confirm that the observed differences are not due to different precursors or carbonization temperatures. The silica templated carbons also showed a pore size dependence of the discharge capacities. Comparable results were obtained by Zeng et al., using two electrodes with similar morphology and wettability but different average pore sizes.6 However, Kuboki et al. observed a stronger
correlation between the discharge capacity and the electrode pore volume.7 In their study, they
compare four different carbon electrodes, two made of activated carbons and two made of conductive carbons, and show that a large mesopore volume is a vital feature for increasing the cell capacity. Numerous alternative electrode architectures and designs have also been investigated to boost the cell performance such as carbon aerogels,8 graphene based electrodes6,9 and carbon
i) a large CSA for electrochemical reactions to occur and discharge products to deposit on;
ii) large pores to enhance the transport of active species and prevent pore clogging;
iii) a large porosity to allow for the growth of discharge products;
All these criteria have to be met while maintaining a good electronic conductivity and a good mechanical stability which usually decrease when increasing the porosity.
Modeling techniques have proven to be helpful in studying electrode performances, downfalls and proposing better designs to enhance cell performance.11,12 Cell level continuum models (CM) are
especially attractive since they allow for the calculation of observables similar to those measured in electrochemical and microscopy experiments. For instance, Albertus et al. developed a cell level CM which includes oxygen transport, discharge product growth and its resistance in porous electrodes to identify the capacity limiting parameters.13 The authors showed that high current
densities lead to the emergence of oxygen concentration and discharge product gradients along the electrode thickness. Their simulations suggest that without CSA passivation, discharge capacities can be increased significantly, from around 300 mAh.g-1 to above 7,000 mAh.g-1. Indeed, when a
thin film of about 7-10 nm of Li2O2 is formed on the carbon surface, it becomes passivated, i.e.
the insulating layer blocks electron transfer from the conductive carbon to the electrochemical reaction sites.14 Using a different approach, Xue et al. simulated cell voltage profiles for Super P
and Ketjen Black electrodes and compared two different resistance scenarios for the passivation process, namely a tunneling limited model, where the Li2O2 layer is assumed to be perfect insulator
model, where resistance of the Li2O2 layer increases linearly with the deposit thickness.15 The
simulations for the two passivation processes predict that for the tunneling limited process, the cell voltage shows a long plateau followed by a sharp decline, whereas the linear resistance model induces a gradual decrease of the cell voltage. We note that these potential profile evolutions as a function of discharge product resistance have also been reported in prior works.13,16 In their model,
oxygen transport, Li2O2 film growth and electrode pore size distributions are captured. The authors
show superior performance for Ketjen Black compared to Super P electrode owing to its high CSA. Later, Xue et al. extended their model to consider the influence of the electrolyte donor number on the discharge performance.17 The improved model assumes a competition between the Li
2O2
thin film formation mechanism and the formation of a large Li2O2 particles in a hall (pore size of
several micrometers) driven by a solution phase mechanism. A control parameter, called escape function in that work, allows for the determination of the relative weight of each mechanism on the calculated discharge performance. The model allows to capture the fact that the use of high donor number solvents, stabilizing LiO2, mitigates the CSA passivation and improves the
electrochemical performance in good correlation with experiments.18
On the experimental side, the majority of the recent research in the field focuses on promoting a solution mechanism, and the formation of large discharge particles. Indeed, the insulating nature of Li2O2 restricts the discharge capacity in the case of the surface mechanism, i.e. the formation of
a thin film. When the solution mechanism is predominant, discharge products can fill the pore volume more efficiently, which slows down the passivation and results in more persistent electrochemical reactions along discharge. Several mediators have been tested and demonstrated to promote the solution mechanism. For example, Lim et al. analyzed several redox mediators including tetrathiafulvalene, N,N,N’,N’-tetramethyl-p-phenylenediamine and lithium iodide.19
Gao et al. showed that using 2,5-di-tert-butyl-1,4-benzoquinone, the discharge capacity of gas diffusion electrodes can increase by one to two orders of magnitude.20 Aetukuri et al. and Liu et al.
reported that introducing trace amounts of H2O in the electrolyte results in larger Li2O2 particle
sizes and hence higher discharge capacities can be achieved.21,22
For modeling approaches to help us to identify better battery components, they need to capture the effect of the surface and solution mechanisms effectively. CMs are suitable for capturing the surface passivation effect because it is straightforward to describe a tunneling limited growth with an analytical function.15 However it is not straightforward to describe the transport limitation
effect. For this, a mean field approach is usually adopted in which the interconnectivity of the pores is characterized with a tortuosity factor. In this case, the tortuosity (𝜏) is defined as an input parameter of the models and given as a function of the porosity (𝜀)
𝜏 = 1 𝜀⁄ 𝜎 (1)
where 𝜎 is a correlation factor. In most of the CM, the widely known Bruggeman relation, corresponding to 𝜎 = 0.5, is used.23 This empirical relation works well for an ideal system of
spherical particles with sizes following a Gaussian distribution. Nevertheless, it is not suitable to represent non-ideal systems,24 which is the case for the porous electrodes used in the context of
Li-O2 batteries. The formation of Li2O2 discharge products in the pores can lead to clogging and
decreased interconnectivity between the pores in an anisotropic manner due to anisotropic formation of discharge products, i.e. gradient of discharge products along electrode thickness. This cannot be captured in a continuum mean field approach where the pore interconnectivity is not described explicitly in three dimensions. In these continuum approaches, the pore size distributions are used to calculate active surface area for electrochemical reactions to take place, and then this affects the amount of discharge products that are formed; then that in turn leads to a reduction of
porosity which will affect the effective diffusion coefficients. Simply put, there is no direct, explicit relation between pore size distribution and effective diffusion coefficient. We thus hypothesize that neglecting the three-dimensional character of the pore network and the pore interconnectivity can lead to erroneous performance prediction and it is this hypothesis that we propose to investigate here. We start by presenting the different computational techniques adopted in this work. Then, we demonstrate the importance of the pores interconnectivity based on a conceptual analysis of three dimensionally-resolved electrode images. Next, we report a comprehensive study by comparing the simulation capabilities of a typical 1D continuum model17
with our recently developed 3D pore network model (PNM)25 to identify the capacity limiting
factors in Li-O2 cathodes. Finally, we conclude and discuss the main implications of this work.
2. Computational methods
2.1 Common features between the continuum and the pore network models
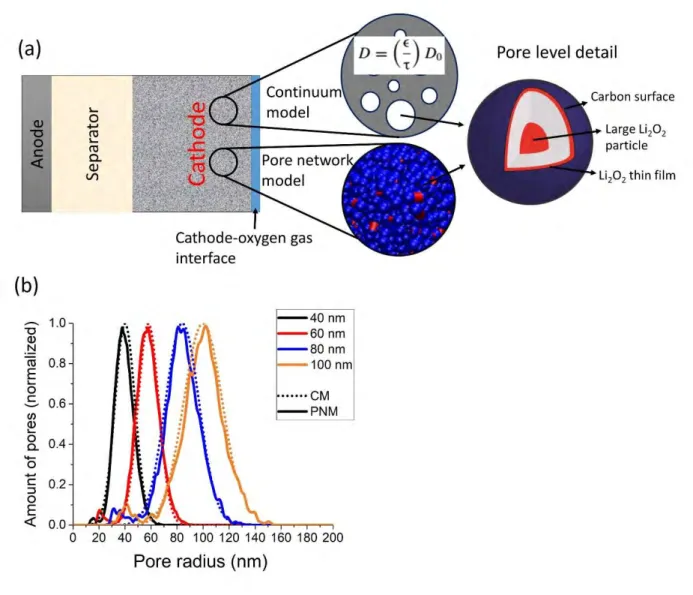
In order to compare the CM and the PNM methods, they need to share a number of similarities which are described below. A modeling scheme is shown in Figure 1.a. In this work, we focus on the processes happening in the cathode, whereas the separator and anode are represented only to illustrate the full system. The anode/separator and cathode/oxygen gas inlet interfaces are characterized by specific boundary conditions. A constant oxygen concentration is set at the boundary between the cathode and the oxygen gas, and the oxygen flux at the boundary between the anode and the separator is set to zero. In both models, an overall electrochemical reaction is used and intermediate steps and side reactions are neglected:
2𝐿𝑖++ 𝑂2+ 2𝑒− → 𝐿𝑖2𝑂2 (2) The intermediate reactions that are involved in the overall reaction shown in Eq. 2 are
𝑂2+ 𝑒− → 𝑂2− Reduction of oxygen
𝐿𝑖++ 𝑂2− → 𝐿𝑖𝑂2 Formation of lithium superoxide
𝐿𝑖++ 𝑒−+ 𝐿𝑖𝑂2 → 𝐿𝑖2𝑂2 Formation of lithium peroxide 2𝐿𝑖𝑂2 → 𝐿𝑖2𝑂2+ 𝑂2 Disproportionation reaction Discussions on detailed reaction pathways in Li-O2 batteries can be found in a recent review
paper.26
The balance between the two types of discharge product growth mechanisms is captured through an escape factor, as introduced in our previous work.17,25 The escape factor (χ) corresponds to the
solubility of the LiO2 intermediate species in the electrolyte and its consequent contribution to the
growth of large Li2O2 particles. 𝜒 = 0 means that LiO2 molecules cannot dissolve in the electrolyte
and form only thin films on the carbon surface. 𝜒 = 1 corresponds to the other extreme, where the solubility of LiO2 is high enough that all LiO2 molecules/O2- ions contribute to the formation of
large particles. Intermediate values correspond to mixed growth mechanisms where thin film and large particles coexist.
The escape factor represents the discharge product size and how much carbon surface area it covers. Thus, it depends on many parameters. In simple terms any parameter that affects the discharge product size will also affect the value of the escape factor. High donor number electrolytes foster formation of large discharge particles thus, for example, DMSO will have a higher escape factor than TEGDME.27 The presence of mediators and trace amount of water will
mediators or water (intentionally added or present as an impurity due to improper drying) has a higher escape factor than an electrolyte consisting in a well-dried salt dissolved in a pure solvent. Additionally, the discharge rate also has an effect on the particle size, and a system which is discharged at lower current will have a higher escape factor than the same system discharged at higher rates. To quantify all these effects into a number is a daunting task, therefore in this paper the escape factor is more used as a qualitative descriptor than a well-defined value for a specific system.
Spatially, the formation of discharge products in a pore is considered as shown in Figure 1.a. The thin film forms on the entire pore surface and grows uniformly while large particles, corresponding to the solution mechanism, grow from the center of a pore. The assumption of a particle growth from the center of a pore allows us to neglect all contacts between the particle and the carbon surface, and any surface coverage of the carbon by Li2O2 through this growth mechanism. The
carbon surface is assumed to be a perfect electronic conductor when not passivated and a perfect insulator when the Li2O2 film thickness reaches 10 nm.
Figure 1. (a) Scheme of the continuum and pore network models used in this work including a representation of the Li2O2 formation mechanisms in a pore, (b) pore size distributions used in the
two types of models.
Regarding the electrode mesostructures, a 5 µm electrode thickness and a porosity of 70% are considered. This relatively small thickness was chosen because of the restrictive computational cost of the PNM method. In the case of the CM method, we have checked that increasing the thickness 20 times, i.e. using a thickness in the range of a typical experimental setup, does not change the qualitative trends observed but leads to lower capacities (Figure S1. This is the result
of the O2 transport limitation in these thicker electrodes. The performances of four different
mesostructures with average pore sizes of 40 nm, 60 nm, 80 nm and 100 nm are investigated in order to imitate the silica templated carbons tested in Ref. 5. The pore size distributions considered in this work are given in Figure 1.b. Transport equations are solved only for the oxygen species. The lithium concentration is assumed to be constant, equal to 1M, throughout the electrode. This assumption holds true since Li+ is not a limiting parameter and its concentration is much higher
than the oxygen concentration. A case study including lithium transport and its gradient along discharge is provided in SI.
2.2 Continuum model
For the continuum approach, a slightly modified version of our previously developed model is used.17 The faradaic reduction current is calculated following
𝑗𝐹𝑎𝑟 = 𝑛𝐹𝑘𝑐 {𝑒𝑥𝑝 (−𝛽𝐹(𝑈 − 𝑈0)
𝑅𝑇 ) − 𝑒𝑥𝑝 (
(1 − 𝛽)𝐹(𝑈 − 𝑈0)
𝑅𝑇 )} (4)
where 𝑛 is the number of electrons involved in the electrochemical reaction (see eq. 2), 𝐹 is the Faraday constant, 𝑘 is the reaction kinetic rate constant, 𝑐 is the oxygen concentration. 𝑅 is the universal gas constant, 𝑇 is the temperature, 𝛽 is the charge transfer coefficient, 𝑈 is the electrostatic potential of the electrode and 𝑈0 is the standard potential of the reaction. The oxygen
concentration in the cell is given by
𝜕(𝜀𝑐) 𝜕𝑡 = 𝜕 𝜕𝑥[𝜀 1.5𝐷 0( 𝜕𝑐 𝜕𝑥)] − 𝑎 ∙ 𝑗𝐹𝑎𝑟 𝑛𝐹 (5)
where 𝐷0 is the bulk oxygen diffusion coefficient and 𝑎 is the carbon surface area. The
modification made in this work is related to the growth of large particles. As discussed in the Introduction of this paper, the original model assumed that large particles grow in one single “hall” (i.e., pore) with a size of about tens of micrometers. Here, we have modified the model so that all the LiO2 intermediate species dissolved in the electrolyte stay in the pore in which they appear and
contribute to the growth of large Li2O2 particle in the center of the concerned pore. This change
implies that pore clogging through large particle formation is now possible.
2.3 Pore network model
For the PNM approach, our previously developed model is used.25 The reaction rate is calculated
following 𝑣 = 𝑘𝑓𝑎𝑓𝑒𝑥𝑝 ( −𝛽𝑛𝐹(𝑈 − 𝑈0) 𝑅𝑇 ) − 𝑘𝑏𝑎𝑏𝑒𝑥𝑝 ( (1 − 𝛽)𝑛𝐹(𝑈 − 𝑈0) 𝑅𝑇 ) (6)
where 𝑘𝑓 and 𝑘𝑏 are the forward and backward reaction rate constants; 𝑎𝑓 and 𝑎𝑏 are the activities
of 𝑂2 and 𝐿𝑖2𝑂2 respectively. The total current can then be written as
𝐼𝑡𝑜𝑡= ∑ 𝑆𝐴𝑖𝐹𝑣
𝑎𝑙𝑙𝑝𝑜𝑟𝑒𝑠
𝑖=1
(7) where 𝑆𝐴𝑖 is the surface area of pore 𝑖, which can be either a sphere (for pores) or a cylinder (for
channels connecting pores) with the surface area considered accordingly. The transport of oxygen between pores is calculated by
𝑑𝑐𝑖
𝑑𝑡 = ∑ 𝑘𝑖𝑗(𝑐𝑗− 𝑐𝑖)
𝑛𝑒𝑖𝑔ℎ𝑏𝑜𝑢𝑟𝑠
𝑗
+ 𝑠𝑖 (8)
where 𝑐𝑖 is the concentration of oxygen in the pore 𝑖 and 𝑐𝑗 is the concentration in the pores connected to 𝑖. 𝑘𝑖𝑗 is the transfer parameter between pores 𝑖 and 𝑗 which depends on 𝐷0, and 𝑠𝑖 is the sink term which is calculated according to the electrochemical reactions taking place in pore 𝑖. The input mesostructures for the PNM are generated by randomly placing spherical pores, with a specified pore radius, in a 3D volume till a porosity of 70% is reached. A 5 µm cathode thickness is chosen for this study which leads to around 5,000 pores in the PNM and makes this calculation computationally feasible. More details about the PNM can be found in our previous paper.25
2.4 Image processing
To analyze crudely the effect of a film growth on the three dimensionally-resolved electrode mesostructures, a simple image processing is carried out. Starting with an experimentally measured or artificially generated mesostructures, we expand the solid region of the image uniformly, to imitate a homogeneous thin Li2O2 film growth along discharge (Figure 2.c). The
expansion of the solid region is done in iterative steps. First, a random walker is placed in pore voxels sitting within 10% of an edge in each direction. This walker randomly tries to move to any of the six neighboring voxels provided that they are void/pore. All the pore voxels reached by the random walker which have at least one solid neighboring voxel are converted to solid voxels. This random walk approach is adopted to account for the accessibility of the different regions to Li+
and O2. In other words, a monolayer of film with thickness of a voxel size is deposited on the solid
voxels reachable by the active species are converted to solid voxels. After each deposition step, the percentage of isolated pores is calculated in a similar manner: a random walker is placed in voxels sitting within 10% of an edge in each direction, the walker randomly tries to move to any of the six neighboring voxels provided that they are pore and all pore voxels which cannot be reached by any of these random walkers are considered isolated.
3. Results and discussion
3.1 Thin film and isolated pores from image processing
To see the likelihood of formation of isolated pores and pore regions by shrinkage of the porous media along discharge, a simple tomographic image processing is carried out. Three 3D mesostructures are used: an actual tomography image of a Super P electrode (porosity = 36%) already reported in our previous paper25 and two computer generated mesostructures obtained by
randomly placing 40 nm and 100 nm pores in a solid medium till a 70% target porosity is reached. Following the homogeneous growth of a thin film, small bottlenecks connecting large pores becomes blocked and the porous media loses interconnectivity. Figure 2.b shows the evolution of the percentage of isolated pores with the porosity. For porosities larger than 30%, there is a weak dependence of the percentage of isolated pores with the porosity. On the contrary, when the porosity drops below 30%, the percentage of isolated regions increases drastically. In Figure 2.a, we represent schematically the underlying mechanism. We consider a simple case where two different pore sizes are randomly distributed in a 3D lattice. Since it is a random distribution, there will be cases where some large pores are connected to each other through smaller pores. Then when the small pores (blue spheres) get clogged, some of the interconnectivity of large pores (red
spheres) will be lost and even form isolated pores (orange sphere) that do not add to the electrode performance since they are not connected to any O2 or Li+ sources. A more likely phenomenon
before the formation of isolated pores is the path becoming more tortuous. We expect both the pore clogging and the tortuosity increase to be better described in the pore network model than in the continuum model.
Figure 2. (a) An example of randomly distributed large and small pores in a three-dimensional lattice. (b) Fraction of isolated pores calculated by applying the image processing approach on the experimentally measured Super P tomography image and two computer code generated mesostructures. (c) Schematic illustration of the image processing method used here to identify the formation and fraction of isolated pores.
3.2 Calculated discharge capacities and end of discharge for various escape factors and mesostructures
We now turn to the comparison between the PNM and the CM in which we simulate a full cathode. In both cases, the electrochemistry and the oxygen transport are described. Four electrode mesostructures, with average pore sizes of 40 nm, 60 nm, 80 nm and 100 nm, and three growth mechanisms (𝜒 = 0, 0.5, 1) are considered. Figure 3 shows the calculated discharge capacities of these cathodes for the three different particle growth mechanisms considered (only thin film formation, mixed growth, only solution phase particle growth). All the discharge capacities calculated using the CM method are larger than the ones from the PNM method. This difference comes mainly from the slower transport of O2 in PNM compared to CM. Even though we used the
same diffusion coefficient for both models, we use the one dimensional Fick’s second law in the CM while we solve a three-dimensional network of fluxes (Fick’s first law) in the PNM. This results in more important transport limitations in the PNM model, which affects the absolute values of the discharge capacities. We note that both models show higher capacities for cases where the Li2O2 growth occurs at least partially through particle growth mechanism. This is in agreement
where only thin film formation occurs. We observe that the discharge capacity is high for mesostructures with high surface area (Figure 3.a-3.c) and that pores with radius larger than the tunneling limitation distance do not get clogged. When the escape factor is 0.5 or 1, then significant differences are observed between the two models. In particular, when the growth happens only in solution, the CM gives the same capacity value for all the mesostructures.
Figure 3. Discharge capacities calculated by (a) CM and (b) PNM, for 3 escape factors and four mesostructures. The electrode thickness is 5 µm, discharge current densities are 400 µA.g-1 (i.e.
1.16 A.m-2); (c) Carbon surface areas of the pristine mesostructures; (d) Discharge capacities as a
function of the pristine carbon surface areas calculated using the PNM approach.
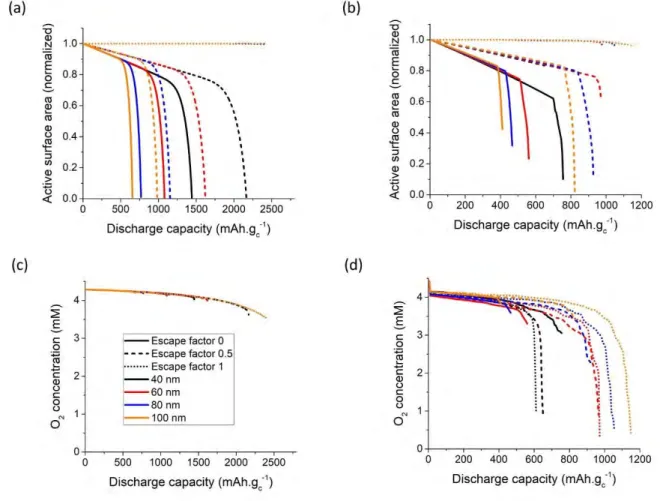
To understand the differences observed between the CM and PNM methods, we now focus on the end of discharge for all the simulated systems. The end of discharge can be either due to a transport limitation or to a lack of active carbon surface area. The carbon surface is considered active when it is both accessible to the reactants (O2 and Li+) and not passivated. Figure 4 shows the calculated
evolution of the active carbon surface area and the overall oxygen concentration in the electrodes along discharge. The capacity limiting process when 𝜒 = 0 is the surface passivation for both CM and PNM. The active surface area drops to zero at the end of discharge (Figures 4.a and 4.b). In the case of 𝜒 = 1, the end of discharge is due to transport limitation. The overall oxygen concentration drops to around 3.5 mM by the end of discharge for the CM while it decreases much more drastically in the case of the PNM (Figures 4.c and 4.d). As discussed previously, in the CM, the transport depends on the porosity and on the tortuosity which is written as a function of porosity through the Bruggeman relation. The calculated porosity changes linearly along discharge (Figure S2) as the amount of discharge products is directly proportional to the applied discharge current and the Li2O2 discharge products occupy a certain volume in the electrode. As such, the continuum
model underestimates the transport limitations in the case where the solution phase mechanism is dominant. The mixed formation (𝜒 = 0.5) is not as straightforward. The end of discharge for the mesostructures with 40 nm and 60 nm average pore sizes is due to a hindrance of oxygen transport while for the mesostructures with 80 nm and 100 nm, the surface passivation is the limiting factor.
Figure 4. The active carbon surface area evolution along discharge for (a) continuum and (b) pore network models. O2 concentration evolution along discharge for (c) continuum and (d) pore
network models. Legend and color coding are shown in (c).
We now compare our modeling results with experimental data reported in the literature. As discussed above, Ding et al. carried out an experiment in which they synthesized electrode mesostructures with 20 nm, 40 nm, 60 nm, 80 nm and 100 nm average pore sizes using a silica templating method.5 The discharge capacity trend they observed is similar to the calculated one
with our PNM with𝜒 = 1, i.e. the discharge capacity is higher for electrodes with larger pores. This result cannot be captured by the CM: an explicit 3D representation of the electrode and pore
interconnectivity is necessary. The capacities calculated by the PNM also help us to understand various seemingly conflicting trends reported in the literature. For instance, Meini et al. reported a discharge capacity increase as the CSA increases.4 As previously mentioned, Ding et al.
demonstrated that the cell capacity increases as the average pore size increases.5 Yang et al.
synthesized mesocellular carbon foam electrodes with an average pore size around 30 nm and compared their performance with electrodes made of activated carbon (pore size ~2 nm), carbon nanotubes (pore size ~10 nm) and Super P (pore size ~50 nm).28 They observed neither a capacity
dependence on the CSA nor on the pore size but the highest capacity was obtained for the electrode with a 30 nm average pore size. These experimental variations can be attributed to possible material differences in the synthesis, such as temperature treatment or precursors used, but it can also be due to different particle formation mechanisms, corresponding to different escape factor values. When we plot the PNM calculated discharge capacities for the exclusive thin film formation case (𝜒 = 0) as a function of the mesostructure surface area (Figure 3.d), we obtain a similar trend as the one reported by Meini et al.4. The escape factor depends on several parameters,
such as the solvent, the salt, the additives, the discharge current density and even the temperature. In fact, the reason why Ding et al.5 and Meini et al.4 observed different correlations between the
discharge capacity and the electrode properties, can be due to different Li2O2 growth mechanisms.
To get an idea of how different the growth mechanisms are for these two studies, we estimate an equivalent film thickness (EFT). This quantity is calculated as the volume of discharge products divided by the BET surface area of the pristine electrode. While this is a very rough estimate for a thickness of Li2O2 deposit, large values will suggest a dominant particle growth mechanism. This
is especially true for EFT above 10 nm as such film thicknesses are not reachable due to the surface passivation. Figure 5 shows the EFT for the experiments reported by Ding et al.5 and Meini et al.4.
Most of the values for Meini et al.4 are very low while values for Ding et al.5 vary a lot more from
around 1 nm to 46 nm. This suggests that the lower current density and the different electrolytes used by Ding et al.5 in their experiments would foster large particle formation, in agreement with
previous studies.29,30 Differences in the Li2O2 growth mechanisms could explain the apparently
contradicting conclusions these groups of authors made as we have shown using the PNM that the evolution of the discharge capacity with the average pore size depends quite strongly on the growth mechanism considered.
Figure 5. Equivalent film thickness for the experimental data reported in Meini et al.4 and Ding et al.,5 estimated by dividing the volume of discharge products by the BET surface area of
the pristine carbons. The labels are the ones used in those papers. See SI for details on these calculations.
3.3 Evolution of the tortuosity along discharge
The calculated evolution of the tortuosity along the discharge is given in Figure 6.a. The tortuosity values for the PNM are calculated by exporting the 3D mesostructures snapshots at 4 different depths of discharge to external image files which are then analyzed using the Matlab-developed TauFactor code.31 For the CM, the tortuosity evolves in the same way for the four electrode
mesostructures, i.e. following the Bruggeman relation. However, the PNM results show that the tortuosity evolutions are not the same for the various electrode mesostructures under investigation and confirm that the CM tends to underestimate the tortuosity. According to the PNM, the electrode mesostructure with the smallest average pore size, 40 nm, becomes much more tortuous along discharge. This is due to the large amount of small pores which makes pore clogging and loss of pore interconnectivity more likely. The second most tortuous structure is the 60 nm one. For pore sizes above approximately 60 nm, the tortuosity evolution seems to evolve in a similar fashion. The calculated tortuosities confirm that the lower discharge capacities observed for the PNM (Figures 3.a-3.b) are due to the higher tortuosity values in the 3D pore network (Figure 6.a).
Figure 6. Calculated evolution of the tortuosity for the PNM and CM along discharge for the case with𝜒 = 1. The tortuosity for the CM is independent of the starting pore size distribution. For all of the calculations 400 µA.g-1 current density is used.
4. Conclusions
We have compared the pore network and continuum modeling techniques in their abilities to capture the pore size and discharge product growth mechanisms effects in Li-O2 batteries. For the
surface growth mechanism both models show similar results and can capture the effect of the electrode mesostructures properly. For the solution phase mechanism however, the continuum model is not able to capture the pore size effect properly while the PNM calculation results show pore size dependent discharge capacities in agreement with experiments reported in the literature.5
Moreover, the calculated discharge capacities extracted from the PNM for different electrode mesostructures with three different discharge product growth scenarios allow us to propose an
explanation for conflicting trends previously reported in the literature. In particular, the current densities and the nature of the solvent can affect the Li2O2 growth mechanisms and potentially
lead to different ends of discharge for a given mesostructure. As a result, depending on the Li2O2
growth mechanism, the discharge capacity was suggested to be correlated with various properties of the electrode mesostructures (e.g. carbon surface area, pore volume, pore size). For a given set of parameters, one can also identify the existence of an optimum pore size offering the highest capacity. These results highlight that one should be cautious when using a continuum model to simulate the electrochemical performance of Li-O2 batteries, particularly when the solution growth
mechanism is considered: the pores interconnectivities in three dimensions play a major role in determining the overall cell performance.
ASSOCIATED CONTENT
Supporting Information.
A table of symbols and their descriptions, a table of parameters and their values, a PNM calculation including Li-ion transport, and details of the equivalent film thickness calculation are provided.
AUTHOR INFORMATION
The authors declare no competing financial interests.
ACKNOWLEDGMENT
The authors acknowledge the ALISTORE European Research Institute for the funding support of A.T. PhD thesis. A.A.F. acknowledges the Institut Universitaire de France for funding support.
This work has received funding from the European Research Council (ERC) under the European Union’s Horizon 2020 research and innovation programme through the projects ARTISTIC and SuPERPORES (grant agreements No 772873 and No 714581 respectively).
REFERENCES
(1) Abraham, K. M.; Jiang, Z. A Polymer Electrolyte − Based Rechargeable Lithium/Oxygen Battery. J. Electrochem. Soc. 1996, 143, 1–5.
(2) Christensen, J.; Albertus, P.; Sanchez-Carrera, R. S.; Lohmann, T.; Kozinsky, B.; Liedtke, R.; Ahmed, J.; Kojic, A. A Critical Review of Li∕Air Batteries. J. Electrochem. Soc. 2012, 159, R1.
(3) Luntz, A. C.; McCloskey, B. D. Nonaqueous Li-Air Batteries: A Status Report. Chem. Rev. 2014, 114, 11721–11750.
(4) Meini, S.; Piana, M.; Beyer, H.; Schwammlein, J.; Gasteiger, H. A. Effect of Carbon Surface Area on First Discharge Capacity of Li-O2 Cathodes and Cycle-Life Behavior in
Ether-Based Electrolytes. J. Electrochem. Soc. 2012, 159, A2135–A2142.
(5) Ding, N.; Chien, S. W.; Hor, T. S. A.; Lum, R.; Zong, Y.; Liu, Z. L. Influence of Carbon Pore Size on the Discharge Capacity of Li-O2 Batteries. J. Mater. Chem. A 2014, 2, 12433–
12441.
(6) Zeng, J.; Amici, J.; Monteverde Videla, A. H. A.; Francia, C.; Bodoardo, S. Synthesis of Mesoporous Carbons and Reduced Graphene Oxide and Their Influence on the Cycling Performance of Rechargeable Li-O2 Batteries. J. Solid State Electrochem. 2016, 1–12.
Hydrophobic Room Temperature Ionic Liquid Electrolyte. J. Power Sources 2005, 146, 766–769.
(8) Ma, S. B.; Lee, D. J.; Roev, V.; Im, D.; Doo, S. G. Effect of Porosity on Electrochemical Properties of Carbon Materials as Cathode for Lithium-Oxygen Battery. J. Power Sources 2013, 244, 494–498.
(9) Sun, B.; Huang, X.; Chen, S.; Munroe, P.; Wang, G. Porous Graphene Nanoarchitectures: An Efficient Catalyst for Low Charge-Overpotential, Long Life, and High Capacity Lithium-Oxygen Batteries. Nano Lett. 2014, 14, 3145–3152.
(10) Lim, H.-D.; Song, H.; Gwon, H.; Park, K.-Y.; Kim, J.; Bae, Y.; Kim, H.; Jung, S.-K.; Kim, T.; Kim, Y. H.; Lepró, X.; Ovalle-Robles, R.; Baughman, R. H.; Kang, K. A New Catalyst-Embedded Hierarchical Air Electrode for High-Performance Li–O2 Batteries. Energy
Environ. Sci. 2013, 6, 3570.
(11) Tan, P.; Kong, W.; Shao, Z.; Liu, M.; Ni, M. Advances in Modeling and Simulation of Li– air Batteries. Prog. Energy Combust. Sci. 2017, 62, 155–189.
(12) Yoo, K.; Banerjee, S.; Kim, J.; Dutta, P. A Review of Lithium-Air Battery Modeling Studies. Energies 2017, 10.
(13) Albertus, P.; Girishkumar, G.; McCloskey, B.; Sánchez-Carrera, R. S.; Kozinsky, B.; Christensen, J.; Luntz, A. C. Identifying Capacity Limitations in the Li/Oxygen Battery Using Experiments and Modeling. J. Electrochem. Soc. 2011, 158, A343–A351.
(14) Luntz, A. C.; Viswanathan, V.; Voss, J.; Varley, J. B.; Nørskov, J. K.; Scheffler, R.; Speidel, A. Tunneling and Polaron Charge Transport through Li2O2 in Li–O2 Batteries. J. Phys.
Chem. Lett. 2013, 4, 3494–3499.
the Discharge Performance of Lithium Air Batteries: A Multiscale Model. J. Electrochem. Soc. 2014, 161, E3028–E3035.
(16) Viswanathan, V.; Thygesen, K. S.; Hummelshj, J. S.; Nrskov, J. K.; Girishkumar, G.; McCloskey, B. D.; Luntz, A. C. Electrical Conductivity in Li2O2 and Its Role in
Determining Capacity Limitations in Non-Aqueous Li-O 2 Batteries. J. Chem. Phys. 2011, 135.
(17) Xue, K. H.; McTurk, E.; Johnson, L.; Bruce, P. G.; Franco, A. A. A Comprehensive Model for Non-Aqueous Lithium Air Batteries Involving Different Reaction Mechanisms. J. Electrochem. Soc. 2015, 162, A614–A621.
(18) Johnson, L.; Li, C.; Liu, Z.; Chen, Y.; Freunberger, S. A.; Ashok, P. C.; Praveen, B. B.; Dholakia, K.; Tarascon, J. M.; Bruce, P. G. The Role of LiO2 Solubility in O2 Reduction in
Aprotic Solvents and Its Consequences for Li–O2 Batteries. Nat. Chem. 2014, 6, 1091– 1099.
(19) Lim, H.-D.; Lee, B.; Zheng, Y.; Hong, J.; Kim, J.; Gwon, H.; Ko, Y.; Lee, M.; Cho, K.; Kang, K. Rational Design of Redox Mediators for Advanced Li–O2 Batteries. Nat. Energy 2016, 1, 16066.
(20) Gao, X.; Chen, Y.; Johnson, L.; Bruce, P. G. Promoting Solution Phase Discharge in Li-O2
Batteries Containing Weakly Solvating Electrolyte Solutions. Nat Mater 2016, advance on, 200–202.
(21) Aetukuri, N. B.; McCloskey, B. D.; García, J. M.; Krupp, L. E.; Viswanathan, V.; Luntz, A. C. Solvating Additives Drive Solution-Mediated Electrochemistry and Enhance Toroid Growth in Non-Aqueous Li–O2 Batteries. Nat. Chem. 2015, 7, 50–56.
M. M.; Casford, M. T. L.; Garcia-Araez, N.; Grey, C. P. The Effect of Water on Quinone Redox Mediators in Nonaqueous Li-O2 Batteries. J. Am. Chem. Soc. 2018, 140, 1428–1437.
(23) Bruggeman, D. A. G. Berechnung Verschiedener Physikalischer Konstanten von Heterogenen Substanzen. I. Dielektrizitätskonstanten Und Leitfähigkeiten Der Mischkörper Aus Isotropen Substanzen. Ann. Phys. 1935, 416, 636–664.
(24) Chung, D.-W.; Ebner, M.; Ely, D. R.; Wood, V.; Edwin García, R. Validity of the Bruggeman Relation for Porous Electrodes. Model. Simul. Mater. Sci. Eng. 2013, 21, 74009–74025.
(25) Torayev, A.; Rucci, A.; Magusin, P. C. M. M.; Demortière, A.; De Andrade, V.; Grey, C. P.; Merlet, C.; Franco, A. A. Stochasticity of Pores Interconnectivity in Li-O2 Batteries and
Its Impact on the Variations in Electrochemical Performance. J. Phys. Chem. Lett. 2018, 9. (26) Lim, H.-D.; Lee, B.; Bae, Y.; Park, H.; Ko, Y.; Kim, H.; Kim, J.; Kang, K. Reaction
Chemistry in Rechargeable Li–O2 Batteries. Chem. Soc. Rev. 2017, 46, 2873–2888.
(27) Laoire, C. O.; Mukerjee, S.; Abraham, K. M.; Plichta, E. J.; Hendrickson, M. A. Influence of Nonaqueous Solvents on the Electrochemistry of Oxygen in the Rechargeable Lithium-Air Battery. J. Phys. Chem. C 2010, 114, 9178–9186.
(28) Yang, X. hui; He, P.; Xia, Y. yao. Preparation of Mesocellular Carbon Foam and Its Application for Lithium/Oxygen Battery. Electrochem. commun. 2009, 11, 1127–1130. (29) Adams, B. D.; Radtke, C.; Black, R.; Trudeau, M. L.; Zaghib, K.; Nazar, L. F. Current
Density Dependence of Peroxide Formation in the Li–O2 Battery and Its Effect on Charge.
Energy Environ. Sci. 2013, 6, 1772–1777.
(30) Horstmann, B.; Gallant, B.; Mitchell, R.; Bessler, W. G.; Shao-Horn, Y.; Bazant, M. Z. Rate-Dependent Morphology of Li2O2 Growth in Li–O2 Batteries. J. Phys. Chem. Lett.
2013, 4, 4217–4222.
(31) Cooper, S. J.; Bertei, A.; Shearing, P. R.; Kilner, J. A.; Brandon, N. P. TauFactor: An Open-Source Application for Calculating Tortuosity Factors from Tomographic Data. SoftwareX 2016, 5, 203–210.