HAL Id: hal-01096295
https://hal.archives-ouvertes.fr/hal-01096295
Submitted on 27 Dec 2014
HAL is a multi-disciplinary open access
archive for the deposit and dissemination of sci-entific research documents, whether they are pub-lished or not. The documents may come from teaching and research institutions in France or abroad, or from public or private research centers.
L’archive ouverte pluridisciplinaire HAL, est destinée au dépôt et à la diffusion de documents scientifiques de niveau recherche, publiés ou non, émanant des établissements d’enseignement et de recherche français ou étrangers, des laboratoires publics ou privés.
Impact of soil moisture-climate feedbacks on CMIP5
projections: First results from the GLACE-CMIP5
experiment
S.I. Seneviratne, M. Wilhelm, T. Stanelle, B. van den Hurk, S. Hagemann, A.
Berg, Frédérique Cheruy, M.E. Higgins, A. Meier, V. Brovkin, et al.
To cite this version:
S.I. Seneviratne, M. Wilhelm, T. Stanelle, B. van den Hurk, S. Hagemann, et al.. Impact of soil moisture-climate feedbacks on CMIP5 projections: First results from the GLACE-CMIP5 experi-ment. Geophysical Research Letters, American Geophysical Union, 2013, 40 (19), pp.5212-5217. �10.1002/grl.50956�. �hal-01096295�
Impact of soil moisture-climate feedbacks on CMIP5 projections:
First results from the GLACE-CMIP5 experiment
Sonia I. Seneviratne,1Micah Wilhelm,1Tanja Stanelle,1Bart van den Hurk,2 Stefan Hagemann,3Alexis Berg,4,5Frederique Cheruy,6Matthew E. Higgins,7
Arndt Meier,8Victor Brovkin,3Martin Claussen,3Agnès Ducharne,9Jean-Louis Dufresne,6 Kirsten L. Findell,4Joséfine Ghattas,9David M. Lawrence,7Sergey Malyshev,10
Markku Rummukainen,8and Benjamin Smith11
Received 29 June 2013; revised 5 September 2013; accepted 10 September 2013. [1] The Global Land-Atmosphere Climate Experiment– Coupled Model Intercomparison Project phase 5 (GLACE-CMIP5) is a multimodel experiment investigating the impact of soil moisture-climate feedbacks in CMIP5 projections. We present here first GLACE-CMIP5 results based onfive Earth System Models, focusing on impacts of projected changes in regional soil moisture dryness (mostly increases) on late 21st century climate. Projected soil moisture changes substantially impact climate in several regions in both boreal and austral summer. Strong and consistent effects are found on temperature, especially for extremes (about 1–1.5 K for mean temperature and 2–2.5 K for extreme daytime temperature). In the Northern Hemisphere, effects on mean and heavy precipitation are also found in most models, but the results are less consistent than for temperature. A direct scaling between soil moisture-induced changes in evaporative cooling and resulting changes in temperature mean and extremes is found in the simulations. In the Mediterranean region, the projected soil moisture changes affect about 25% of the projected changes in extreme temperature.
Citation: Seneviratne, S. I., et al. (2013), Impact of soil moisture-climate feedbacks on CMIP5 projections: First results from the GLACE-CMIP5 experiment, Geophys. Res. Lett., 40, doi:10.1002/grl.50956.
1. Introduction
[2] Recent studies have suggested that soil moisture-climate feedbacks are responsible for a substantial fraction of simu-lated changes in climate projections [e.g., Seneviratne et al., 2006; Boe and Terray, 2008; Diffenbaugh and Ashfaq, 2010; Boberg and Christensen, 2012]. However, a quantification of these effects for multimodel global-scale projections has not been undertaken up to now. This is the main aim of Global Land-Atmosphere Climate Experiment–Coupled Model Intercomparison Project phase 5 (GLACE-CMIP5), a new multimodel experiment quantifying the impact of soil mois-ture-climate coupling in CMIP5 simulations. Compared to the previous GLACE-1 and GLACE-2 experiments [see Koster et al., 2004, 2010, as well as van den Hurk et al., 2011], GLACE-CMIP5 investigates long-term (decadal) rather than seasonal effects of soil moisture on climate. We present herefirst results of this experiment.
2. GLACE-CMIP5 Experiment
2.1. Overview of Experiment
[3] The initial phase of GLACE-CMIP5 includes two atmo-sphere/land only transient 1950–2100 simulations (“expA” and“expB”) in which soil moisture is prescribed in the respec-tive models according to the climatological results from a “ref-erence” fully coupled CMIP5 simulation, covering the historical and 21st century periods (for the latter based on the RCP8.5 sce-nario). In cases where there were minor differences in setup (for the European-Center-Earth (EC-Earth), Geophysical Fluid Dynamics Laboratory (GFDL), and Institut Pierre-Simon Laplace (IPSL) models)—e.g., due to parameterization differ-ences—a new reference simulation (“CTL”) was computed using the prescribed sea surface temperatures (SST), sea ice, land use, and CO2concentrations of the respective CMIP5 simulation (Table 1). Both expA and expB simulations use prescribed SSTs, sea ice, and land use from the reference run, and the same prescribed atmospheric CO2 concentrations (RCP8.5 CMIP5 scenario over 2006–2100 time period). The two experiments only differ in their prescribed soil moisture climatology:
[4] 1. expA: Seasonal cycle of soil moisture prescribed as 1971–2000 climatology from the reference CMIP5 coupled simulation.
[5] 2. expB: Seasonal cycle of soil moisture prescribed as a transient climatology (30 year running mean, with the exception offirst 15 years using 1950–1979 climatology and last 15 years using 2071–2100 climatology) from the same reference run. Additional supporting information may be found in the online version of
this article.
1
Institute for Atmospheric and Climate Science, ETH Zurich, Zurich, Switzerland.
2
KNMI, De Bilt, Netherlands.
3Max Planck Institute for Meteorology, Hamburg, Germany. 4
GFDL, NOAA, Princeton, New Jersey, USA.
5The State University of New Jersey, Rutgers, New Brunswick, New
Jersey, USA.
6LMD/IPSL, Université Pierre et Marie Curie, Paris, France. 7
NCAR, Boulder, Colorado, USA.
8Centre for Environmental and Climate Research, Lund University,
Lund, Sweden.
9Laboratoire Sisyphe/IPSL, Université Pierre et Marie Curie, Paris, France. 10
Princeton University, Princeton, New Jersey, USA.
11Department of Physical Geography and Ecosystem Science, Lund
University, Lund, Sweden.
Corresponding author: S. I. Seneviratne, Institute for Atmospheric and Climate Science, ETH Zurich, CH-8092 Zurich, Switzerland. (sonia. seneviratne@env.ethz.ch)
©2013. American Geophysical Union. All Rights Reserved. 0094-8276/13/10.1002/grl.50956
[6] The differences in soil moisture in the reference, expA, and expB simulations are illustrated in Figure 1.
[7] In the present analyses, we focus on the differences between expB and expA over the time frame 2071–2100. This allows us to assess the impact of the long-term mean soil moisture changes between 1971–2000 and 2071–2100 on the late 21st century climate. Follow-up studies will consider comparisons of expA and expB with the respective CMIP5 reference simulations, including transient features of the sim-ulations and impacts of changes in interannual soil moisture variability. The advantage of the present comparison is that it isolates the effect of changes in the soil moisture climatol-ogy (but not of changes in soil moisture variability) in the simulations, because of the minimal differences in experi-mental setup between expA and expB.
2.2. Participants and Analyzed Simulations
[8] Simulations with five Earth System Models (ESMs) have been contributed to GLACE-CMIP5: The Community Earth System Model (CESM), EC-Earth, GFDL, IPSL, and the Max-Planck-Institut-Earth System Model (MPI-ESM) (see Table 1 for details). All statistical quantities (mean and extremes) are computed for each model separately and results are then averaged for the main analyses. Details on the computation of extreme values are provided in the supporting information.
3. Results
[9] We focus here on both boreal (JJA) and austral (DJF) summer effects, as wefind the strongest signals in midlati-tude summer climate in the experiments. The analyses are provided for two regions with largest effects in these respec-tive seasons (Figures 2 and 3). Single model analyses are pro-vided in the supporting information (Figures S1–S8). We use the multimodel agreement as a measure of robustness in the analyses: Hatching in Figures 2 and 3 indicates regions where at least four out offive ESMs agree on the sign of change. In addition, information on the number of models with statistically significant differences is provided in the supporting information (Figure S9).
[10] The mean differences in soil moisture between expA and expB are displayed in Figures 2a and 2b. They mostly
consist in reduced soil moisture, the overall features of which are consistent with analyses of changes in soil moisture availability (and agricultural drought patterns) identified in several multimodel analyses from the CMIP3 and CMIP5 ar-chives [e.g., Wang, 2005; Seneviratne et al., 2012; Orlowsky and Seneviratne, 2012, 2013]. The respective projected changes in soil moisture are mostly induced by mean changes in precipitation and evapotranspiration in the coupled refer-ence CMIP5 simulation. In the following, we investigate how these resulting differences in mean soil moisture clima-tology affect late 21st century climate.
[11] We expect that first-order effects of soil moisture on the climate system are overwhelmingly driven by modi fica-tions of the turbulent heatfluxes [e.g., Koster et al., 2004; Seneviratne et al., 2010; Dirmeyer, 2011]. We thus first assess impacts on the latent and sensible heatfluxes in the ex-periments (Figures 2c–2f). These indeed correspond closely to the imposed differences in soil moisture in the two simula-tions (Figures 2a and 2b), with decreased latent and increased sensible heatfluxes in regions experiencing drier conditions in the future. The changes correspond mostly to a modified partitioning of thefluxes in the affected regions, rather than
Table 1. Earth System Models (ESMs) Participating in GLACE-CMIP5
ESM Acronym Atmospheric Model Land Surface Model Reference Simulation (“REF”) Reference Article(s) CESM National Center for Atmospheric
Research Community Atmospheric Model (CAM4)
Community Land Model (CLM4)
CMIP5 Neale et al. [2013]; Lawrence et al. [2011] EC-Earth Integrated Forecasting System
European Centre for Medium-Range
Weather Forecasts
Hydrology-Tiled ECMWF Scheme for Surface Exchange
over Land (H-TESSEL)
CTL (CMIP5 boundary conditions)
Hazeleger et al. [2011]; Balsamo et al. [2009]
GFDL Geophysical Fluid Dynamics Laboratory (GFDL) Earth System Model 2 (ESM2)
Land Model 3.0 (LM3.0) CTL (CMIP5 boundary conditions)
Dunne et al. [2012]; Shevliakova et al. [2009] IPSL Laboratoire de Météorologie
Dynamique atmospheric model (LMDZ5A)
Organizing Carbon and Hydrology in Dynamic Ecosystems (ORCHIDEE; with two-layer
soil hydrology scheme)
CTL (CMIP5 boundary conditions)
Dufresne et al. [2013]; Hourdin et al. [2013];
Chéruy et al. [2013] MPI-ESM European Centre/Hamburg
forecast system
Jena Scheme for Biosphere-Atmosphere Coupling in Hamburg (JSBACH)
CMIP5 Stevens et al. [2013]; Hagemann et al. [2013]; Raddatz et al. [2007]; Brovkin et al. [2009] 550 450 350 250 1980 2000 2020 2040 2060 2080 2100
reference simulation (CMIP5 setup) expA
expB
1960
Figure 1. Illustration of experimental setup: Monthly soil moisture (mm) from 1950 to 2100 in reference simulation (black), expA (red), and expB (green) for a point in Central Europe (IPSL model).
a change in net radiation (e.g., due to changed cloud cover), as the net sum of the turbulentfluxes is mostly unaffected in the experiments (not shown).
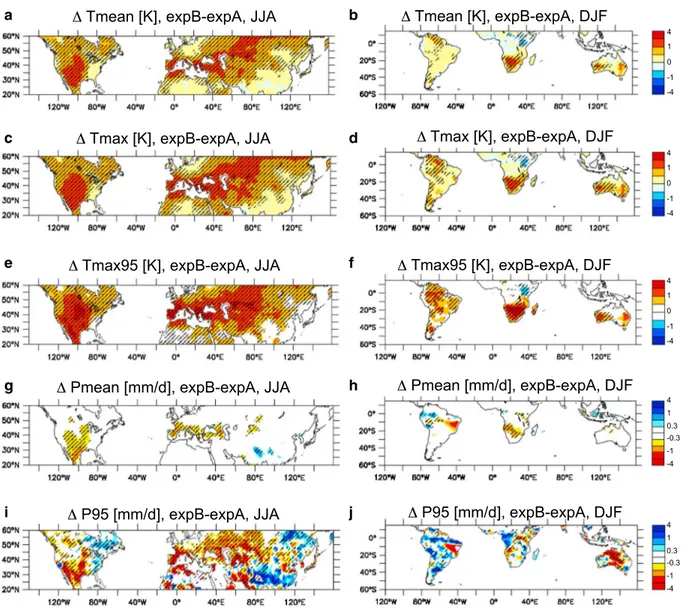
[12] We then analyze the impacts of the imposed soil mois-ture difference on temperamois-turefields. Figures 3a–3f display dif-ferences between expB and expA in late 21st century for the average daily mean temperature (Tmean; Figures 3a and 3b), the average daily maximum temperature (Tmax; Figures 3c and 3d), and the 95th percentile daily Tmax (Tmax95; Figures 3e and 3f), in the JJA (left) and DJF (right) seasons. The analyses reveal a substantial impact on temperature, which interestingly extends over a broader area than that directly af-fected by soil moisture changes and associated differences in turbulent heatfluxes in the Northern Hemisphere (Figure 2). Because the latter robust effect is often found in regions located east (i.e., downwind at midlatitudes) of those with imposed soil moisture anomalies, a possible explanation is that warm air ad-vection leads to nonlocal soil moisture feedbacks on tempera-ture in the simulations [see, e.g., Vautard et al., 2007].
[13] The resulting temperature anomalies reach about 1–1.5 K for Tmean, 1.5–2 K for Tmax, and 2–2.5 K for Tmax95 in the affected hot spots regions (see also later discussion of Fig. 4a). Note that the imposed soil moisture forcing also leads to weak cooling in some regions (e.g., tropical Eastern Africa, which is projected to experience larger precipitation amounts in the future) [see also Shongwe et al., 2011].
[14] Effects on precipitation are also found, especially in the Northern Hemisphere in JJA (Figures 3g–3j). These are generally limited in absolute term for mean precipitation (Pmean; Figures 3g and 3h), although they are substantial in relative terms in most concerned regions (e.g., 30%–50% in the Mediterranean, see Figure S10). They are also substantial for extreme precipitation levels (95th percentile, P95) in JJA
(Figure 3i), although only statistically significant in a few models (see Figure S9). The net effect of enhanced soil moisture drought in the ESMs is a decrease in mean and extreme precipitation. It thus implies a strengthening of the dryness signal and a reduction of the global-scale tendency toward heavier precipitation [e.g., Seneviratne et al., 2012] in the affected regions. The exact mechanism of this relationship is not clear yet but could either be related to water supply limitation or modified precipitation trigger-ing. Nonetheless, the results are noisier and generally not robust across models in the Southern Hemisphere in DJF. Hence, the precipitation signal is mainly a feature of the Northern Hemisphere summer (but not significant in all models), possibly due to the larger continental areas in the Northern Hemisphere.
[15] An important question is the extent to which the cli-mate response to imposed soil moisture anomalies can be considered to be approximately linear. Indeed, if such linear relationships hold, these would allow the application of observational constraints to projections in cases where models diverge in their representation of land-climate feed-backs [e.g., Hall and Qu, 2006; Boberg and Christensen, 2012]. Figure 4a displays scatter plots and linear regressions of the respective responses in Tmean, Tmax, and Tmax95versus the difference in latent heat (LH)flux based on multimodel averages (focusing only on JJA and on regions with de-creased LH in future projections). Interestingly, this analysis reveals a strong linear scaling of the temperature responses to the imposed changes in latent heat flux at the surface. Changes in precipitation mean and extremes generally also show a linear scaling in the models, but the relationships are less consistent across models for precipitation than for temperature, especially for heavy precipitation (not shown). Figure 2. Difference of two experiments (expB-expA) over time period 2071–2100 for (a, b) soil moisture (% difference), (c, d) latent heatflux (W/m2), and (e, f) sensible heatflux (W/m2), in JJA (left; domain: 150°W:160°E, 20°N:60°N) and DJF (right; domain: 120°W:160°E, 60°S:15°N) computed as average offive model experiments. Tendencies associated with drier conditions are indicated with yellow-red shadings (lower latent heatflux, higher sensible heat flux). The plotted domains cover the regions with largest changes for the respective seasons. The hatching indicates regions in which at least four out offive models agree on the sign of change.
[16] The respective temperature sensitivities are 0.06 K/ (Wm 2) for Tmean, 0.07 K/(Wm 2) for Tmax, and 0.08 K/ (Wm 2) for T
max95. The stronger sensitivity of Tmax com-pared to that of Tmeancan be explained by the fact that soil moisture limitation on evapotranspiration mostly affects the daytime energy balance. The finding that extreme Tmax values are more strongly affected than mean Tmaxis consis-tent with observational evidence [e.g., Hirschi et al., 2011; Mueller and Seneviratne, 2012] and supports the hypothesis that the nonlinear scaling of extreme temperature changes with global mean temperature in CMIP5 projections is related to soil moisture-temperature feedbacks [Orlowsky and Seneviratne, 2012].
[17] To illustrate the relevance of the identified impacts for climate change signals, Figure 4b displays the differences in Tmean, Tmax, Tmax95between late 21st century and late twen-tieth century for expA, expB, and the respective reference CMIP5-type simulations (“REF”) in the Mediterranean region (for JJA). Overall, the signals are similar for expB and REF. Maintaining soil moisture levels at constant end of twentieth century values throughout the simulation (expA) substantially reduces the temperature signals,
consistent with the results of Figures 3 and 4a. The overall ef-fect amounts to 25% of the climate change signal for Tmax95 (respectively, 18% and 23% for Tmeanand Tmax). These re-sults highlight the importance of soil moisture-climate feed-backs for regional temperature changes.
4. Summary and Conclusions
[18] This article presentsfirst results of the GLACE-CMIP5 multimodel experiment, focusing on how projected changes in soil moisture affect projected future climate by the end of the 21st century. Substantial mean changes in soil moisture re-gimes take place in the climate projections between these two time periods, and these changes strongly affect regional climate (both locally and in midlatitude downwind regions), in particular for temperature mean and extremes. For precipita-tion, consistent (but not always statistically significant) signals are found in the simulations. There is a strong linear response of temperature to soil moisture-induced changes in evapora-tive cooling, with strongest effects on extremes. Given the un-certainties in the representation of soil moisture-climate feedbacks in current models [e.g., Koster et al., 2004; Figure 3. As Figure 2 for (a, b) mean Tmean, (c, d) mean Tmax, (e, f) 95th percentile of daily Tmax, (g, h) mean precipitation (Pmean), and (i j) 95th percentile of daily precipitation (P95). Units are in (K) for temperature (color scale: 4, 2, 1, 0.5, 0, 0.5, 1, 2, 4) and (mm/d) for precipitation (color scale: 4, 2, 1, 0.6, 0.3, 0, 0.3, 0.6, 1, 2, 4).
Dirmeyer et al., 2006; Boe and Terray, 2008; Seneviratne et al., 2010; Taylor et al., 2012; Boberg and Christensen, 2012] and the overall spread of climate models with respect to drought projections [Seneviratne et al., 2012; Orlowsky and Seneviratne, 2013], these first GLACE-CMIP5 results also emphasize the need for a more in-depth evaluation of the underlying processes in existing climate models.
[19] Acknowledgments. The coordinators of the GLACE-CMIP5 pro-ject gratefully acknowledge support from the EU-FP7 EMBRACE propro-ject (European Commission’s 7th Framework Programme, grant agreement 282672). The modeling participants (see Table 1) were able to perform the GLACE-CMIP5 simulations thanks tofinancial and computational support from their home institutions and/or from the institutions hosting the employed Earth System Models. A.B. was supported by the National Science Foundation (NSF) grants AGS-1035968 and AGS-1035843. A.M., M.R., and B.S. contrib-uted through the strategic research area MERGE. We thank WCRP’s GEWEX Land-Atmosphere System Study (GLASS) and IGBP’s Integrated Land-Ecosystem-Atmosphere Processes Study (ILEAPS) for their sponsorship of this project. We also thank Paul Dirmeyer, Pierre Friedlingstein, Randy Koster, Chris Milly, Boris Orlowsky, Julia Pongratz, two anonymous re-viewers, and the Editor for helpful comments on the modeling setup, analyses, and/or manuscript.
[20] The Editor thanks two anonymous reviewers for their assistance in evaluating this paper.
References
Balsamo, G., A. Beljaars, K. Scipal, P. Viterbo, B. van den Hurk, M. Hirschi, and A. K. Betts (2009), A revised hydrology for the ECMWF model: Verification from field site to terrestrial water storage and impact in the Integrated Forecast System, J. Hydrometeorol., 10, 623–643, doi:10.1175/ 2008JHM1068.1.
Boberg, F., and J. H. Christensen (2012), Overestimation of Mediterranean summer temperature projections due to model deficiencies, Nat. Clim. Change, 2, 433–436, doi:10.1038/nclimate1454.
Boe, J., and L. Terray (2008), Uncertainties in summer evapotranspiration changes over Europe and implications for regional climate change, Geophys. Res. Lett., 35, L05702, doi:10.1029/2007GL032417. Brovkin, V., T. Raddatz, C. H. Reick, M. Claussen, and V. Gayler (2009),
Global biogeophysical interactions between forest and climate, Geophys. Res. Lett., 36, L07405, doi:10.1029/2009GL037543.
Chéruy, F., A. Campoy, J.-C. Dupont, A. Ducharne, F. Hourdin, M. Haeffelin, M. Chiriaco, and A. Idelkadi (2013), Combined influence
of atmospheric physics and soil hydrology on the simulated meteorology at the SIRTA atmospheric observatory, Clim. Dyn., 40, 2251–2269, doi:10.1007/s00382-012-1469-y.
Diffenbaugh, N.S., and M. Ashfaq (2010), Intensification of hot extremes in the United States. Geophys. Res. Lett., 37, L15701, doi:10.1029/2010GL043888. Dirmeyer, P.A. (2011), The terrestrial segment of soil moisture–climate coupling, Geophys. Res. Lett., 38, L16702, doi:10.1029/2011GL048268. Dirmeyer, P. A., R. D. Koster, and Z. Guo (2006), Do global models properly represent the feedback between land and atmosphere?, J. Hydrometeorol., 7, 1177–1198.
Dufresne, J.-L., et al. (2013), Climate change projections using the IPSL-CM5 Earth System Model: from CMIP3 to CMIP5, Clim. Dyn., 40(9-10), 2123–2165, doi:10.1007/s00382-012-1636-1.
Dunne, J. P., et al. (2012), GFDL’s ESM2 global coupled climate-carbon Earth System Models. Part I: Physical formulation and baseline simulation charac-teristics, J. Clim., 25(19), 6646–6665, doi:10.1175/JCLI-D-11-00560.1. Hagemann, S., A. Loew, and A. Andersson (2013), Combined evaluation of
MPI-ESM land surface water and energyfluxes, J. Adv. Model. Earth Syst., 5, 259–286, doi:10.1029/2012MS000173.
Hall, A., and X. Qu (2006), Using the current seasonal cycle to constrain snow albedo feedback in future climate change, Geophys. Res. Lett., 33, L03502, doi:10.1029/2005GL025127.
Hazeleger, W., et al. (2011), EC-earth V2.2: Description and validation of a new seamless Earth system prediction model, Clim. Dyn., 39, 2611–2629, doi:10.1007/s00382-011-1228-5.
Hirschi, M., S. I. Seneviratne, V. Alexandrov, F. Boberg, C. Boroneant, O. B. Christensen, H. Formayer, B. Orlowsky, and P. Stepanek (2011), Observational evidence for soil-moisture impact on hot extremes in southeastern Europe, Nat. Geosci., 4(1), 17–21.
Hourdin, F., et al. (2013), Impact of the LMDZ atmospheric grid con figura-tion on the climate and sensitivity of the IPSL-CM5A coupled model, Clim. Dyn., 40, 2167–2192, doi:10.1007/s00382-012-1411-3.
Koster, R. D., et al. (2004), Regions of strong coupling between soil moisture and precipitation, Science, 305, 1138–1140.
Koster, R.D., et al. (2010), The contribution of land surface initialization to subseasonal forecast skill: First results from the GLACE-2 Project, Geophys. Res. Lett, 37, L02402, doi:10.1029/2009GL041677.
Lawrence, D. M., et al. (2011), Parameterization improvements and functional and structural advances in version 4 of the Community Land Model, J. Adv. Model. Earth Syst., 3, 1–27, doi:10.1029/2011MS000045. Mueller, B., and S. I. Seneviratne (2012), Hot days induced by precipitation deficits at the global scale, Proc. Natl. Acad. Sci. U. S. A., 109(31), 12,398–12,403, doi:10.1073/pnas.1204330109.
Neale, R. B., J. Richter, S. Park, P. H. Lauritzen, S. J. Vavrus, P. J. Rasch, and M. Zhang (2013), The mean climate of the Community Atmosphere Model (CAM4) in forced SST and fully coupled experiments, J. Clim., 26(14), 5150–5168, doi:10.1175/JCLI-D-12-00236.1.
Temperature [K], JJA
Latent heat flux [W/m2], JJA Tmean, slope=-0.057 Tmax, slope=-0.071 Tmax95, slope=-0.083 a 2.5 2 1.5 1 0.5 0
-25 -20 -15 -10 -5 0 Tmean Tmax Tmax95
b Temperature change (Future-present) [K] (2071-2100)-(1971-2000), MED, JJA expA expB REF Tmean (B-A) =18% Tmean (REF-A)=19% Tmax (B-A) =23% Tmax (REF-A)=24% Tmax95 (B-A) = 27% Tmax95 (REF-A)= 25% 7 6 5 4 3 2 1 0
Figure 4. (a) Scatter plot and linear regressions ofΔTmean,ΔTmax, andΔTmax95versusΔLH (K/(Wm 2)) in simulations expB-expA for JJA based on multimodel averages (domain: 150°W:160°E, 20°N:60°N; analyses only for land points and areas with negativeΔLH, using bins of 2.5 W/m2forΔLH; for more details, see supporting information Discussion 4). (b) Climate change signal in expA, expB, and REF simulations over Mediterranean region in JJA (domain: 10°W:40°E, 30° N:45°N), for Tmean, Tmax, and Tmax95. Thefigures at the bottom of the graph indicate the differences between expB and expA (first row) and between REF and expA (second row) (%).
Orlowsky, B., and S. I. Seneviratne (2012), Global changes in extreme events: Regional and seasonal dimension, Clim. Change, 110, 669–696, doi:10.1007/s10584-011-0122-9.
Orlowsky, B., and S. I. Seneviratne (2013), Elusive drought: Uncertainty in observed trends and short- and long-term CMIP5 projections, Hydrol. Earth Syst. Sci., 17, 1765–1781, doi:10.5194/hess-17-1765-2013. Raddatz, T. J., C. H. Reick, W. Knorr, J. Kattge, E. Roeckner, R. Schnur,
K.-G. Schnitzler, P. Wetzel, and J. Jungclaus (2007), Will the tropical land biosphere dominate the climate–carbon cycle feedback during the twenty-first century?, Clim. Dyn., 29, 565–574, doi:10.1007/s00382-007-0247-8. Seneviratne, S. I., D. Lüthi, M. Litschi, and C. Schär (2006), Land-atmosphere
coupling and climate change in Europe, Nature, 443(7108), 205–209. Seneviratne, S. I., T. Corti, E. L. Davin, M. Hirschi, E. B. Jaeger, I. Lehner,
B. Orlowsky, and A. J. Teuling (2010), Investigating soil moisture–climate interactions in a changing climate: A review, Earth Sci. Rev., 99(3-4), 125–161.
Seneviratne, S. I., et al. (2012), Changes in climate extremes and their impacts on the natural physical environment, in Managing the Risks of Extreme Events and Disasters to Advance Climate Change Adaptation, A Special Report of Working Groups I and II of the Intergovernmental Panel on Climate Change (IPCC), edited by C. B. Field et al., pp. 109–230, Cambridge Univ. Press, Cambridge, UK, and New York, NY, USA. Shevliakova, E., S. W. Pacala, S. Malyshev, G. C. Hurtt, P. C. D. Milly,
J. P. Caspersen, L. T. Sentman, J. P. Fisk, C. Wirth, and C. Crevoisier
(2009), Carbon cycling under 300 years of land use change: Importance of the secondary vegetation sink, Global Biogeochem. Cycles, 23, GB2022, doi:10.1029/2007GB003176.
Shongwe, M. E., G. J. van Oldenborgh, B. J. J. M. van den Hurk, and M. A. van Aalst (2011), Projected changes in extreme precipitation in Africa under global warming, Part II: East Africa, J. Clim., 24, 3718–3733, doi:10.1175/2010JCLI2883.1.
Stevens, B., et al. (2013), Atmospheric component of the MPI-M Earth System Model: ECHAM6, J. Adv. Model. Earth Syst., 5(2), 146–172, doi:10.1002/jame.20015.
Taylor, C. M., R. A. M. De Jeu, F. Guichard, P. P. Harris, and W. A. Dorigo (2012), Afternoon rain more likely over drier soils, Nature, 489, 423–426. van den Hurk, B., M. Best, P. Dirmeyer, A. Pitman, J. Polcher, and J. Santanello (2011), Acceleration of land surface model development over a decade of GLASS, Bull. Am. Meteorol. Soc., 92(12), 1593–1600, doi:10.1175/BAMS-D-11-00007.1.
Vautard, R., P. Yiou, F. D’Andrea, N. de Noblet, N. Viovy, C. Cassou, J. Polcher, P. Ciais, M. Kageyama, and Y. Fan (2007), Summertime European heat and drought waves induced by wintertime Mediterranean rainfall deficit, Geophys. Res. Lett., 34, L07711, doi:10.1029/ 2006GL028001.
Wang, G. L. (2005), Agricultural drought in a future climate: Results from 15 global climate models participating in the IPCC 4th assessment, Clim. Dyn., 25, 739–753.