HAL Id: hal-00583680
https://hal.archives-ouvertes.fr/hal-00583680
Submitted on 6 Apr 2011
HAL is a multi-disciplinary open access
archive for the deposit and dissemination of
sci-entific research documents, whether they are
pub-lished or not. The documents may come from
teaching and research institutions in France or
abroad, or from public or private research centers.
L’archive ouverte pluridisciplinaire HAL, est
destinée au dépôt et à la diffusion de documents
scientifiques de niveau recherche, publiés ou non,
émanant des établissements d’enseignement et de
recherche français ou étrangers, des laboratoires
publics ou privés.
A novel approach for determining fatigue resistances of
different muscle groups in static cases
Liang Ma, Damien Chablat, Fouad Bennis, Wei Zhang, Bo Hu, François
Guillaume
To cite this version:
Liang Ma, Damien Chablat, Fouad Bennis, Wei Zhang, Bo Hu, et al.. A novel approach for
determin-ing fatigue resistances of different muscle groups in static cases. International Journal of Industrial
Ergonomics, Elsevier, 2011, 41 (1), pp.10-18. �10.1016/j.ergon.2010.11.005�. �hal-00583680�
A novel approach for determining fatigue resistances of different muscle groups in static
cases
Liang MAa,c,∗, Damien CHABLATb, Fouad BENNISb,c, Wei ZHANGa, Bo HUa, Franc¸ois GUILLAUMEd
aDepartment of Industrial Engineering, Tsinghua University, 100084, Beijing, P.R.China bInstitut de Recherche en Communications et en Cybern´etique de Nantes, UMR 6597
IRCCyN - 1, rue de la No¨e, BP 92 101 - 44321 Nantes CEDEX 03, France cEcole Centrale de Nantes, 1, rue de la No¨e, BP 92 101 - 44321 Nantes CEDEX 03, France´
dEADS Innovation Works, 12, rue Pasteur - BP 76, 92152 Suresnes Cedex - France
Abstract
In ergonomics and biomechanics, muscle fatigue models based on maximum endurance time (MET) models are often used to integrate fatigue effect into ergonomic and biomechanical application. However, due to the empirical principle of those MET models, the disadvantages of this method are: 1) the MET models cannot reveal the muscle physiology background very well; 2) there is no general formation for those MET models to predict MET. In this paper, a theoretical MET model is extended from a simple muscle fatigue model with consideration of the external load and maximum voluntary contraction in passive static exertion cases. The universal availability of the extended MET model is analyzed in comparison to 24 existing empirical MET models. Using mathematical regression method, 21 of the 24 MET models have intraclass correlations over 0.9, which means the extended MET model could replace the existing MET models in a general and computationally efficient way. In addition, an important parameter, fatigability (or fatigue resistance) of different muscle groups, could be calculated via the mathematical regression approach. Its mean value and its standard deviation are useful for predicting MET values of a given population during static operations. The possible reasons influencing the fatigue resistance were classified and discussed, and it is still a very challenging work to find out the quantitative relationship between the fatigue resistance and the influencing factors.
Relevance to industry :
MSD risks can be reduced by correct evaluation of static muscular work. Different muscle groups have different properties, and a generalized MET model is useful to simplify the fatigue analysis and fatigue modeling, especially for digital human techniques and virtual human simulation tools.
Key words: muscle fatigue, biomechanical muscle modeling, fatigue resistance, maximum endurance time, muscle groups
1. Introduction
Muscle fatigue is defined as “any reduction in the ability to exert force in response to voluntary effort” (Chaffin et al.,
1999), and it is believed that the muscle fatigue is one of poten-tial reasons leading to musculoskeletal disorders (MSDs) in the literature (Westgaard,2000;Kumar and Kumar,2008;Kim et al.,
2008). Great effort has been contributed to integrate fatigue into different biomechanical models, especially in virtual hu-man simulation for ergonomic application, in order to analyze the fatigue in muscles and joints and further to decrease the MSD risks (Badler et al.,1993;Vignes,2004;Hou et al.,2007). In general, mainly two approaches have been adopted to represent muscle fatigue, either in theoretical methods or in empirical methods (Xia and Frey Law,2008). One or more de-cay terms were introduced into existing muscle force models in theoretical fatigue models, and those decay terms were mainly
∗Corresponding author: Tel:+86-10-62792665; Fax:+86-10-62794399 Email addresses: liangma@tsinghua.edu.cn;
liang.ma@irccyn.ec-nantes.fr(Liang MA)
based on physiological performance of muscles in fatigue con-traction. For example, a fatigue model based on the intracel-lular pH (Giat et al.,1993) was incorporated into Hill’s muscle mechanical model (Hill, 1938). This fatigue model was also applied byKomura et al.(1999) to demonstrate the fatigue of different individual muscles. Another muscle fatigue model (Ding et al.,2003) based on physiological mechanism has been included into the Virtual Solider Research Program (Vignes,
2004), and in this model, dozens of parameters have to be fit for model identification only for a single muscle. As stated in
Xia and Frey Law (2008), “these theoretical models are rela-tively complex but useful at the single muscle level. However, they do not readily handle task-related biomechanical factors such as joint angle and velocity.” Meanwhile, several muscles around a joint are engaged in order to realize an action or a movement around the joint, and mathematically this results in an underdetermined equation while determining the force of each engaged muscle due to muscle redundancy and complex muscle force moment arm-joint angle relationships. Although different optimization methods have been used to face this load sharing problem (Ren et al.,2007), it is still very difficult to
val-idate the optimization result and further the fatigue effect, due to the complexity of anatomical structure and the physiological coordination mechanism of the muscles.
Muscle fatigue is often modeled and extended based on Maximum Endurance Time (MET) models at joint level in em-pirical methods. These models are often used in ergonomic ap-plications to handle task-related external parameters, such as intensity of the external load, frequency of the external load, duration, and posture. In these models, the MET of a mus-cle group around a joint was often measured under static con-traction conditions until exhaustion. Using this method can avoid complex modeling of individual muscles, and net joint strengths already exist in the literature for determining the rela-tive load (Anderson et al.,2007;Xia and Frey Law,2008). The most famous one of these MET models is Rohmert’s curve (Rohmert,1960) which was usually used as guideline for de-signing the static contraction task. Besides Rohmert’s MET model, there are several other empirical MET models in the lit-erature (El ahrache et al.,2006). These MET models are very useful to evaluate physical fatigue in static operations and to de-termine work-rest allowances (El ahrache and Imbeau,2009), and they were often employed in biomechanical models in order to minimize fatigue as well. For example,Freund and Takala
(2001) proposed a dynamic model for forearm in which the fa-tigue component was modeled for each single muscle by fit-ting Rohmert’s curve inChaffin et al.(1999). Rodr´ıguez et al.
(2003) proposed a half-joint fatigue model, more exactly a fa-tigue index, based on mechanical properties of muscle groups. The holding time over maximum endurance time is used as an indicator to evaluate joint fatigue. InNiemi et al.(1996), dif-ferent fiber type composition was taken into account with en-durance model to locate the muscle fatigue into single mus-cle level. However, in MET models, the main limitations are: 1) The physical relationship in these models cannot be inter-preted directly by muscle physiology, and there is no universal-ity among these models. 2) All the MET models were achieved by fitting experimental results using different formulation of equation. It has been found that muscle fatigability can vary across muscles and joints. However, there is no general formu-lation for those models. 3) Differences have been found among those MET models for different muscle groups, for different postures, and even for different models for the same muscle group. Due to the limitation from the empirical principle, the differences cannot be interpreted by those MET models. Thus, it is necessary to develop a general MET model which is able to replace all the experimental MET models and explain all the differences cross these models.
Xia and Frey Law (2008) proposed a new muscle fatigue model based on motor units (MU) recruitment (Liu et al.,2002) to combine the theoretical models and the task-related muscle fatigue factors. In this model, properties of different muscle fiber types have been assumed to predict the muscle fatigue at joint level. However, in their research, the validation of their fa-tigue model was not provided. Furthermore, the different fati-gability of different muscle groups has not been analyzed in details in this model. Fatigability (the reciprocal of endurance capacity or the reciprocal of fatigue resistance) can be defined
by the endurance time or measured by the number of times of an operation until exhaustion. This measure is an important pa-rameter to measure physical fatigue process during manual han-dling operations (Lynch et al.,1999; Clark and Manini,2003;
Larivi`ere et al.,2006;Hunter et al.,2004).
InMa et al.(2009), we constructed a new muscle fatigue model in which the external task related parameters are taken into consideration to describe physical fatigue process, and this model has also been interpreted by the physiological mecha-nism of muscle. The model has been compared to 24 existing MET models, and great linear relationships have been found between our model and the other MET models. Meanwhile, this model has also been validated in comparison to three the-oretical models. This model is a simpler, thethe-oretical approach to describe the fatigue process, especially in static contraction cases.
In this paper, further analysis based on the fatigue model is carried out using mathematical regression method to deter-mine the fatigability of different muscle groups. We are going to propose a mathematical parameter, defined as fatigability, de-scribing the resistance to the decrease of the muscle capacity. The fatigue resistance for different muscle groups is going to be regressed from experimental MET models. The theoretical ap-proach for calculating the fatigue resistance will be explained in Section2. The muscle fatigue model inMa et al.(2009) is go-ing to be presented briefly in Section2.1. A general MET model is extended from this fatigue model in Section2.2. The mathe-matical procedure for calculating the fatigability contributes to the main content of Section2.3. The results and discussion are given in Section3and4, respectively.
2. Method
2.1. A dynamic muscle fatigue model
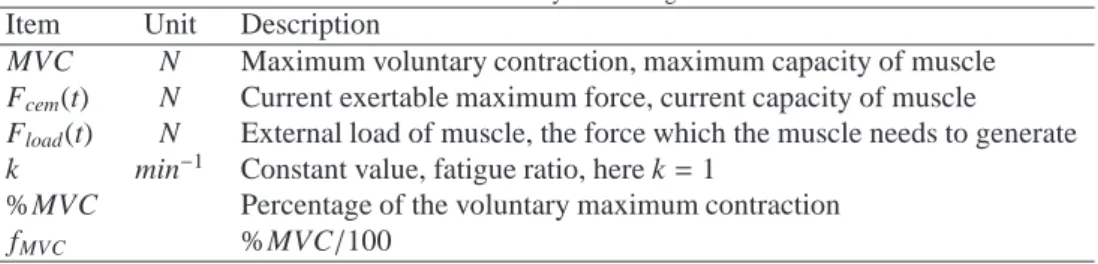
A dynamic fatigue model based on muscle active motor principle was proposed in Ma et al.(2009). This model was able to integrate task parameters (load) and temporal parame-ters into manual handling operation in industry. The differen-tial equation for describing the reduction of the capacity is Eq. (1). The descriptions of the parameters for Eq. (1) are listed in Table1.
dFcem(t)
dt = −k Fcem(t)
MVC Fload(t) (1)
The fatigue model in Eq. (1) can be explained by the MU-based pattern of muscle (Liu et al.,2002;Vøllestad,1997). Ac-cording to muscle physiology, larger Floadmeans more type II motor units are involved into the force generation. As a result, the muscle becomes fatigued more rapidly, as expressed in Eq. (1). Fcemrepresents the non-fatigue motor units of the muscle. The decreased fatigability is expressed by term Fcem(t)/MVC due to the composition change in the non-fatigue muscle fibers.
k is a parameter indicating the fatigue ratio, and it has different
constant values for different muscle groups. In a general case, it is assigned as 1. This dynamic model has been mathemati-cal validated inMa et al.(2009) with static MET models and
Table 1: Parameters in Dynamic Fatigue Model
Item Unit Description
MVC N Maximum voluntary contraction, maximum capacity of muscle
Fcem(t) N Current exertable maximum force, current capacity of muscle
Fload(t) N External load of muscle, the force which the muscle needs to generate
k min−1 Constant value, fatigue ratio, here k = 1
%MVC Percentage of the voluntary maximum contraction
fMVC %MVC/100
other existing dynamic theoretical models. Much more detailed explanation can be found inMa et al.(2009).
The integration result of Eq. (1) is Eq. (2), if Fcem(0) =
MVC. Equation (2) demonstrates the fatigue process under an external load Fload(u). The external load can be either static external load or dynamic one.
Fcem(t) = MVC e Rt
0−k
Fload(u)
MVC du (2)
2.2. The extended MET model
A general MET model can be extended by supposing that
Fload(t) is constant in static situation to predict the endurance time of a muscle contraction. MET is the duration in which
Fcemfalls down to the current Fload. Thus, MET can be deter-mined by Eq. (3) and (4).
Fcem(t) = MVC e Rt 0−k Fload(u) MVC du= Fload(t) (3) t = MET = − ln Fload(t) MVC ! kFload(t) MVC = −ln( fMVC) k fMVC (4)
In comparison to the empirical MET models, the extended MET model is obtained from a theoretical muscle fatigue model based on motor units recruitment mechanism. In the extended MET model, only one parameter k remains variable. This pa-rameter is defined as fatigability (fatigue ratio) in the theoretical model, and this parameter could enable us to explain the differ-ences found in empirical MET models.
2.3. Regression for determining the fatigability
In Ma et al.(2009), two correlation coefficients were se-lected to analyze the relationship between the extended MET model (k = 1) and the empirical MET models. One is Pearson’s correlation r in for evaluating the linear relationship and the other one is intraclass correlation (ICC) for evaluating the sim-ilarity between two models. The calculation results are shown in columns r and ICC1 of Table2. There are still large
differ-ences from 1 in ICC1 column, while high linear correlations
have also been found between the extended MET model and the empirical MET models. That means that the extended MET model can fit the empirical MET models for different muscle groups by adjusting the parameter k.
A mathmatical regression process is carried out to deter-mine the parameter k as follows. From Table2, it is observed that almost all the static MET models have high linear relation-ship with the extended MET model (for most models, r > 0.95), which means that each static model can be described mathemat-ically by a linear equation (Eq. (5)). In Eq. (5), x is used to re-place fMVCand p(x) represents the extended MET model in Eq. (4). m and n are constants describing the linear relationship
between an existing MET model and the extended MET model, and they are needed to be determined in linear regression. It should be noticed that m = 1/k indicates the fatigue resistance of the static model, and k is fatigue ratio or fatigability of dif-ferent static model.
f (x) = m p(x) + n (5) Due to the asymptotic tendencies of the empirical MET models mentioned in El ahrache et al. (2006), when x → 1 (%MVC → 100), f (x) → 0 and p(x) → 0 (MET → 0), there-fore, we can assume that n = 0. For this reason, only one pa-rameter m needs to be determined. Since some empirical MET models are not available for %MVC under 15%, the regression was carried out in the interval from x = 0.16 to x = 0.99. With an space 0.01, N = 84 empirical MET values were calculated to determine the parameter m by minimizing the function in Eq. (6). M(x) = N X i=1 ( f (xi) − m p(xi))2= a m2+ b m + c (6) In Eq. (6), a = N P i=1
p(xi)2 is always greater than 0, and
b = −2
N P i=1
p(xi) f (xi) is always less than 0, therefore the fatigue resistance m can be calculated by Eq. (7).
m = −b 2a = N P i=1 p(xi) f (xi) N P i=1 p(xi)2 >0 (7)
After regression for each empirical MET model, new ICC values were calculated by comparing f (x)/m and p(x), and they are listed in the column ICC2of Table2. It is easy to prove that
the regression does not change the r correlation. For this reason, only ICC is recalculated.
3. Results
3.1. Regression results
Both ICC correlations before regression and after regres-sion are shown in Table2. It should be noticed that the results
ICC1before regression in Table2were slightly different from
the results presented in Ma et al.(2009), because the range of
fMVCvaries from 0.15 to 0.99 in this paper while it varied from 0.20 to 0.99 inMa et al.(2009) in order to validate the dynamic fatigue model. Some models were sensitive for such a change, e.g. Monod’s model. However, the little change of the valida-tion result does not change the conclusion inMa et al.(2009).
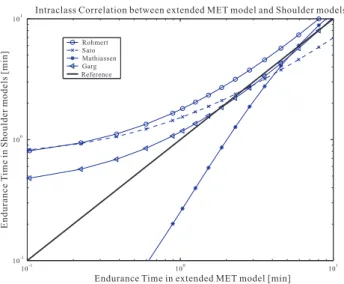
The ICC results for different muscle groups after regression are graphically presented in log-log diagram from Fig. 1to4
as well. The corresponding graphical results before regression can be found inMa et al.(2009). The x-axis is the MET values predicted using the extended MET model at different relative force levels, while the y-axis is the MET values predicted using other MET models at corresponding relative force levels. The straight solid diagonal line is the reference line. For the other models, the one which approaches more closely to the straight line has a higher ICC. If a model coincides completely over the reference line, which means it is identical to the extended MET model.
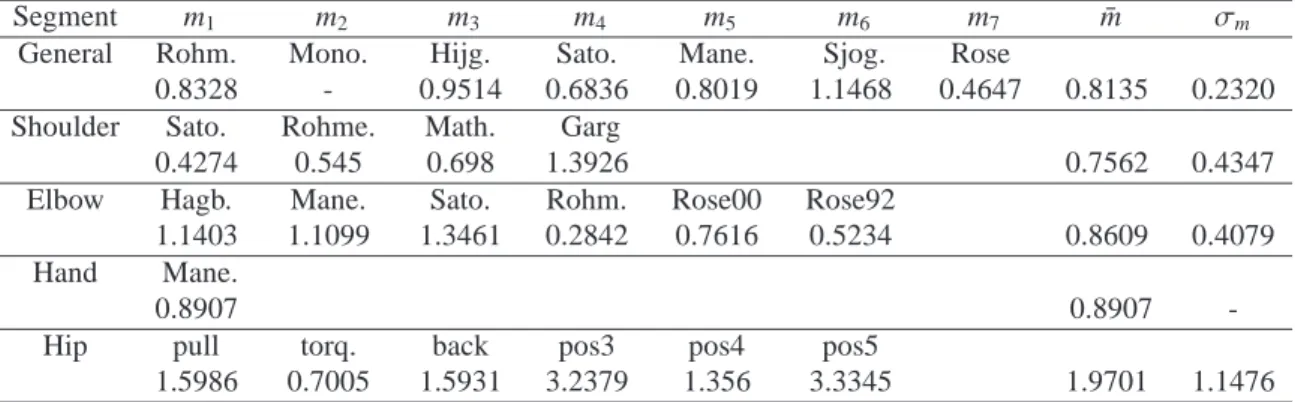
3.2. Fatigue resistance results
The regression results (m) for each MET model are listed in Table3. The mean value ¯m and the standard deviation σmwere calculated for different muscle groups as well. The Monod’s general model is eliminated from the calculation due to its poor
ICC value. The intergroup differences are represented by the
mean value of each muscle group. The Hip/back models have a higher mean value ¯m = 1.9701, while the other human body
segments and the general models have relative lower fatigue resistances ranging from 0.76 to 0.90, without big differences. The fluctuation in each muscle group, namely the intra muscle group difference, is presented by σm. The stability in the gen-eral group is the best, and the hip/back model has the largest variation. There is no big difference between elbow and shoul-der models.
4. Discussion
4.1. Result analysis
ICC: Almost all the ICC2 are greater than 0.89, and only
one is an exception (Monond and Scherrer, 0.4736). This ex-ception is because of its relative worse linear correlation r with the extended MET model, while almost all the other ones have
r over 0.96, and the Monod’s model has only 0.6241. For the
Monod’s model, the linear error occurs mainly when the fMVC approaches to 0.15. This error is mainly caused by the way in which the Monod’s model is formulated. This exception is eliminated in the following analysis and discussion.
There are larger differences between the extended MET model and the empirical MET models, especially when the fMVC ap-proaches to 0.15. Those differences can be explained by the in-terindividual difference in MET, and these differences are greater
for the low %MVC (El ahrache et al.,2006). From the graph-ical representation, it can be noticed that the MET errors are mainly decreased in the range from 100min to 101min, which
means the extended MET model after regression can predict MET with less error than using the extended MET model be-fore regression(refer to Fig.2, Fig. 4, Fig. 6 and Fig. 8 in
Ma et al.(2009)).
The greatest improvement of the fitness between the ex-tended MET model and the empirical MET models is the Hip/Back model (Fig. 4). This approves that the extended MET model with a suitable fatigue ratio can adapt itself well to the most complex part of human body. The same improvement can be found for shoulder models and most of the elbow models. It should be noticed not all the MET models have been improved after the regression. Little fall can be found for the MET mod-els (hand model) with ICC over 0.98 in the ICC1column. The
possible reason is that it has already relative high ICC correla-tion, and the regression does not improve its fitness. However, those models after regression still have high ICC (> 0.95). As a summary, the regression approach achieves high ICC and im-proves the similarity between the extended MET model and the existing models. This proves that the extended MET model can be adapted to fit different body parts, and the extended MET model can predict the MET for static cases.
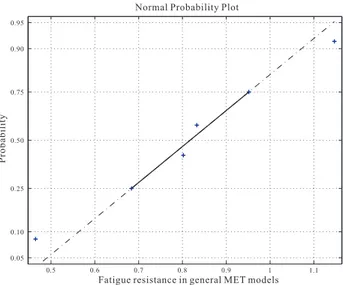
Fatigue resistance: The regression result of the fatigue
re-sistance of different muscle groups were tested with normplot function in Matlab in order to graphically assess whether the fatigue resistances could come from a normal distribution. The test result shows fatigue resistances for general models and el-bow models scatter near the diagonal line in the Fig.5and Fig.
6. Due to limitation of sample numbers in shoulder models and the large variance in hip/back models, the distribution test did not achieve satisfying result. Once there are enough sample models, it can be extrapolated that the fatigue resistances for different muscle groups for the overall population distributes in normal probability, therefore, the mean value locates in ¯m ± σ
could predict the fatigue property of 50% population.
Therefore, the mean value of ¯m and its standard deviation
σm are used to redraw the relation between MET and fMVC, and they are presented from Fig.7to10. The black bold solid line is the extended MET model adjusted by ¯m and it locates
in the range constrained by two slim solid lines adjusted by ¯
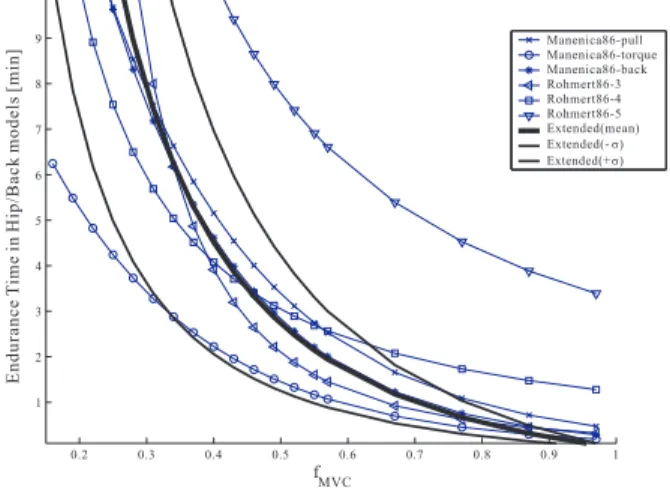
m ± σm. After adjusting our fatigue model with ¯m ± σm, the ex-tended MET fatigue model can cover most of the existing MET models from 15% MVC to 80% MVC. Although there is an ex-ception in Hip/back model due to the relative large variability in hip muscle groups, it should also be admitted that the adjust-ment makes the extended MET model suitable for most of the static cases. In another word, the adjustment by mean and de-viation makes the extended MET model suitable for evaluating the fatigue for the overall population.
The prediction by the extended MET model cannot cover the models for the %MVC over 80 as well as the interval un-der 15%. However in the industrial cases, it is very rare that the force demand can cross that limit 80% in static operations. Even if the physical demand beyond 80%MVC, the prediction difference in the extended MET model from the other MET
Table 2: Static validation results r and ICC between the extended MET model and the other existing MET models inEl ahrache et al.(2006)
Model MET equations (in minutes) r ICC1 ICC2
General models Rohmert MET = −1.5 + f2.1MVC − 0.6 f2 MVC + f0.13 MVC 0.9717 0..9505 0.9707
Monod and Scherrer MET = 0.4167 ( fMVC− 0.14)−2.4 0.6241 0.0465 0.4736
Huijgens MET = 0.865hf1− fMVC
MVC−0.15 i1/1.4
0.9036 0.8947 0.8916
Sato et al. MET = 0.3802 ( fMVC− 0.04)−1.44 0.9973 0.8765 0.9864
Manenica MET = 14.88 exp(−4.48 fMVC) 0.9829 0.9357 0.9701
Sjogaard MET = 0.2997 f−2.14
MVC 0.9902 0.9739 0.9898
Rose et al. MET = 7.96 exp(−4.16 fMVC) 0.9783 0.6100 0.9573
Upper limbs models
Shoulder
Sato et al. MET = 0.398 f−1.29
MVC 0.9988 0.5317 0.9349
Rohmert et al. MET = 0.2955 f−1.658
MVC 0.9993 0.7358 0.8982
Mathiassen and Ahsberg MET = 40.6092 exp(−9.7 fMVC) 0.9881 0.8673 0.9711 Garg MET = 0.5618 f−1.7551
MVC 0.9968 0.9064 0.9947
Elbow
Hagberg MET = 0.298 f−2.14
MVC 0.9902 0.9751 0.9898
Manenica MET = 20.6972 exp(−4.5 fMVC) 0.9832 0.9582 0.9708
Sato et al. MET = 0.195 f−2.52
MVC 0.9838 0.9008 0.9688
Rohmert et al. MET = 0.2285 f−1.391
MVC 0.9997 0.2942 0.9570
Rose et al.2000 MET = 20.6 exp(−6.04 fMVC) 0.9958 0.9627 0.9708
Rose et al.1992 MET = 10.23 exp(−4.69 fMVC) 0.9855 0.7053 0.9766
Hand
Manenica MET = 16.6099 exp(−4.5 fMVC) 0.9832 0.9840 0.9646
Back/hip models
Manenica (body pull) MET = 27.6604 exp(−4.2 fMVC) 0.9789 0.7672 0.9591
Manenica (body torque) MET = 12.4286 exp(−4.3 fMVC) 0.9804 0.8736 0.9634 Manenica (back muscles) MET = 32.7859 exp(−4.9 fMVC) 0.9878 0.8091 0.9819 Rohmert (posture 3) MET = 0.3001 f−2.803
MVC 09655 0.4056 0.9482
Rohmert (posture 4) MET = 1.2301 f−1.308
MVC 0.9990 0.8356 0.9396
Rohmert (posture 5) MET = 3.2613 f−1.256
MVC 0.9984 0.1253 0.9263
Table 3: Fatigue resistance m of different MET models
Segment m1 m2 m3 m4 m5 m6 m7 m¯ σm
General Rohm. Mono. Hijg. Sato. Mane. Sjog. Rose
0.8328 - 0.9514 0.6836 0.8019 1.1468 0.4647 0.8135 0.2320
Shoulder Sato. Rohme. Math. Garg
0.4274 0.545 0.698 1.3926 0.7562 0.4347
Elbow Hagb. Mane. Sato. Rohm. Rose00 Rose92
1.1403 1.1099 1.3461 0.2842 0.7616 0.5234 0.8609 0.4079
Hand Mane.
0.8907 0.8907
-Hip pull torq. back pos3 pos4 pos5
10-1 100 101 10-1
100
101 Intraclass Correlation between extended MET model and General models
Endurance Time in extended MET model [min]
E n d u ra n c e T im e i n G e n e ra l m o d e ls [ m in ] Rohmert Huijgens Sato Manenica Sjogaard Rose Reference
Figure 1: ICC diagram for MET general models after regression
10-1 100 101
10-1 100
101
Intraclass Correlation between extended MET model and Elbow models
Endurance Time in Extended model [min]
E n d u ra n c e T im e i n E lb o w m o d e ls [ m in ] Hagberg Manenica Sato Rohmert Rose00 Rose92 Reference
Figure 2: ICC diagram for MET elbow models after regression
10-1 100 101 10-1 100 101
Intraclass Correlation between extended MET model and Shoulder models
Endurance Time in extended MET model [min]
E n d u ra n c e T im e i n S h o u ld e r m o d e ls [ m in ] Rohmert Sato Mathiassen Garg Reference
Figure 3: ICC diagram for MET shoulder models after regression
10-1 100 101
10-1 100 101
Intraclass Correlation between extended MET model and Hip/back models
Endurance Time in extended MET model [min]
E n d u ra n c e T im e i n H ip /B a c k m o d e ls [ m in ] Manenica86-pull Manenica86-torque Manenica86-back Rohmert86-3 Rohmert86-4 Rohmert86-5 Reference
Figure 4: ICC diagram for Hip/back shoulder models after regression
models is less than one minute.
4.2. The extended MET model versus previous MET models
There are several MET models available in the literature, and they cover different body parts. These models are all ex-perimental models regressed from exex-perimental data, and each model is only suitable for predicting MET of a specific group of people, although the similar tendencies can be found among these models. Furthermore, those MET model cannot reveal individual differences in fatigue characteristic. However, it is admitted that different people might have different fatigue re-sistances for the same physical operation.
In comparison to conventional MET models, the general an-alytical MET model was extended from a simple dynamic tigue model in a theoretical approach. The dynamic muscle fa-tigue model is based on muscle physiological mechanism. It takes account of task parameters (Fload or relative load) and
personal factors (MVC and fatigue ratio k), and it has been val-idated in comparison to other theoretical models in Ma et al.
(2009). Different from the other MET models, in this extended MET model, there is a parameter k representing individual fa-tigue characteristic.
After mathematical regression, great similarities (ICC > 0.90) have been found between the extended MET model and the previous MET models. This indicates that the new theoret-ical MET model might replace the other MET models by ad-justing the parameter k. Therefore, the extended MET model generalizes the formation of MET models.
In addition, different fatigue resistances have been found while fitting to different MET models, even for the same mus-cle group. Therefore, it is interesting to find the influencing factors on the parameter k and to analyze its statistical distribu-tion for ergonomic applicadistribu-tion. In this paper, we tried to use the mean value and standard deviation of the regressed fatigue
re-0.5 0.6 0.7 0.8 0.9 1 1.1 0.05 0.10 0.25 0.50 0.75 0.90 0.95 P ro b a b il it y
Normal Probability Plot
Fatigue resistance in general MET models
Figure 5: Normal distribution test for the general model
0.3 0.4 0.5 0.6 0.7 0.8 0.9 1 1.1 1.2 1.3 0.05 0.10 0.25 0.50 0.75 0.90 0.95 P ro b a b il it y
Normal Probability Plot
Fatigue resistance in elbow MET models
Figure 6: Normal distribution test for the elbow model
sistances. It has been found that the extended MET model with adjustable parameter k could cover most of the MET prediction using experimental MET models. If further experiments can be carried out, it should be promising that the statistical distribu-tion of the fatigue resistance for a given populadistribu-tion could be obtained. This kind of information might be useful to integrate early ergonomic analysis into virtual human simulation tools to evaluate fatigue at early work design stage.
4.3. Influencing factors on fatigue resistance
Although the MET models fitted from experiment data were formulated in different forms, the m can still provide some use-ful information for the fatigue resistance, especially for differ-ent muscle groups. The differences in fatigue resistance result is possible to be concluded by the mean value and the devia-tion, but it is still interesting to know why and how the fatigue resistance is different in different muscle groups, in the same muscle group, and even in the same person at different period. There is no doubt that there are several factors influencing on the fatigue resistance of a muscle group, and it should be very useful if the fatigue resistance of different muscle groups can be mathematically modeled. In this section, the fatigue resistance and its variability are going to be discussed in details based on the fatigue resistance results from Table3and the previous liter-ature about fatigability. Different influencing factors are going to be discussed and classified in this section.
All the differences inter muscle groups and intra muscle groups in MET models can be classified into four types: 1) Sys-tematic bias, 2) Fatigue resistance inter individual for construct-ing a MET model, 3) Fatigue resistance intra muscle group: fatigue resistance differences for the same muscle group, and 4) Fatigue resistance inter muscle groups: fatigue resistance differences for different muscle groups. Those differences can be attributed to different physiological mechanisms involved in different tasks, and influencing variables are subject motivation, central command, intensity and duration of the activity, speed
and type of contraction, and intermittent or sustained activi-ties (Enoka,1995;Elfving and Dedering,2007). In those MET models, all the contractions were exerted under static condi-tions until exhaustion of muscle groups, therefore, several task related influencing factors can be neglected in the discussion, e.g., speed and duration of contraction. The other influencing factors might contribute to the fatigue resistance difference in MET models.
Systematic bias : all the MET models were regressed or
reanalyzed based on experiment results. Due to the experimen-tal background, there were several sources for systematic er-ror. One possible source of the systematic bias comes from ex-perimental methods and model construction (El ahrache et al.,
2006), especially for the methods with subjective scales to mea-sure MET. The subjective feelings significantly influenced the result. Furthermore, the construction of the MET model might cause system differences for MET model, even in the models which were constructed from the same experiment data (e.g. Huijgens’ model and Sjogaard’s model in General models). The estimation error was different while using different mathematic models, and it generates systematic bias in the result analysis.
Fatigue resistance inter individual : besides the
system-atic error, another possible source for the endurance difference is from individual characteristic. However, the individual char-acteristic is too complex to be analyzed, and furthermore, the individual characteristic is impossible to be separated from ex-isting MET models, since the MET models already represent the overall performance of the sample participants. In addition, in ergonomic application, the overall performance of a popula-tion is often concerned. Therefore, individual fatigue resistance is not discussed in this part separately, but the differences in population in fatigue resistance are going to be discussed and presented in the following part.
Fatigue resistance intra muscle group : the inter
indi-vidual variability contributes to the errors in constructing MET models and the errors between MET models for the same
mus-0.2 0.3 0.4 0.5 0.6 0.7 0.8 0.9 1 1 2 3 4 5 6 7 8 9 10
Prediction of MET using extended MET model in comparison with General static models
f MVC E n d u ra n c e T im e i n G e n e ra l m o d e ls [ m in ] Rohmert Huijgens Sato Manenica Sjogaard Rose Extended(mean) Extended(-σ) Extended(+σ)
Figure 7: MET prediction using extended MET model in comparison with general static models
0.2 0.3 0.4 0.5 0.6 0.7 0.8 0.9 1 1 2 3 4 5 6 7 8 9 10
Prediction of MET using extended MET model in comparison with Elbow static models
f MVC E n d u ra n c e T im e i n E lb o w m o d e ls [ m in ] Hagberg Manenica Sato Rohmert Rose00 Rose92 Extended(mean) Extended(- σ) Extended(+σ)
Figure 8: MET prediction using extended MET model in comparison with elbow static models
0.2 0.3 0.4 0.5 0.6 0.7 0.8 0.9 1 1 2 3 4 5 6 7 8 9 10
Prediction of MET using extended MET model in comparison with Shoulder static models
f MVC E n d u ra n c e T im e i n S h o u ld e r m o d e ls [ m in ] Rohmert Sato Mathiassen Garg Extended(mean) Extended(- σ) Extended(+σ)
Figure 9: MET prediction using extended MET model in comparison with shoulder static models
0.2 0.3 0.4 0.5 0.6 0.7 0.8 0.9 1 1 2 3 4 5 6 7 8 9 10
Prediction of MET using extended MET model in comparison with Hip/back static models
f MVC E n d u ra n c e T im e i n H ip /B a c k m o d e ls [ m in ] Manenica86-pullManenica86-torque Manenica86-back Rohmert86-3 Rohmert86-4 Rohmert86-5 Extended(mean) Extended(-σ) Extended(+σ)
Figure 10: MET prediction using extended MET model in comparison with hip/back static models
cle group. The influencing factors on the fatigue resistance can be mainly classified into sample population characteristic (gen-der, age, and job), personal muscle fiber composition, and pos-ture.
As mentioned in Section 1, the influences on fatigability from gender and age were observed in the literature. In the re-search for gender influence, women were found with more fa-tigue resistance than men. Based on muscle physiological prin-ciple, four families of factors were adopted to explain the fati-gability difference in gender in Hicks et al.(2001). They are: 1) muscle strength (muscle mass) and associated vascular oc-clusion, 2) substrate utilization, 3) muscle composition and 4) neuromuscular activation patterns. It concluded that although the muscle composition differences between men and women is relatively small (Staron et al., 2000), the muscle fiber type area is probably one reason for fatigability difference in gender, since the muscle fiber type I occupied significantly larger area in women than in men (Larivi`ere et al.,2006). In spite of mus-cle fiber composition, the motor unit recruitment pattern acts
influences on the fatigability as well. The gender difference in neuromuscular activation pattern was found and discussed inLarivi`ere et al.(2006), and it was observed significantly that females showed more alternating activity between homolateral and contralateral muscles than males.
Meanwhile, inMademli and Arampatzis(2008) older men were found with more endurance time then young men in cer-tain fatigue test tasks charging with the same relative load. One of the most common explanations is changes in muscle fiber composition for fatigability change while aging. The shift to-wards a higher proportion of muscle fiber type I leads old adults having a higher fatigue resistance but smaller MVC. Gender and age were also already taken into a regression model to predict shoulder flexion endurance (Mathiassen and Åhsberg,
1999). InNussbaum(2009), the effects of age, gender, and task parameters on muscle fatigue during prolonged isokinetic torso exercises were studied. It constated that older men had less ini-tial strength. It was also found that effects of age and gender on fatigue were marginal, while significant interactive effects
of age and gender with effort level were found at the same time. Besides those two reasons, the muscle fiber composition of muscle varies individually in the population, even in a same age range and in the same gender (Staron et al.,2000), and this could cause different performances in endurance tasks. Differ-ent physical work history might change the endurance perfor-mance. For example, it appeared that athletes with different fiber composition had different advantages in different sports: more type I muscle fiber, better in prolonged endurance events (Wilmore et al.,2008). Meanwhile, the physical training could also cause shift between different muscle fibers (Costill et al.,
1979). As a result, individual fatigue is very difficult to be de-termined using MET measurement (Vøllestad,1997), and the individual variability might contribute to the differences among MET models for the same muscle group due to selection of sub-jects.
Back to the existing MET models, the sample population was composed of either a single gender or mixed. At the same time, the number of the subjects was sometimes relative small. For example, only 5 female students (age range 21–33) were measured (Garg et al., 2002), while 40 (20 males, age range 22–48 and 20 females, age range 20–55) were tested in shoulder MET model (Mathiassen and Åhsberg,1999). Meanwhile, the characteristics of population (e.g., students, experiences work-ers) could cause some differences in MET studies. Due to dif-ferent population selection method, difdif-ferent gender composi-tion, and different sample number of participant, fatigue resis-tance for the same muscle group exists in different experiment results and finally caused different MET models under the sim-ilar postures.
In Hip/back models, even with the same sample partici-pants, difference existed also in MET models for different pos-tures. The variation is possible caused by the different MU re-cruitment strategies and load sharing mechanism under differ-ent postures. Kasprisin and Grabiner(2000) observed that the activation of biceps brachi was significantly affected by joint angle, and furthermore confirmed that joint angle and contrac-tion type contributed to the distinccontrac-tion between the activacontrac-tion of synergistic elbow flexor muscles. The lever of each individual muscle changes along different postures which results different intensity of load for each muscle and then causes different fa-tigue process for different posture. Meanwhile, the contraction type of each individual muscle might be changed under differ-ent posture. Both contraction type change and lever differences contribute to generate different fatigue resistance globally. In addition, the activation difference was also found in antago-nist and agoantago-nist (Karst and Hasan,1987;Mottram et al.,2005) muscles as well, and it is implied that in different posture, the engagement of muscles in the action causes different muscle activation strategy, and as a result the same muscle group could have different performances. With these reasons, it is much dif-ficult to indicate the contribution of posture in fatigue resistance because it refers to the sensory-motor mechanism of human, and how the human coordinates the muscles remains not clear enough until yet.
Fatigue resistance inter muscle groups: As stated before,
the three different muscle fiber types have different fatigue
re-sistances, and different muscle is composed of types of mus-cles with composition determining the function of each muscle (Chaffin et al.,1999). The different fatigue resistance can be explained by the muscle fiber composition in different human muscle groups.
In the literature, muscle fiber composition was used mea-sured by two terms: muscle fiber type percentages and per-centage fiber type area (CSA: cross section area). Both terms contribute to the fatigue resistance of the muscle groups. Type I fibers occupied 74% of muscle fibers in the thoracic mus-cles, and they amounted 63% in the deep muscles in lumbar region (Sirca and Kostevc,1985). On average type I muscle fibers ranged from 23 to 56% for the muscles crossing the hu-man shoulder and 12 of the 14 muscles had average SO pro-portions ranging from 35 to 50% (Dahmane et al.,2005). In paper (Staron et al.,2000;Shepstone et al.,2005), the muscle fiber composition shows the similar composition for the muscle around elbow and vastus lateralis muscle and the type I mus-cle fibers have a proportion from 35 - 50% in average. Al-though we cannot determine the relationship between the mus-cle type composition and the fatigue resistance directly and the-oretically, the composition distribution among different muscle groups can interpret the MET differences between general, el-bow models and back truck models. In addition, the fatigue resistance of older adults is greater than young ones could also be explained by a shift towards a higher proportion of type I fiber composition with aging. These evidences meet the physi-ological principle of the dynamic muscle fatigue model.
Another possible reason is the loading sharing mechanism of muscles. Hip and back muscle group has the maximum joint moment strength (Chaffin et al.,1999) among the impor-tant muscle groups. For example, the back extensors are com-posed of numerous muscle slips having different moment arms and show a particularly high resistance to fatigue relative to other muscle groups (Jorgensen,1997). This is partly attributed to favorable muscle composition, and the variable loading shar-ing within back muscle synergists might also contribute signif-icantly to delay muscle fatigue.
In summary, individual characteristics, population charac-teristics, and posture are external appearance of influencing fac-tors for the fatigue resistance. Muscle fiber composition, mus-cle fiber area, and sensory motor coordination mechanism are the determinant factors inside the human body deciding the fa-tigue resistance of muscle group. Therefore, how to construct a bridge to connect the external factors and internal factors is the most important way for modeling the fatigue resistance for dif-ferent muscle groups. How to combine those factors to model the fatigue resistance remains a challenging work. Despite the difficulty of modeling the fatigue resistance, it is still applicable to find the fatigue resistance for a specified population by MET experiments in regression with the extended MET model due to its simplicity and universal availability.
4.4. Limitations
In the previous discussion, the fatigue resistance of the ex-isting MET models were quantified using m from regression. The possible reasons for the different fatigue resistance were
analyzed and discussed. However, how to quantify the influ-ence from different factors on the fatigue resistance remains unknown due to the complexity of muscle physiology and the correlation among different factors.
The availability of the extended MET model in the interval under 15% MVC is not validated. The fatigue resistance is only accounted from the 15% to 99% MVC due to the unavailability of some MET models under 15% MVC. For the relative low load, the individual variability under 15% could be much larger than that over 15%. The recovery effect might play a much more significant role within such a range.
5. Conclusions and perspectives
In this paper, fatigue resistance of different muscle groups were calculated by linear regression from the new fatigue model and the existing MET static models. High ICC has been ob-tained by regression which proves that our fatigue model can be generalized to predict MET for different muscle groups. Mean and standard deviation in fatigue resistance for different muscle groups were calculated, and it is possible to use both of them together to predict the MET for the overall population. The pos-sible reasons responpos-sible for the variability of fatigue resistance were discussed based on the muscle physiology.
Our fatigue model is relative simple and computation ef-ficient. With the extended MET model it is possible to carry out the fatigue evaluation in virtual human modeling and er-gonomic application, especially for static and quasi-static cases. The fatigue effect of different muscle groups can be evaluated by fitting k from several simple static experiments for certain population.
Acknowledgments
This research was supported by the EADS and the R´egion des Pays de la Loire (France) in the context of collaboration between the ´Ecole Centrale de Nantes (Nantes, France) and Ts-inghua University (Beijing, PR China).
References
Anderson, D., Madigan, M., Nussbaum, M., 2007. Maximum voluntary joint torque as a function of joint angle and angular velocity: Model development and application to the lower limb. Journal of Biomechanics 40 (14), 3105– 3113.
Badler, N. I., Phillips, G. B., Webber, B. L., 1993. Simulating Humans: Com-puter Graphics Animation and Control. Oxford University Press, USA. Chaffin, D. B., Andersson, G. B. J., Martin, B. J., 1999. Occupational
Biome-chanics, 3rd Edition. Wiley-Interscience.
Clark, B., Manini, T., 2003. The DJ, Doldo NA, Ploutz-Snyder LL. Gender differences in skeletal muscle fatigability are related to contraction type and EMG spectral compression. Journal of Applied Physiology 94 (6), 2263– 2272.
Costill, D., Coyle, E., Fink, W., Lesmes, G., Witzmann, F., 1979. Adaptations in skeletal muscle following strength training. Journal of Applied Physiology 46 (1), 96–99.
Dahmane, R., Djordjeviˇc, S., ˇSimuniˇc, B., Valenˇciˇc, V., 2005. Spatial fiber type distribution in normal human muscle histochemical and tensiomyographical evaluation. Journal of Biomechanics 38 (12), 2451–2459.
Ding, J., Wexler, A. S., Binder-Macleod, S. A., 2003. Mathematical models for fatigue minimization during functional electrical stimulation. Electromyog-raphy Kinesiology 13 (6), 575–588.
El ahrache, K., Imbeau, D., 2009. Comparison of rest allowance models for static muscular work. International Journal of Industrial Ergonomics 39 (1), 73–80.
El ahrache, K., Imbeau, D., Farbos, B., 2006. Percentile values for determining maximum endurance times for static muscular work. International Journal of Industrial Ergonomics 36 (2), 99–108.
Elfving, B., Dedering, Å., 2007. Task dependency in back muscle fatigue– Correlations between two test methods. Clinical Biomechanics 22 (1), 28– 33.
Enoka, R., 1995. Mechanisms of muscle fatigue: central factors and task de-pendency. Journal of Electromyography and Kinesiology 5 (3), 141–149. Freund, J., Takala, E., 2001. A dynamic model of the forearm including fatigue.
Journal of Biomechanics 34 (5), 597–605.
Garg, A., Hegmann, K., Schwoerer, B., Kapellusch, J., 2002. The effect of maximum voluntary contraction on endurance times for the shoulder girdle. International Journal of Industrial Ergonomics 30 (2), 103–113.
Giat, Y., Mizrahi, J., Levy, M., 1993. A musculotendon model of the fatigue profiles of paralyzed quadriceps muscle under FES. IEEE Transaction on Biomechanical Engineering 40 (7), 664–674.
Hicks, A., Kent-Braun, J., Ditor, D., 2001. Sex differences in human skeletal muscle fatigue. Exercise and Sport Sciences Reviews 29 (3), 109–112. Hill, A., 1938. The heat of shortening and the dynamic constants of muscle.
Proceedings of the Royal Society of London. Series B, Biological Sciences 126 (843), 136–195.
Hou, H., Sun, S., Pan, Y., 2007. Research on virtual human in ergonomic sim-ulation. Computer and Industrial Engineering 53 (2), 350–356.
Hunter, S., Critchlow, A., Enoka, R., 2004. Influence of aging on sex differences in muscle fatigability. Journal of Applied Physiology 97 (5), 1723–1732. Jorgensen, K., 1997. Human trunk extensor muscles physiology and
er-gonomics. Acta Physiologica Scandinavica. Supplementum 637, 1–58. Karst, G., Hasan, Z., 1987. Antagonist muscle activity during human forearm
movements under varying kinematic and loading conditions. Experimental Brain Research 67 (2), 391–401.
Kasprisin, J., Grabiner, M., 2000. Joint angle-dependence of elbow flexor ac-tivation levels during isometric and isokinetic maximum voluntary contrac-tions. Clinical Biomechanics 15 (10), 743–749.
Kim, S., Seol, H., Ikuma, L., Nussbaum, M., 2008. Knowledge and opinions of designers of industrialized wall panels regarding incorporating ergonomics in design. International Journal of Industrial Ergonomics 38 (2), 150–157. Komura, T., Shinagawa, Y., Kunii, T. L., 1999. Calculation and visualization
of the dynamic ability of the human body. The Journal of Visualization and Computer Animation 10 (2), 57–78.
Kumar, R., Kumar, S., 2008. Musculoskeletal risk factors in cleaning occu-pation: a literature review. International Journal of Industrial Ergonomics 38 (2), 158–170.
Larivi`ere, C., Gravel, D., Gagnon, D., Gardiner, P., Bertrand Arsenault, A., Gaudreault, N., 2006. Gender influence on fatigability of back muscles dur-ing intermittent isometric contractions: A study of neuromuscular activation patterns. Clinical Biomechanics 21 (9), 893–904.
Liu, J. Z., Brown, R. W., Yue, G. H., 2002. A dynamical model of muscle activation, fatigue, and recovery. Biophysical Journal 82 (5), 2344–2359. Lynch, N., Metter, E., Lindle, R., Fozard, J., Tobin, J., Roy, T., Fleg, J., Hurley,
B., 1999. Muscle quality. I. Age-associated differences between arm and leg muscle groups. Journal of Applied Physiology 86 (1), 188–194.
Ma, L., Chablat, D., Bennis, F., Zhang, W., 2009. A new simple dynamic mus-cle fatigue model and its validation. International Journal of Industrial Er-gonomics 39 (1), 211–220.
Mademli, L., Arampatzis, A., 2008. Effect of voluntary activation on age-related muscle fatigue resistance. Journal of biomechanics 41 (6), 1229– 1235.
Mathiassen, S. E., Åhsberg, E., 1999. Prediction of shoulder flexion endurance from personal factors. International Journal of Industrial Ergonomics 24 (3), 315–329.
Mottram, C., Jakobi, J., Semmler, J., Enoka, R., 2005. Motor-unit activity dif-fers with load type during a fatiguing contraction. Journal of Neurophysiol-ogy 93 (3), 1381–1392.
Niemi, J., Nieminen, H., Takala, E., Viikari-Juntura, E., 1996. A static shoulder model based on a time-dependent criterion for load sharing between
syner-gistic muscles. Journal of Biomechanics 29 (4), 451–460.
Nussbaum, M., 2009. Effects of age, gender, and task parameters on fatigue development during intermittent isokinetic torso extensions. International Journal of Industrial Ergonomics 39 (1), 185–191.
Ren, L., Jones, R., Howard, D., 2007. Predictive modelling of human walking over a complete gait cycle. Journal of Biomechanics 40 (7), 1567–1574. Rodr´ıguez, I., Boulic, R., Meziat, D., 2003. A joint-level model of fatigue for
the postural control of virtual humans. Journal of Three Dimensional Images 17 (1), 70–75.
Rohmert, W., 1960. Ermittlung von Erholungspausen f¨ur statische Arbeit des Menschen. European Journal of Applied Physiology 18 (2), 123–164. Shepstone, T., Tang, J., Dallaire, S., Schuenke, M., Staron, R., Phillips, S.,
2005. Short-term high- vs. low-velocity isokinetic lengthening training re-sults in greater hypertrophy of the elbow flexors in young men. Journal of Applied Physiology 98 (5), 1768–1776.
Sirca, A., Kostevc, V., 1985. The fibre type composition of thoracic and lumbar paravertebral muscles in man. Journal of Anatomy 141, 131–137. Staron, R., Hagerman, F., Hikida, R., Murray, T., Hostler, D., Crill, M., Ragg,
K., Toma, K., 2000. Fiber type composition of the vastus lateralis muscle of young men and women. Journal of Histochemistry and Cytochemistry 48 (5), 623.
Vignes, R. M., 2004. Modeling muscle fatigue in digital humans. Master’s the-sis, Graduate College of The University of Iowa.
Vøllestad, N. K., 1997. Measurement of human muscle fatigue. Journal of Neu-roscience Methods 74 (2), 219–227.
Westgaard, R., 2000. Work-related musculoskeletal complaints: some er-gonomics challenges upon the start of a new century. Applied Erer-gonomics 31 (6), 569–580.
Wilmore, J., Costill, D., Kenney, W., 2008. Physiology of Sport and Exercise. Human Kinetics.
Xia, T., Frey Law, L., 2008. A theoretical approach for modeling peripheral muscle fatigue and recovery. Journal of Biomechanics 41 (14), 3046–3052.