HAL Id: hal-01816578
https://hal.archives-ouvertes.fr/hal-01816578
Submitted on 15 Jun 2018
HAL is a multi-disciplinary open access
archive for the deposit and dissemination of
sci-entific research documents, whether they are
pub-lished or not. The documents may come from
teaching and research institutions in France or
abroad, or from public or private research centers.
L’archive ouverte pluridisciplinaire HAL, est
destinée au dépôt et à la diffusion de documents
scientifiques de niveau recherche, publiés ou non,
émanant des établissements d’enseignement et de
recherche français ou étrangers, des laboratoires
publics ou privés.
A Real-World Evaluation of Energy Budget Estimation
Algorithms for Autonomous Long Range IoT Nodes
Philip-Dylan Gleonec, Jeremy Ardouin, Matthieu Gautier, Olivier Berder
To cite this version:
Philip-Dylan Gleonec, Jeremy Ardouin, Matthieu Gautier, Olivier Berder. A Real-World Evaluation
of Energy Budget Estimation Algorithms for Autonomous Long Range IoT Nodes. International
Conference on Telecommunication, Jun 2018, Saint-Malo, France. �hal-01816578�
A Real-World Evaluation of Energy Budget
Estimation Algorithms for Autonomous Long
Range IoT Nodes
Philip-Dylan Gleonec
Wi6labs / Univ Rennes, CNRS, IRISA 1137A Avenue des Champs Blancs
35510 Cesson-S´evign´e [email protected]
Jeremy Ardouin
Wi6labs
1137A Avenue des Champs Blancs 35510 Cesson-S´evign´e [email protected]
Matthieu Gautier and Olivier Berder
Univ Rennes, CNRS, IRISA 6 rue Kerampont F-22305 Lannion Cedex
[email protected], [email protected]
Abstract— In order to enable IoT nodes to efficiently use their energy harvesting capabilities, algorithms are used to determine a reasonable energy budget and allocate it to the node tasks, enabling energy neutral operation. However, most of these algorithms have been implemented and evaluated in simulation frameworks. In this paper, we evaluate the implementation of these algorithms to manage the energy of real-world LoRaWAN IoT nodes. We measure and compare the performance of the different energy budget estimation methods on a commercial LoRaWAN IoT platform. Results show that in this use-case, the choice of algorithm impacts the system Quality of Service by less than 15 %. This enables much simpler energy budget estimation methods to be used.
I. INTRODUCTION
Wireless sensor networking has recently been an active research area for both industries and academic institutions. In particular, a lot of work is focused on increasing the battery life of wireless sensor nodes. This can be achieved by reducing the power consumption of individual components power consumption, using duty-cycling strategies [1], or using low power transmission technologies such as LoRa. Yet the use of non-rechargeable batteries limits the lifetime of the system and creates waste when this battery is depleted. Thus, the use of energy harvesting and rechargeable batteries has been considered [2]. In such a system, more energy is made available to the node, enabling a longer lifetime of the system. By adapting the Quality of Service (QoS) of the node to its energy harvesting capabilities, it is possible to reach an energy neutral operation point, and have a theoretically infinite battery life [3]. To do so, energy harvesting nodes use a power manager subsystem. This subsystem can be divided in two elements : an Energy Budget Estimator (EBE) which calculates an energy budget based on the harvested energy and the state of charge of the battery, and an Energy Allocator that decides how to spend this energy budget on different tasks, such as sensing, transmitting a message or processing data. Instinctively, we can see that the node QoS is linked to its EBE : a larger energy budget will enable a higher QoS, but will deplet the battery more quickly.
EBE algorithms can be model-based [4] [5], in which case they use the behavior of the energy source to adapt the energy budget according to an estimation of the future harvested energy. On the contrary, model-free EBE can be used independently of the used energy harvesting source. LQ-tracker [6], Fuzzyman [7] and RLMan [8] are examples of such algorithms, which respectively rely on linear quadratic regres-sion, fuzzy logic and reinforcement learning to calculate an optimal energy budget. The performance of these algorithms has been verified and studied with extensive simulations.
However, to our knowledge, none of these algorithms have been implemented on commercial wireless sensor platforms. Moreover, these designs target short range communications, and the use of energy harvesting for Long Range IoT nodes has not been studied. In this paper, we compare the performance of four different model-free EBE algorithms in the context of a commercial implementation of solar powered LoRaWAN sensor nodes.
The rest of the paper is organized as follows. Section II describes the energy harvesting node platform and our design choices for the power manager. Section III details the implementation and choice of EBE algorithms. Section IV explores the tuning requirements of each algorithm. Section V shows and analyses our experimental results. Finally, Section VI concludes this article.
II. EVALUATIONPLATFORM ANDREQUIREMENTS
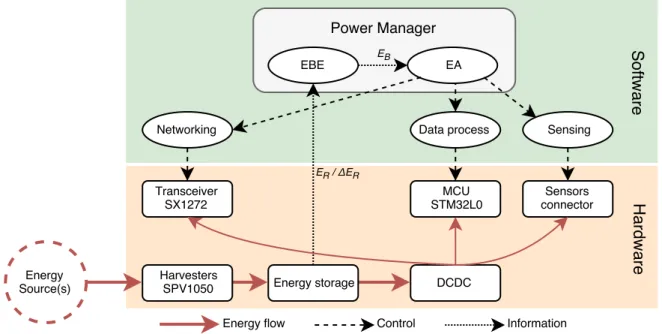
Our evaluation platform targets long range applications with multi-source energy harvesting capabilities [9]. Fig. 1 shows both hardware and software descriptions of the platform. An IoT node is usually composed of a micro-controller, a radio transceiver and some sensors, respectively a STM32L0, a SX1272 LoRa transceiver, and a connector to plug different sensors in our platform. Moreover, three SPV1050 energy harvesters enable simultaneous energy harvesting from a solar panel, a wind turbine and a thermo-electric generator. The harvesters use a common energy storage device which powers the platform through a DC to DC converter. The storage device can be a super-capacitor or a lithium-polymer (LiPo) battery.
Fig. 1: Evaluation platform overview.
In this work, a 7.5 F super-capacitor is used. Due to the board configuration, it is used between 3.7 V and 4.1 V.
The LoRaWAN technology uses the LoRa chirp spread spectrum (CSS) modulation to send short messages over long distances with a limited power consumption. LoRaWAN uses a star topology, where all the nodes send their messages to a gateway over unlicensed frequency bands. These bands are regulated to avoid interferences between radio devices. In Europe, LoRaWAN transmitters must respect a maximum duty cycle (i.e. 1% in the 868-868.6MHz sub-band and 0.1% in the 868.7-869.2 sub-band), which limits the maximal QoS of a LoRa node. The duration of a LoRa transmission depends on the payload size and the CSS spreading factor, which is -in short - the duration of a chirp and is dynamically modified according to the transmission conditions. A higher spreading factor enables a better sensitivity, increasing the transmission range, but reduces the throughput, increasing the energy cost of a transmission.
As we use a different radio technology, the operating conditions of the EBE algorithms differ from the state-of-the-art. The delay between two messages in our application ranges from minutes to hours, while the delay targeted by state-of-the-art EBEs ranges from seconds to minutes. This means that EBE algorithms will need more time to converge to the best result. Moreover, the energy consumption of a LoRa transmission is higher than lower range technologies due to long packet transmissions, which creates higher variations in the battery state-of-charge.
Usually, EBE algorithms are periodically executed, at the end of a timeslot (e.g. 1 hour), and aim to reach the energy neutral operation point for the next timeslot. In our application, to avoid a long convergence time, the EBE algorithm is executed after each transmission. The delay D [k] to the next
message is calculated based on the current energy harvesting conditions. This enables greater agility, as the EBE can recover from a previous bad estimation more quickly. However, this also increases the variance of the QoS, as the algorithm has more difficulty converging to an optimized result.
III. EBE IMPLEMENTATIONS
The EBE algorithms have been implemented in a C library. Since the micro-controller has no Floating-Point Unit, the li-brary was implemented using a portable fixed-point arithmetics library. This enables the validation of the EBE library on a computer before being implemented on a target node and speeds up development time.
Most EBE algorithms calculate an energy budget EB for
the starting timeslot based on the residual energy ER of the
energy storage device when EB is calculated [6]. Some EBE
algorithms [7] also need the measurement of the harvested energy EH. However, the latter is difficult to perform with
a good precision and low energy consumption overhead, and can sometimes be estimated by the residual energy variation ΔER. Some algorithms [8] are tightly coupled with the energy
allocator and require typical energy consumption ECtyp.
Additionally, we define two applications parameters Dmax
and Dmin, respectively as the maximum and minimum delay
in seconds between two transmissions, used to set a minimal QoS. The library uses these parameters to calculate a minimal and maximal energy budget EBmin and EBmax. We also
define DREF as the delay between two transmissions when
EB is equal to ECtyp, set between Dmin and Dmax. These
parameters are dependent on the end-application and are customizable. D (in seconds) is calculated from EBand ECtyp
D = DREF × ECtyp EB
(1) The library also needs information about the underlying hardware energy capabilities. We denote VBAT T, Vmin and
Vmaxthe current, minimal and maximal battery voltage. Vmin
if the voltage for which the platform stops functioning, or can be set with a margin before the battery is fully depleted. When the energy storage is a super-capacitor, its capacitance C is defined. Based on these parameters, the current, minimal and maximal residual energy in storage ER, ERmin and ERmax
are calculated.
The evaluation platform is able to use multiple energy sources simultaneously. Model-based EBE are developed for a single source type, and are unsuitable for this use-case. Thus, model-free EBE algorithms are used. The resulting platform is more generic, and can be used in more end-user applications. In particular, we studied LQ-tracker [6] and Fuzzyman [7], which both showed good results in previous evaluation. LQ-tracker can be implemented using only the energy state-of-charge as input. While Fuzzyman in its original design also requires EH, which is not measured in our platform. In this
work, we consequently use a custom rule-set that uses ΔER
as input instead of EH, and uses the last energy budget
EB[k− 1] to determine the new EB. The rules are detailed
in Table 1 and only depends on the application and platform parameters and can be reused for a variety of applications and energy sources. ER Empty Full ΔER < 0 EBmin f (EB[k− 1]) = 0 f (EB[k− 1]) EB[k− 1] > 0 EB[k− 1] EBmax
TABLE I: Fuzzyman custom rule-set. In Table 1 f(EB[k−1])is a function defined by :
f (EB[k− 1]) = max � EBmin, ER− ERmin ERmax− ERmin .EB[k− 1] � (2) Besides, we implemented two naive EBE algorithms : Linear T and Linear E. Linear E calculates an energy budget between EBmin and EBmax as a prorata of VBAT T between
Vmin and Vmax :
EB = EBmin+(EBmax−EBmin)×
�V
BAT T − Vmin
Vmax− Vmin
� (3) Linear T calculates a fixed delay between Dminand Dmax
as a proportion of VBAT T[k]between Vmin and Vmax. This
delay is then converted to an energy budget based on ECtyp.
The full equation is given by :
EB= DREF× ECtyp
Dmax− (Dmax− Dmin)×
�
VBAT T−Vmin
Vmax−Vmin
� (4)
These two algorithms are used as a performance baseline to evaluate the advantages of more advanced control algorithms. Their advantage is their simplicity, as no settings are required beyond the common platform settings. Finally, to avoid sharp EB variations due to temporary change in energy harvesting
conditions, all algorithms outputs are smoothed by an adaptive filter with a parameter β = 0.9 :
EBf iltered[k] = β× EB+ (1− β) × EBf iltered[k− 1] (5)
IV. EBE ALGORITHMSTUNING
All the selected algorithms can be tuned in order to improve their performance. The library has been designed to be por-table, which enables the algorithms to be tuned in a simulation framework using the same code and same results. Indeed, it is much longer to run a full measurement campaign to validate an algorithm tuning settings than to run a simulation. This is particularly true for algorithms which provide many settings, such as Fuzzyman.
Each EBE algorithm has its tuning capabilities. Linear T and Linear E only need the common platform parameters, Vmin and Vmax, which can be adjusted to increase the
efficiency of the EBE. LQ-tracker requires more parameters : it takes as input an energy target level ET ARGET, a step-size
µ and two parameter vectors Φ and Θ. ET ARGET value is
dependent on the application. µ is set by default to 0.001 and impacts how quick LQ-tracker converges. Fuzzyman is the hardest one to tune, as it can be entirely redesigned to fit the application. Indeed, it requires four thresholds T HREmpty,
T HRF ull, T HRP ositive and T HRN egative to set the limits
of the fuzzy inputs. Moreover, the entire rule-set may be redesigned to provide better performances.
For our simulation, the delay between two messages is set between of 15 minutes to 3 hours. The energy consumed by a LoRaWAN transmission is estimated to 140mJ with a SF7 spreading factor. We set Vmin and Vmax respectively to
3.7 V and 4.1 V, as for our real energy storage. The system was tested with a solar energy source, using EnHANTS [10] measurement data. The simulated solar panel measures 3.2 cm per 4.2 cm with an efficiency of φ = 10%, like the one used in experimentation. The simulation results, without tuning, are shown in Table II. The mean value ¯x and standard deviation σ of VBAT T, EB and D are presented.
We can first notice that all algorithms have some failed transmission, meaning some transmissions were aborted due to VBAT T being lower than Vmin. Most of them occur around
a lack of data in the solar traces, which we kept to simulate a long period without energy. Two algorithms, Fuzzyman and Linear T, are more conservative, which can be seen as they keep a higher and more stable VBAT T, and thus emit less
messages than the other two. EB of Fuzzyman is high and
unstable, which shows that it sometimes tries to deliver an EB
too high and can not stabilize. Linear E and LQ-tracker, on the other hand, take more risks, showing a lower mean VBAT T,
Fuzzyman Linear E Linear T LQ-tracker ¯ x σ xn¯ σ x¯ σ x¯ σ VBAT T(V) 4.060 0.058 4.010 0.103 4.056 0.070 3.988 0.107 EB(J) 0.454 0.163 0.446 0.125 0.364 0.155 0.529 0.107 D(min) 29 36 24 23 33 27 21 28 Tx 18201 22624 16452 25814 Failed Tx 7 31 13 31
TABLE II: Simulation before algorithm tuning.
We tried to improve the performance of each algorithm by tuning their parameters in order to maximize the number of transmissions. For Linear E and Linear T, we set Vmin to
3.75 instead of 3.7 V, and Vmax to 3.85 V instead of 4.1 V.
This enables both algorithms to be more conservative when the energy storage is nearly depleted and take more risks when it is sufficiently replenished. We increase the step-size µof LQ-tracker to 0.005, and leave Φ and Θ to their default values, fixed in [6]. Fuzzyman was given a new ruleset, shown in Table III, while the fuzzification thresholds T HREmpty,
T HRF ull, T HRP ositiveand T HRN egativewere respectively
set to 1.03 × ERf ail, 0.85 × ERmax, 0.35 and −0.5. The
simulation was run again with the new settings, and Table IV shows the results.
ER Empty Full ΔER < 0 EBmin 0.95× EB[k−1] = 0 0.95× EB[k−1] 1.5× EB[k−1] > 0 1.5× EB[k−1] EBmax
TABLE III: Fuzzyman new ruleset.
Fuzzyman Linear E Linear T LQ-tracker ¯ x σ ¯x σ x¯ σ ¯x σ VBAT T (V) 3.978 0.116 3.985 0.109 3.996 0.100 3.988 0.107 EB(J) 0.530 0.100 0.528 0.107 0.526 0.117 0.528 0.107 D(min) 20 27 21 27 21 27 21 28 Tx 26217 25947 25284 25800 Failed Tx 36 33 28 31
TABLE IV: Simulation after algorithm tuning. After optimization, there is little difference between the performance of the different EBE algorithms. In our use-case, the energy budget EB is limited between a minimal value
EBminand a maximal value EBmax. Thus all EBE algorithms
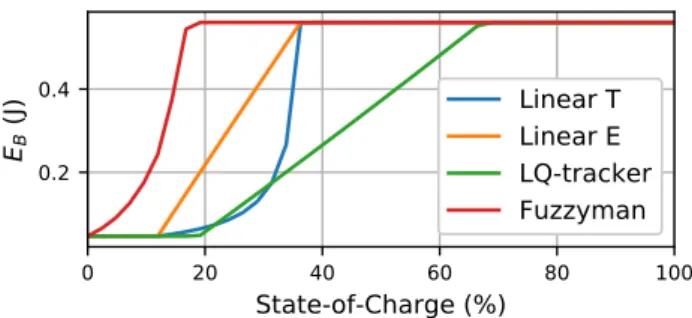
have a similar behavior in limit cases where energy storage is sufficiently charged or empty. As all algorithms are tuned to maximize throughput, they deliver EB = EBmax for an
extended range of input values, as shown in Fig.2, which shows the evolution of EBas a function of the state-of-charge.
This graph gives a quick insight of how the different algo-rithms behave at low and high states of charge. This is useful to choose the EBE algorithm, as it hints to which algorithm is more or less conservative. However, this visualization has its limits when applied to algorithms which use more data inputs than only VBAT T, such as Fuzzyman, since it doesn’t show
the other inputs. Since all algorithms try to maximize EB,
they take less precautions and are more likely to fail if the environment conditions are bad for an extended time period. In the evaluated algorithms, LQ-tracker seems to be the most
conservative, starting to reduce the delivered EB when the
state of charge goes under 70 %. The Linear algorithms and Fuzzyman are more aggressive, delivering maximum EBwhen
the state of charge is respectively over 35 % and 17 %. V. REAL-WORLDEBE MEASUREMENTS
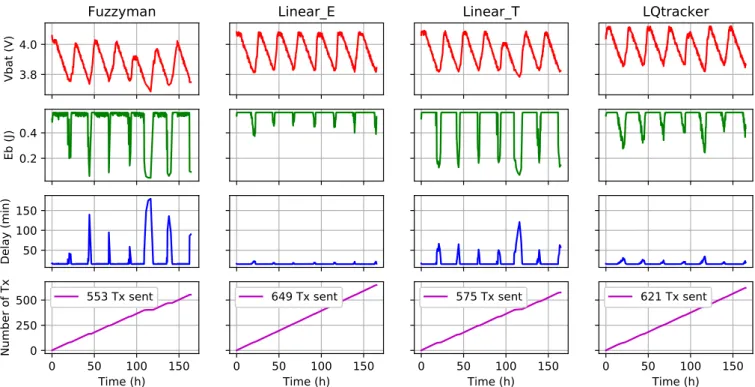
During our experiments, each hardware platform is powered by a solar panel which can provide up to 5 V and 40 mA from direct sunlight. The experiment was run for seven days in an office settings. Each algorithm ran on a different hardware platform. All sensors were located next to a north oriented window, and ran in parallel to reduce differences in ambient energy. After each transmission, the energy budget and delay to the next transmission are calculated and sent through an UART, along with VBAT T and a count of successful
trans-missions. This UART transmission is logged by a computer, parsed and analyzed to produce the graphs shown in Fig.3.
The number of successful transmissions is approximately the same for all algorithms, within a 15 % margin. Only one transmission failed during the fifth night for Fuzzyman. This shows the algorithms are quantitatively equivalent provided they are properly tuned, which confirm the results obtained through simulation. Qualitative differences can however be observed between the different EBE implementations.
As expected, LQ-tracker, by being more conservative, keeps its VBAT T higher than the other algorithm, which makes
it more able to survive long periods without energy. On the contrary, Fuzzyman delivers a competitive number of transmissions but keeps its VBAT T much closer to the failure
threshold, making it more sensible to lack of energy input, as seen with the failed transmission. As Fuzzyman is highly tunable, this could be optimized by a carefully designed rule-set, to provide characteristics closer to LQ-tracker.
Moreover, Fuzzyman and Linear T show a high variance in the delivered EB and delay D, which can be explained
by the quick decrease of EB when VBAT T goes under a
certain threshold, defined by the tuning of the algorithm. This quick EB decrease translates into a much longer delay
D, and decreases the performances of the algorithm, despite the aggressive tuning. On the other hand, Linear E and LQ-tracker reduce EB more progressively, which translates to a
lower mean D and improved performances. This behavior also depends on how D is calculated from EB, and could be varied
using a different energy allocation method.
� �� �� �� �� ��� ������������������� ��� ��� �� ���� ���������������� ���������� ��������
��� ��� �������� �������� �������� �������� ��������� ��� ��� ������ �� ��� ��� ����������� � �� ��� ��� �������� � ��� ��� ������������ ����������� � �� ��� ��� �������� ����������� � �� ��� ��� �������� ����������� � �� ��� ��� �������� �����������
Fig. 3: EBE algorithms comparison over seven days.
Finally, it can be observed that all algorithms show a sharp rise of EB when the energy storage gets replenished. As all
the evaluated algorithms are model-free, they have no means to predict an approximate future energy state of charge. In our use-case, this is typically the case in the morning : the calculated D is long at the end of the night, when the energy storage starts getting replenished. When this long delay D is elapsed, the storage has been charging for a long time, and the EBE can deliver a higher EB. This effect would be
less important with a model-based EBE algorithm, as it would predict that energy was going to be harvested.
VI. CONCLUSION
This paper presents a practical implementation of Energy Budget Estimator algorithms for LoRaWAN IoT nodes and their optimization. We show that the choice of network tech-nology has an impact on EBE algorithms implementation and performance. The use of a simulator shows that in our use-case, there are few differences between the different algo-rithms, provided they are all properly tuned. This enables the use of simpler EBE algorithms, which can then be more easily integrated in mathematical framework to size energy storage and energy sources based on Quality-of-Service requirements. Future work will focus on the development of such a frame-work, and on the allocation of the energy budget, especially for multi-task contexts.
REFERENCES
[1] O. Sentieys, O. Berder, P. Qu´emerais, and M. Cartron, “Wake-Up Inter-val Optimization for Sensor Networks with Rendez-vous Schemes,” in Workshop on Design and Architectures for Signal and Image Processing (DASIP), IEEE, Nov. 2007.
[2] C.-Y. Chen and P. H. Chou, “DuraCap : A supercapacitor-based, power-bootstrapping, maximum power point tracking energy-harvesting system,” in Proc. 16th ACM/IEEE International Symposium on Low Power Electronics and Design (ISLPED), pp. 313–318, ACM Press, Aug. 2010.
[3] A. Kansal, J. Hsu, S. Zahedi, and M. B. Srivastava, “Power management in energy harvesting sensor networks,” ACM Trans. Embed. Comput. Syst., vol. 6, Sep. 2007.
[4] J. R. Piorno, C. Bergonzini, D. Atienza, and T. S. Rosing, “HOL-LOWS : A Power-aware Task Scheduler for Energy Harvesting Sensor Nodes,” Journal of Intelligent Material Systems and Structures, vol. 21, pp. 1317–1335, sep 2010.
[5] T. N. Le, A. Pegatoquet, O. Berder, and O. Sentieys, “Energy-Efficient Power Manager and MAC Protocol for Multi-Hop Wireless Sensor Networks Powered by Periodic Energy Harvesting Sources,” IEEE Sensors Journal, vol. 15, pp. 7208–7220, Aug. 2015.
[6] C. M. Vigorito, D. Ganesan, and A. G. Barto, “Adaptive Control of Duty Cycling in Energy- Harvesting Wireless Sensor Networks,” in IEEE Communications Society Conference on Sensor, Mesh and Ad Hoc Communications and Networks (SECON), pp. 21–30, IEEE, 2007. [7] F. Ait Aoudia, M. Gautier, and O. Berder, “Fuzzy Power Management
for Energy Harvesting Wireless Sensor Nodes,” in IEEE International Conference on Communications (ICC), IEEE, May 2016.
[8] F. Ait Aoudia, M. Gautier, and O. Berder, “Learning to survive : Achie-ving energy neutrality in wireless sensor networks using reinforcement learning,” in 2017 IEEE International Conference on Communications (ICC), pp. 1–6, IEEE, may 2017.
[9] P.-D. Gleonec, J. Ardouin, M. Gautier, and O. Berder, “Architecture exploration of multi-source energy harvester for IoT nodes,” in Online Conference on Green Communications (OnlineGreenComm), pp. 27–32, IEEE, Nov 2016.
[10] R. Margolies, P. Kinget, I. Kymissis, G. Zussman, M. Gorlatova, J. Sarik, G. Stanje, J. Zhu, P. Miller, M. Szczodrak, B. Vigraham, and L. Carloni, “Energy-Harvesting Active Networked Tags (EnHANTs) : Prototyping and Experimentation,” ACM Transactions on Sensor Networks, vol. 11, pp. 1–27, nov 2015.