HAL Id: hal-00361360
https://hal.archives-ouvertes.fr/hal-00361360
Submitted on 13 Feb 2009
HAL is a multi-disciplinary open access
archive for the deposit and dissemination of
sci-entific research documents, whether they are
pub-lished or not. The documents may come from
teaching and research institutions in France or
abroad, or from public or private research centers.
L’archive ouverte pluridisciplinaire HAL, est
destinée au dépôt et à la diffusion de documents
scientifiques de niveau recherche, publiés ou non,
émanant des établissements d’enseignement et de
recherche français ou étrangers, des laboratoires
publics ou privés.
visible channels of Meteosat-8
Sylvain Cros, Michel Albuisson, Lucien Wald
To cite this version:
Sylvain Cros, Michel Albuisson, Lucien Wald.
Simulating Meteosat-7 broadband radiances
us-ing two visible channels of Meteosat-8.
Solar Energy, Elsevier, 2006, 80 (3), pp.361-367.
�10.1016/j.solener.2005.01.012�. �hal-00361360�
SIMULATING METEOSAT-7 BROADBAND RADIANCES USING TWO
VISIBLE CHANNELS OF METEOSAT-8
Sylvain CROS, Michel ALBUISSON, Lucien WALD
Center for Energy and Processes, Ecole des Mines de Paris / Armines, BP 207, 06904 Sophia Antipolis cedex, France.
Corresponding author: Lucien Wald, lucien.wald@ensmp.fr
ABSTRACT
This paper addresses the conversion of narrow-to-broadband radiances in the special case of the sensor SEVIRI onboard the satellite Meteosat-8 of the Meteosat Second Generation (MSG). The advent of this new program poses the problem of the transfer of operational procedures from the previous satellite Meteosat-7 to MSG. Among these operational procedures are several different implementations of the Heliosat method to convert Meteosat data into irradiance maps. An easy-to-implement fast-running method is proposed that combines the radiances of the two narrow visible bands of SEVIRI to produce broadband radiances that are almost identical to those observed in the broadband channel of Meteosat-7. A comparison between Meteosat-7 actual radiances and these simulated-radiances shows errors with a negligible bias and a relative root mean square error (RMSE) of 6%. After combination with the uncertainties found in the calibration procedures (10-13%), the total relative RMSE on the radiances amounts to 12-14%. It is concluded that the Meteosat-8 images may be used in operational procedures currently applied to Meteosat-7 images.
Keywords: satellite, atmosphere optics, radiation, image processing, meteorology, mapping, albedo, Meteosat
1
NOMENCLATURE
• λ wavelength of the radiation, in micron. • I0λ solar spectral constant, in W m-2 micron-1.
• Sλ normalized spectral response for a sensor.
• Imax the maximum irradiance observed in a band defined by two wavelengths [λ1, λ2] and for
• Imet-7the maximum irradiance observed in the Meteosat-7 broadband, in W m-2.
• Ivis1, Ivis2 respectively, the maximum irradiances observed in the SEVIRI channels VIS-1
and VIS-2, in W m-2.
• K1, K2 respectively the digital numbers for the channels VIS-1 and VIS-2 (unitless).
• ai, bi respectively, the gain and offset in the calibration function for the channel i, in
mW m-2 sr-1 cm.
• Im1, Im2 respectively the “equivalent integrated solar irradiances” defined by Eumetsat
in the calibration function for the channels VIS-1 and VIS-2, in mW m-2 sr-1
cm.
• (Lλ)1, (Lλ)2 respectively, the spectral radiances for channels VIS-1 and VIS-2, in mW m-2
sr-1 cm.
• Lvis1, Lvis2 respectively the radiances for the channels VIS-1 and VIS-2, in W m-2 sr-1.
• Lbroad the Meteosat-7 simulated radiance, in W m-2 sr-1.
• α1, α2 and β parameters of the conversion law (unitless).
2
INTRODUCTION
This paper addresses the transfer of operational procedures from the previous series of Meteosat satellites to the series of the Meteosat Second Generation (MSG) ones. The Meteosat satellites are operated by Eumetsat -and before by ESA- since 1978 (Anonymous 1996). They cover Europe, Africa and the Atlantic Ocean. The satellite Meteosat-7 is the last of the first series of sensors and satellites and its operation phase should end in December 2005. These sensors comprise a broadband visible channel (400-1100 nm). The stability of this satellite program led to the development of several scientific applications of known reputation that are processing large amounts of broadband data in real-time procedures. Among them, and of interest to solar energy, is the computation of irradiances at surface level for assessment of radiative budget over the land (Cros et al. 2004; Diekmann et al. 1988; Rimoczi-Paal et al. 1999) or the ocean (Lefèvre et al. 2002) and of biomass (Bonifacio et al. 1993; Rosema 1993).
The advent of the new series of sensors SEVIRI (Spinning Enhanced Visible and InfraRed Imager) onboard the Meteosat Second Generation (MSG) satellites offers the opportunity of benefiting from a greater time sampling - 0.25 h instead of 0.5 h - and a greater space sampling - 1 km instead of 2.5 km (Schmetz et al. 2002). The fist MSG, called Meteosat-8, was launched in 2002 and is in full operation since 29 January 2004. The SEVIRI
sensor comprises a broadband channel (HRV, High Resolution Visible) similar to that of Meteosat-7. However, the image acquired in this channel is covering only two-thirds of the whole field of view because of limitations in downlink bandwidth (Fig. 1). In addition, the geometry is peculiar; the upper part of the image is centred on Europe while the lower part is centred on Africa. Data is missing at the junction of the two parts. Furthermore, the geographical coverage of Africa is subject to change with short notice (see online at Eumetsat Web site www.eumetsat.de). It follows that this channel should not be recommended as an input to these operational procedures if the geographical coverage outside Europe and Mediterranean basin is of interest. One approach to overcome this problem is to develop an algorithm for producing broadband radiances from the SEVIRI sensor of Meteosat-8 that simulate broadband radiances of Meteosat-7 by using the two visible narrow channels (or bands) VIS-1 at 650 nm and the VIS-2 at 800 nm. These simulated radiances may then be used as inputs to the current applications.
•
3
PROBLEM STATEMENT
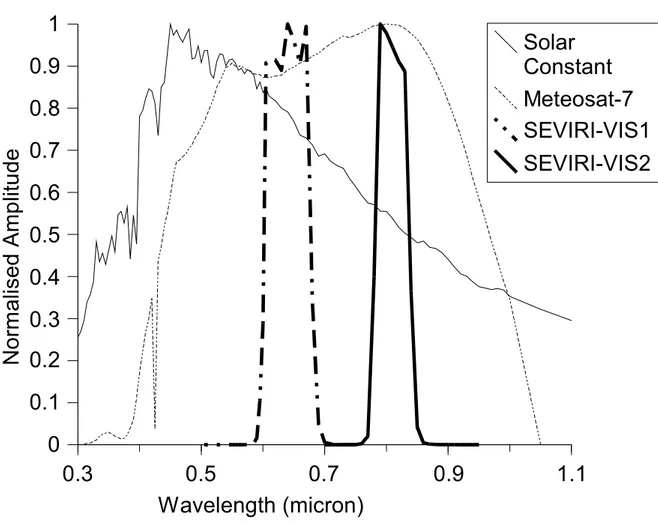
This problem is relevant to the conversion of narrow-to-broadband radiances that has been the subject of many articles in the past. Let the subscript λ denote the wavelength. Figure 2 exhibits the normalized spectral responses, Sλ, for the broadband channel of Meteosat-7 and the two visible bands of SEVIRI, taken from the
Eumetsat Web site (see at www.eumetsat.de). The solar spectral irradiance incident at the top of atmosphere, I0λ,
for 1 astronomical unit is also reported. It is that of Neckel and Labs (1984), read from the software 6S (Vermote et al. 1997).
Previous studies show that the narrow-bands and broadband radiances are well correlated and that a linear combination of VIS-1 and VIS-2 would be suitable to assess the broadband radiances (Russell et al. 1997; Valiente et al. 1995). Russell et al. obtained good results with coefficients of the linear combination that are independent of the scene. However, they and Hucek and Jacobowitz (1995) point out that scene-dependent coefficients provide better results. Xiong et al. (2002) and Valiente et al. (1995) estimate that the use of universal (i.e., scene-independent) coefficients leads to a relative error of 5-10% in the retrieved broadband radiances. Li and Trishenko (1999) list the solar zenithal angle as the most significant parameter influencing the coefficients because the relative contribution from the atmospheric scattering increases as this angle increases. Other parameters are cloud properties, precipitable water and ozone amounts and aerosol properties. The coefficients should also depend on the surface type (Hucek, Jacobowitz 1995; Song and Gao 1999). Liang
(2001) underlines the need for radiative transfer simulations so that many different atmospheric conditions and surface reflectance spectra can be effectively incorporated in the scene-dependent coefficients for an accurate conversion.
Meteosat broadband images are currently used to produce irradiance maps in real time. Consequently, the narrow-to-broadband conversion should be fast enough to process the whole image in approximately 1 min or so. The use of radiative transfer models is time-consuming and we selected the universal coefficients approach as more suitable to this technical case.
4
METHOD
Let note K1, Lvis1, K2 and Lvis2, the digital numbers and radiances for the Meteosat-8 channels. Given the
calibration coefficients ai (gain) and bi (offset) of the band i provided by Eumetsat (in mW m-2 sr-1 cm, Table 1),
the spectral radiances (Lλ)1 and (Lλ)2 are computed (in mW m-2 sr-1 cm):
(Lλ)1 = a1 K1 + b1with (Lλ)1 ≥ 0 (1)
(Lλ)2 = a2 K2 + b2with (Lλ)2 ≥ 0
The maximum irradiance Imax observed in a band defined by [λ1, λ2] and for 1 astronomical unit is given by
λ
λ λ λ λS
d
I
I
=
∫
2 1 0 max (2)The maximum irradiance for Meteosat-7, Imet-7, is equal to 693.17 W m-2 while those for SEVIRI, respectively
noted Ivis1 and Ivis2, are respectively equal to 120.45 and 63.46 W m-2. Im1 and Im2 are quantities given by Eumetsat
and called “equivalent integrated solar irradiance”, expressed in mW m-2 sr-1 cm (Table 1). The spectral radiances are converted into radiances Lvis1 and Lvis2 (in W m-2 sr-1):
Lvis1 = [(Lλ)1 Ivis1] / [π Im1] (3)
Lvis2 = [(Lλ)2 Ivis2] / [π Im2]
In this equation, the terms (Ivis1 / Im1) and (Ivis2 / Im2) evaluate to the effective bandwidth of the channel. Denoting
Lbroad the Meteosat-7 simulated radiance, we assume that
Lbroad = α1 Lvis1 + α2 Lvis2 + β (4)
where α1, α2 and β are unitless parameters and are unknown. We assume that
Lbroad = 0, when Lvis1 = Lvis2 = 0, that implies β = 0 (5)
We also assume that the relative influence of VIS-1 and VIS-2 on Lbroad is guided by the ratio of Ivis1 to Ivis2:
α1 / α2 = Ivis1 / Ivis2 (6)
It comes
α1 = [Imet-7 Ivis1] / [(Ivis1)² + (Ivis2)²] = 4.49459 (7)
α2 = [Imet-7 Ivis2] / [(Ivis1)² + (Ivis2)²] = 2.36764
Twelve days of images Meteosat-8, covering the whole field of view, were acquired between 4 October and 11 November 2003, randomly during the installation phase of our receiver. At that time, the satellite was located at 10.5 W. Images were processed for their geometry by Eumetsat before dissemination to make them look as if they were acquired at nominal location 0° E. This position at 0° E is that occupied by Meteosat-7.
The receiver is a low-cost one, based on the Eumetcast dissemination system. Only eight bits are used to code the signal compared to the original ten bits. K1 and K2 are computed from the readings of the receiver by multiplying
the latter by 4 and adding 2. Then, they were converted into radiances Lvis1 and Lvis2 (W m-2 sr-1) using Eqs (1)-(3).
The radiances are combined using Eqs (4)-(7) to produce a set of Lbroad. Given the low resolution of the receiver,
it follows that the resolution in radiance Lbroad is slightly greater than 1 W m-2 sr-1. For the same days and same
instant, data acquired by Meteosat-7 were available from the archive facilities at Eumetsat. The digital counts were converted into radiances by the means of the calibration service available online at Eumetsat.
We kept only images for which the field of view of the SEVIRI is well illuminated, i.e. between 1100 and 1400 UTC. For each image, we selected approximately 10 areas of various sizes, fairly homogeneous, covering different types of land cover, and offering different viewing and illuminating angles. For the extreme radiances, we selected oceanic areas, outside the sun glint, which are dark and on the opposite, very thick clouds that exhibit high values. These areas vary from image to image, depending upon the illumination and the cloud coverage. For each area, we kept the mean value for the channels VIS-1 and VIS-2 and for Meteosat-7. We thus collected a series of 188 samples. In addition, five images taken at 0800 UTC were analysed in the same way to control the non-influence of the acquisition time on our conclusions.
5
RESULTS
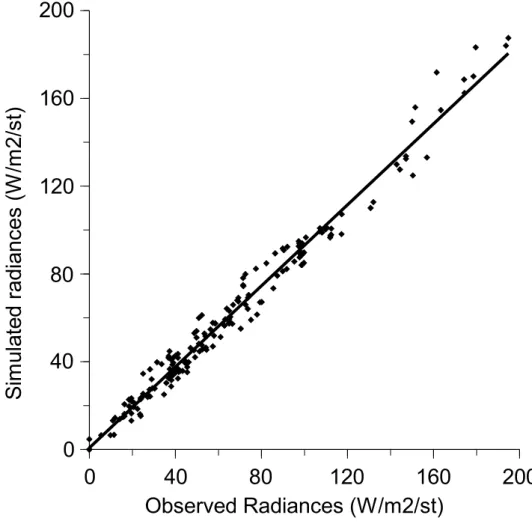
Figure 3 displays the correlogram between the observed radiances and Lbroad for the first series. The agreement is
W m-2 sr-1. The simulated radiances underestimate the observed ones. The root mean square error (RMSE) is 7.9 W m-2 sr-1.
The reasons for this bias are not clear. We believe that several physical processes play a role: their combined effects result in a bias and cannot be separated. We have analysed the possible influence of several physical parameters. Among them is the solar zenithal angle but no trend appears when sorting out the observations by classes of angles. The difference in location of both satellites implies that the areas are observed with systematically different viewing angles. This may partly explain the bias. However, the analysis of the four other series – discussed later - for which the satellites are almost at the same position, shows similar results and we may conclude that this influence is small. The third possible reason, as mentioned in Section 3, is that surface type plays a role. It was not possible to assess this role though no trend was observed when sorting data for land types. It is possible for pixels over land being contaminated by sub-pixel clouds and we cannot be sure to deal with homogeneous land types.
The last explanation that we may provide lies in the uncertainties of the calibration coefficients of these sensors. If the channels VIS-1 and VIS-2 are not well calibrated with respect to each other, this implies a false pre-eminence of a channel over the other and the original assumptions (Eqs. (4)-(6)) are not respected. We have scrutinized very thick clouds, exhibiting reflectances greater than 0.70. The reflectances of such objects are deemed to be spectrally constant though there might be a small contribution to short wavelength of the clear sky layer above the cloud. It appears that in 50% of the cases, the reflectances in the VIS-2 channel are larger than those in VIS-1 by a quantity greater than 0.05. This may indicate a problem in relative calibration of these bands, creating a bias. In addition, the Meteosat-7 reflectances seem to be slightly overestimated; this would partly contradict the assumption about Imet-7 in Eq. (5), resulting into a bias. This finding results from the analysis of the
few cloud free oceanic areas exhibiting broadband reflectances less than 0.05. Such areas exhibit the same reflectances for Meteosat-7 and 1; the analysis shows that the Meteosat-7 reflectances often exceed the VIS-1 ones. These uncertainties in calibration may partly explain the bias.
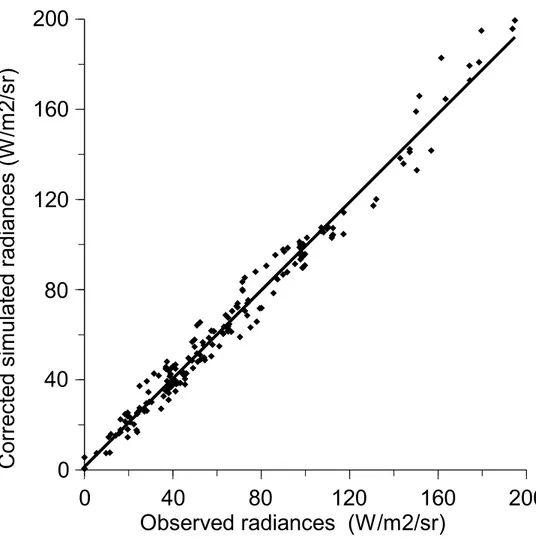
Given the good fit, a correction linear function is computed for the first series by the means of a regression analysis:
Corrected Lbroad = 1.0605 (α1 Lvis1 + α2 Lvis2 ) + 0.5909 (8)
The second parameter of the right hand side of this equation should be equal to zero to satisfy Eq. (5,) where β=0. However, this parameter is approximately half of the resolution of Lbroad (1 W m-2 sr-1) and consequently can
observed and corrected simulated radiances. Now the bias is zero and the RMSE is down to 6.1 W m-2 sr-1, that is 9% of the mean radiance. There is a slight overestimation for the greatest radiances.
To test the proposed model (Eq. 8), we applied it on the four other series of Meteosat-8 data and perform the comparison with Meteosat-7 data using the same approach than for the initial series. The second series is for the period 17-25 December 2003. On 28 January 2004, the re-location of the satellite was completed after a few days and the satellite 8 was at 3.4° W. Meanwhile, the calibration coefficients changed (Table 1). Meteosat-8 was declared operational on 29 January. The three other series are for the last days of January (2Meteosat-8-31), February (26-29) and March 2004 (28-31).
Table 2 reports the correlation coefficient, bias and RMSE and Figure 5 displays the correlogram. In all cases, the differences display no clear trend with the sun zenithal angle or land type. The correlation coefficient is greater than 0.99. The bias is very small; it is always negative, showing an overestimation by the model. The relative RMSE ranges between 5 and 7% of the mean radiance. There is no trend with time. This demonstrates that the proposed model may be applied to other series of SEVIRI images.
6
CONCLUSION
We proposed and tested a means for creating radiances that reproduce those of the Meteosat-7 broadband channel by combining the radiances of the VIS-1 and -2 channels of the SEVIRI sensor aboard the Meteosat-8 satellite. This combination is purely arithmetic and thus can be easily and rapidly implemented and operated in an automatic procedure. It is shown that the relative uncertainty is 6% of the mean value with a small bias of –1%. This is in agreement with the findings of Valiente et al. (1995) and Xiong et al. (2002). It compares favourably to the uncertainties found in the calibration procedures applied to the series Meteosat-5 to -7: 10-13% (Govaerts 1999; Govaerts et al. 2001; Rigollier et al. 2002), especially when taking into account the compression factor of 4 applied to the digital counts by the receiving station. Both errors being correlated, an upper limit to the relative total error is 12-14%. It is concluded that the SEVIRI images, acquired or not by such receiving stations, may be used in operational procedures that are currently applied to the Meteosat-7 images, such as the Heliosat method converting images into irradiance (Rigollier et al. 2004). These simulated radiances offer the same geographical coverage and approximately the same space resolution: 3 km instead of 2.5 km at satellite nadir; the major gain may arise from the increase in time sampling: 0.25 h instead of 0.5 h.
7
ACKNOWLEDGEMENTS
The authors thank Eumetsat for providing the Meteosat-7 data as well as helping us in setting up the receiving station. We owe to David Taylor, United Kingdom, the tools for exploiting the data acquired by this station. This work took place within the project Heliosat-3 “Energy-specific solar radiation data from Meteosat second generation (MSG)” that is supported by the European Commission, Energy Program NNK5-CT-2000-00322, and by Eumetsat, MSG-RAO Programme. Special thanks to the reviewers for their fruitful comments.
8
REFERENCES
Anonymous, 1996. The Meteosat system, Eumetsat publ. #TD05, Eumetsat, Darmstadt, Germany.
Bonifacio, R., Dugdale, G., Milford, J.R., 1993. Sahelian rangeland production in relation to rainfall estimates from Meteosat. Int. J. Remote Sensing, 14, 2695-2711, 1993.
Cros, S., Lefèvre, M. Albuisson, M., Wald, L., 2004. From meteorological satellite data to solar radiation climatological products: the HelioClim database, European Geophysical Union Geophysical Research Abstracts, vol. 6, EGU04-A-03853.
Diekmann, F. J., Happ, S., Rieland, M., Benesch, W., Czeplak, G., Kasten, F., 1988. An operational estimate of global solar radiation irradiance at ground level from Meteosat data: results from 1985 to 1987. Meteorologische Rundschau, 41, 65-79.
Govaerts, Y.M., 1999. Correction of the Meteosat-5 and –6 radiometer solar channel spectral response with the Meteosat-7 sensor spectral characteristics. Int. J. Remote Sensing, 20, 3677-3682.
Govaerts, Y.M., Arriaga, A., Schmetz, J., 2001. Operational vicarious calibration of the MSG/SEVIRI solar channels. Adv. Space Res., 28, 21-30.
Govaerts, Y.M., Clerici, M., 2004. MSG-1/SEVIRI solar channels calibration. Commissioning Activity Report EUM/MSG/TEN/04/0024, Eumetsat, Darmstadt, Germany, 37 p.
Hucek, R., Jacobowitz, H., 1995. Impact of scene dependence on AVHRR albedo models. J. Atmos. Oceanic Technol., 12, 697-711.
Lefèvre, M., Rigollier, C., Cros, S., Albuisson, M., Wald, L., 2002. A shortwave radiation database to support GODAE-related activities, in Proceedings of the International Symposium "En route to GODAE", published by CNES, Toulouse, France, pp. 157-158.
Li, Z.Q., Trishenko, A., 1999. A study toward an improved understanding of the relationship between visible and shortwave measurements. J. Atmos. Oceanic Technol., 16, 347-360, 1999.
Liang, S.L., 2001. Narrowband to broadband conversion of land surface albedo I: algorithms. Remote Sens. Environ., 76, 213-238.
Neckel, H., Labs, D., 1984. The solar radiation between 3300 and 12500 Å. Solar Physics, 90, 205-258.
Rigollier, C., Lefèvre, M., Blanc, Ph., Wald, L., 2002. The operational calibration of images taken in the visible channel of the Meteosat-series of satellites. Journal of Atmospheric and Oceanic Technology, 19, 1285-1293.
Rigollier, C., Lefèvre, M., Wald, L., 2004. The method Heliosat-2 for deriving shortwave solar radiation from satellite images. Solar Energy, 77, 159-169.
Rimoczi-Paal, A., Kerenyi, J., Mika, J., Randriamampianina, R., Dobi, I., Imecs, Z., Szentimrey, T., 1999. Mapping daily and monthly radiation components using Meteosat data. Adv. Space Res., 24, 967-970. Rosema, A, 1993. Using Meteosat for operational evapotranspiration and biomass monitoring in the Sahel
region. Remote Sens. Environ., 46, 27-44.
Russell, M.J., Nunez, M., Chladil, M.A., Valiente, J.A., Lopez-Baeza, E., 1997. Conversion of nadir, narrowband reflectance in red and near-infrared channels to hemispherical surface albedo. Remote Sens. Environ., 61, 16-23.
Schmetz, J., Pili, P., Tjemkes, S. Just, D., Kerkmann, J., Rota, S., Ratier, A., 2002. An introduction to Meteosat Second Generation (MSG). Bull. Amer. Meteorol. Soc., 83, 977-984.
Song, J., Gao, W., 1999. An improved method to derive surface albedo from narrowband AVHRR satellite data: narrowband to broadband conversion. J. Appl. Meteorol., 38, 239-249.
Valiente, J.A., Nunez, M., Lopez-Baeza, M., Moreno, J.F., 1995. Narrow-band to broad-band conversion for Meteosat-visible channel and broad-band albedo using both AVHRR-1 and AVHRR-2 channels. Int. J. Remote Sensing, 16, 1147-1166.
Vermote, E.F., Tanré, D., Deuzé, J.L., Herman, M., Morcrette, J.J., 1997. Second simulation of the satellite signal in the solar spectrum, 6S: An overview. IEEE Trans. Geosci. Remote Sens., 35, 675-686.
Xiong, X.Z., Stamnes, K., Lubin, D., 2002. Surface albedo over the Arctic Ocean derived from AVHRR and its validation with SHEBA data. J. Appl. Meteorol., 41, 413-425.
TABLES AND FIGURES CAPTIONS
Table 1. Meteosat-8 calibration coefficients for the period under concern. Source: Eumetsat.
Table 2. Comparison between the observed and corrected simulated radiances for the four independent series. In W m-2 sr-1. The last column is the average, considering the four series of equal weight. The increase in mean radiances is solely due to the area selection that varies from one image to the other due to cloudiness.
Figure 1. Example of a HRV image, 11 November 2003, 1115 UTC. Spatial resolution is 1 km at satellite nadir. Copyright Eumetsat.
Figure 2. Normalized spectral responses for the broadband of Meteosat-7 and the two visible bands of SEVIRI. Also reported is the amplitude of the solar spectral irradiance at the top of the atmosphere (solar constant) normalized by its maximum at 450 nm.
Figure 3. Simulated vs. observed radiances. The regression line is shown.
Figure 4. Corrected simulated vs. observed radiances. The 1:1 line is shown.
VIS-1 VIS-2
Gain (mW m-2 sr-1 cm) 2003 0.0227 0.0294
2004 0.0230 0.0292
Offset (mW m-2 sr-1 cm) 2003 -1.1586 -1.5011 2004 -1.1705 -1.4900 Equivalent integrated solar
irradiance (mW m-2 sr-1 cm) (Govaerts and Clerici 2004)
65.2296 73.0127
Table 1. Meteosat-8 calibration coefficients for the period under concern. Source: Eumetsat.
Dec 03 Jan-04 Feb-04 Mar-04 Average Mean value 32.1 36.8 37.9 45.1 38.0 Number of samples 106 133 114 68 105 Correlation coefficient 0.99 1.00 0.99 1.00 1.00 Bias (relative value) -0.2 (-1%) -0.4 (-1%) -0.6 (-2%) -0.2 (0%) -0.4 (-1%) RMSE (relative value) 2.2 (7%) 2.2 (6%) 2.7 (7%) 2.2 (5%) 2.3 (6%)
Table 2. Comparison between the observed and corrected simulated radiances for the four independent series. In W m-2 sr-1. The last column is the average, considering the four series of equal weight. The increase in mean
Figure 1. Example of a HRV image, 11 November 2003, 1115 UTC. Spatial resolution is 1 km at satellite nadir. Copyright Eumetsat.
0.3
0.5
0.7
0.9
1.1
0
0.1
0.2
0.3
0.4
0.5
0.6
0.7
0.8
0.9
1
Solar
Constant
Meteosat-7
SEVIRI-VIS1
SEVIRI-VIS2
Wavelength (micron)
N
o
rm
a
lis
e
d
A
m
p
lit
u
d
e
Figure 2. Normalized spectral responses for the broadband of Meteosat-7 and the two visible bands of SEVIRI. Also reported is the amplitude of the solar spectral irradiance at the top of the atmosphere (solar constant) normalized by its maximum at 450 nm.