Barret, M. (2016), Terroir is a key driver of seed-associated microbial assemblages. Environ
Microbiol, 18: 1792–1804.
which has been published in final form at
doi: 10.1111/1462-2920.12977
.
This article may be used for non-commercial purposes in accordance with Wiley Terms and
Conditions for Self-Archiving."
Terroir is a key driver of seed-associated
microbial assemblages
StephanieKlaedtke,1Marie-AgnèsJacques,2 LorenzoRaggi3AnnePréveaux,2SophieBonneau,2 ValeriaNegri,3VéroniqueChable1and
MatthieuBarret2*
1••, INRA SAD, 65 Rue de St. Brieuc, CS 84215, 35042, Rennes, France.
2UMR1345 Institut de Recherches en Horticulture et Semences, INRA, SFR4207 QUASAV, F-49071, Beaucouzé, France.
3Dipartimento di Scienze Agrarie, Alimentari e
Ambientali, Università degli Studi di Perugia, Borgo XX Giugno 74, 06121 Perugia, Italy.
Summary
Seeds have evolved in association with diverse microbial assemblages that may influence plant growth and health. However, little is known about the composition of seed-associated microbial assem-blages and the ecological processes shaping their structures. In this work, we monitored the relative influence of the host genotypes and terroir on the structure of the seed microbiota through metabarcoding analysis of different microbial assem-blages associated to five different bean cultivars har-vested in two distinct farms. Overall, few bacterial and fungal operational taxonomic units (OTUs) were con-served across all seed samples. The lack of shared OTUs between samples is explained by a significant effect of the farm site on the structure of microbial assemblage, which explained 12.2% and 39.7% of variance in bacterial and fungal diversity across samples. This site-specific effect is reflected by the significant enrichment of 70 OTUs in Brittany and 88 OTUs in Luxembourg that lead to differences in co-occurrence patterns. In contrast, variance in microbial assemblage structure was not explained by host genotype. Altogether, these results suggest that seed-associated microbial assemblage is determined by niche-based processes and that the terroir is a key driver of these selective forces.
Introduction
Plants have evolved in association with diverse microbial assemblages, also known as microbiota, which can affect key plant traits such as metabolite production (Badri et al., 2013), disease resistance (Mendes et al., 2011), flowering time (Panke-Buisse et al., 2015) and biomass accumula-tion (Sugiyama et al., 2013). Owing to such important effects on plant growth and plant health, a substantial amount of work has investigated the processes involved in the assembly of the phyllosphere and the rhizophere microbiota (Bulgarelli et al., 2012; Lundberg et al., 2012; Horton et al., 2014; Maignien et al., 2014). In contrast, other plant habitats such as the anthosphere (Shade
et al., 2013), the carposphere (Telias et al., 2011) and the
spermosphere (Ofek et al., 2011) have been often over-looked. However, these plant habitats may act as reser-voirs for the plant microbiota because they are associated to the reproductive stage of plants and are therefore involved in the vertical transmission of microorganisms from one plant generation to another (Aleklett and Hart, 2013).
Although transmission of microorganisms from plant to seed is the primary source of inoculum for the plant (Baker and Smith, 1966; Nelson, 2004; Darrasse et al., 2010), relatively little is known about the structure of seed-associated microbial assemblages and the regulators of assemblage structure. Culture-independent surveys have revealed that seed-associated microbial assemblages are composed of 50–1000 bacterial and fungal operational taxonomic units (OTUs) (Lopez-Velasco et al., 2013; Links et al., 2014; Barret et al., 2015). These differences in seed microbiota richness could be attributed to deter-ministic processes such as host genetic variations. For instance, it has been shown that some plant genotypes select certain endophytic bacterial taxa from one plant generation to another (Johnston-Monje and Raizada, 2011; Hardoim et al., 2012). Moreover, a fraction of the seed microbiota is conserved among different plant line-ages (Links et al., 2014). However, the structure of the seed microbiota seems also driven by other deterministic processes such as field management practices, harvest-ing methods, seed processharvest-ing and storage (van Overbeek
et al., 2011; Aleklett and Hart, 2013). Indeed, we have
recently observed that variability of seed-associated
*For correspondence. E-mail [email protected]; Tel. ••; Fax ••. Received 10 April, 2015; accepted 1 July, 2015.
© 2015 Society for Applied Microbiology and John Wiley & Sons Ltd
1bs_bs_query 2bs_bs_query 1 bs_bs_query 2 bs_bs_query 3 bs_bs_query 4 bs_bs_query
bacterial and fungal assemblages could be explained, in part, by the geographic location of the production area (Barret et al., 2015).
Understanding the processes involved in the assembly of the seed microbiota may result in practical applications for seed quality and agriculture. For example, some seed-associated microbial assemblages may release seed dor-mancy through production of cytokinins (Goggin et al., 2015) and therefore ensure a homogenous field germina-tion. In addition, activity of the seed microbiota may also limit the installation of exogenous microorganisms (Bacilio-Jimenez et al., 2001) and consequently decrease the activity of plant growth-promoting inoculants. Finally, transmission of phytopathogenic microorganisms by seed is an important mean of pathogen dispersion and there-fore has been recognized as significant in the emergence of diseases in new planting areas (Baker and Smith, 1966). Altogether, these observations clearly highlight a need to improve our knowledge on processes shaping the structure of the seed microbiota.
To date, local adaptation in annual crops has been mainly studied at the genetic level (Tiranti and Negri, 2007; Pyhajarvi et al., 2013; Savolainen et al., 2013; Raggi et al., 2014). However, microbial assemblage may be one of the determining factors influencing local adap-tation in plants (Bulgarelli et al., 2013). For instance, recent works have shown that soil-associated microbial assemblage is a key feature in regional variation among wine grapes (Bokulich et al., 2014; Zarraonaindia et al., 2015), therefore suggesting that soil microbiota is an important component of the terroir. According to one defi-nition, terroir is a geographic space delimited according to a human community sharing distinctive cultural traits, know-how and practices developed over its common history based on a system of interactions between the natural environment and human factors (Prevost and Lallemand, 2010). Functioning of the terroir relies on the interactions between abiotic and biotic factors such as climate, soil and plants. While the effect of terroir on perennial species and the products derived from them is commonly recognized, its influence on the production of annual species and staple foods under field conditions has only recently become an object of research (Lhomme
et al., 2015).
The role of the seed microbiota in the local adaptation of plants was recently questioned in the framework of a participatory research project on farm seeds (Farm Seed Opportunities), leading to the work presented here. The purpose of this work was to assess the relative influence of host genotypes and terroir on the structure of the seed microbiota. In this context, we used common bean (Phaseolus vulgaris L.) as a model species because common bean is a crop of worldwide importance as food crop. Many traditional cultivars exist in the Old and
New Worlds and the farmers engaged in the research project produce such traditional cultivars. Moreover, common bean is concerned by several seed-borne fungal, bacterial and viral pathogens that can hinder plant health and development. Effects of seed microbiota on plant health and adaptation are thus of particular interest for this crop.
The relative influence of the host genotypes and terroir on the structure of the bean seed microbiota was assessed through metabarcoding analysis of five differ-ent bean cultivars harvested in two distinct farms. Because these two farms have their own practices (from crop management to postharvest handling) and are located in two contrasted climatic areas, they represent different terroirs. On the one hand, we found that the terroir is a key driver of the structure of seed-associated microbial assemblage and impact mainly fungal diversity. On the other hand, we found that plant cultivar is not significantly shaping the assembly of the seed microbiota of common bean.
Results
The main objective of this work was to assess the relative influence of the host genotypes and terroir on the assem-bly of the seed microbiota. The effect of these two deter-ministic processes on the structure of seed-associated microbial assemblages was studied on bean seed samples. These seed samples were obtained by multiply-ing five seed lots of different bean cultivars [namely ‘Calima’ (Cal), ‘Flageolet Chevrier’ (FlC), ‘Rognon de Coq’ (RdC), ‘Roi des Belges’ (RdB) and ‘Saint Esprit à Oeil Rouge’ (SES)] for two consecutive years in two farms located in Brittany (BZH) and Luxembourg (LUX) (Table S1).
Genetic diversity within and among cultivars
The genetic diversity of the five bean cultivars used in this study was firstly assessed through 11 simple sequence repeat (SSR) markers covering all the species linkage groups (Table S2). According to SSR data analy-ses, the number of analysed individuals was suitable to represent the cultivars level of genetic diversity. Indeed, mean SSR allelic accumulation curves were close to reaching the asymptote for all five cultivars (Fig. S1). A total of 38 alleles were obtained from the amplification of the 11 SSR loci selected. The majority of the loci was polymorphic because alleles with frequencies > 95% were only observed at loci AG01 and BM137. Private alleles were found in all cultivars, one in RdB (fre-quency= 0.03), four in SES (mean frequency ± standard error= 0.76 ± 0.218), three in FlC (0.64 ± 0.294), five in RdC (0.28± 0.068) and two in Cal (0.53 ± 0.469).
1bs_bs_query 2bs_bs_query 3bs_bs_query 4bs_bs_query 5bs_bs_query 6bs_bs_query 7bs_bs_query 8bs_bs_query 9bs_bs_query 10bs_bs_query 11bs_bs_query 12bs_bs_query 13bs_bs_query 14bs_bs_query 15bs_bs_query 16bs_bs_query 17bs_bs_query 18bs_bs_query 19bs_bs_query 20bs_bs_query 21bs_bs_query 22bs_bs_query 23bs_bs_query 24bs_bs_query 25bs_bs_query 26bs_bs_query 27bs_bs_query 28bs_bs_query 29bs_bs_query 30bs_bs_query 31bs_bs_query 32bs_bs_query 33bs_bs_query 34bs_bs_query 35bs_bs_query 36bs_bs_query 37bs_bs_query 38bs_bs_query 39bs_bs_query 40bs_bs_query 41bs_bs_query 42bs_bs_query 43bs_bs_query 44bs_bs_query 45bs_bs_query 46bs_bs_query 47bs_bs_query 48bs_bs_query 49bs_bs_query 50bs_bs_query 51bs_bs_query 52bs_bs_query 53bs_bs_query 54bs_bs_query 55bs_bs_query 56bs_bs_query 57bs_bs_query 58bs_bs_query 59bs_bs_query 60bs_bs_query 61bs_bs_query 62bs_bs_query 63bs_bs_query 64bs_bs_query 65bs_bs_query 66bs_bs_query 67bs_bs_query 68bs_bs_query 69bs_bs_query 70bs_bs_query 71bs_bs_query 72bs_bs_query 73bs_bs_query 74bs_bs_query 75bs_bs_query 76bs_bs_query 77bs_bs_query 78bs_bs_query 79bs_bs_query 80bs_bs_query 81bs_bs_query 82bs_bs_query 83bs_bs_query 84bs_bs_query 85bs_bs_query 86bs_bs_query 87bs_bs_query 88bs_bs_query 89bs_bs_query 90bs_bs_query 91bs_bs_query 92bs_bs_query 93bs_bs_query 94bs_bs_query 95bs_bs_query 96bs_bs_query 97bs_bs_query 98bs_bs_query 99bs_bs_query 100bs_bs_query 101bs_bs_query 102bs_bs_query 103bs_bs_query 104bs_bs_query 105bs_bs_query 106bs_bs_query 5 bs_bs_query
Significant differences in effective number of alleles (Ne) and expected heterozygosity (He) were detected between RdC and both RdB and SES (Mann–Whitney test, P≤ 0.05), RdC being characterized by highest values (Table S3). This implies that a high level of genetic diversity was present within RdC, whereas RdB and SES had rather low levels of within cultivar diversity. The calculated genetic distance (GD) matrix indicated that the cultivars are composed of a different number of multilocus genotypes, i.e. 16 genotypes in RdC (88.9% of total examined individuals), eight in FlC (44.4%), seven in Cal (43.7%) and five in both SES and RdB (27.8%). At individual level, the genetic relationship between cultivars was investigated by principal coordinates analysis (PCoA). The first two major axes explained 70.7% of the total variation (Fig. S2A) and this percentage reached 86.3% when the third axe was considered (Fig. S2B). The first two principal coordinates clearly separated Cal and SES from the all the other varieties, whereas the third was necessary to better separate FlC from RdB and RdC (Fig. S2).
Analysis of molecular variance (AMOVA) results indi-cated that both among and within cultivar genetic diversity is significant (Table S4) with the largest proportion due to the diversity among cultivars (77.6% versus 22.4%). These results were confirmed by the values of average numbers of pairwise differences between cultivars (PiXY), which were all statistically significant. Highest pair-wise differences were detected among SES and FlC (PiXY= 8.51, P ≤ 0.001) and between RdB and SES (PiXY= 7.62, P ≤ 0.001) (Table S5 and Fig. S3). In addi-tion, different cultivars were characterized by a different level of within cultivar diversity as shown by PiX analysis results. PiX ranged from 0.62 (SES) to 3.43 (RdC). To a certain extent, it was similar for cultivars RdB, SES, Cal and FlC, whereas RdC showed a higher value (Table S5 and Fig. S3). According to reported results, the selected cultivars displayed a large level of both among and within genetic diversity, RdC being the most diverse.
Effect of sampling on seed microbiota profiling
The structure of the microbial assemblages associated to 27 seed samples was assessed by sequencing (i) the V4 region of 16S rRNA gene (Caporaso et al., 2011) and (ii) the ITS1 region of the fungal ITS (Schoch et al., 2012). Overall, 3 281 571 and 5 553 827 pairs of reads were obtained for 16S rRNA gene and ITS1 sequences respec-tively (Table S6). Raw reads were first assembled in quality sequences and then grouped into OTUs at≥ 97% sequence identity (see Experimental procedures section). Only abundant OTUs representing at least 0.1% of the library size were conserved for subsequent analyses (Barret et al., 2015). Using this relative abundance
thresh-old, 195 and 157 OTUs were obtained with 16S rRNA gene and ITS1 sequences respectively. These abundant OTUs represented 95.6% of all 16S rRNA reads and 96.6% of all ITS1 reads.
To investigate the magnitude of variability between seed samples of the same bean cultivar harvested on the same site, we monitored the proportion of bacterial and fungal OTU shared between field replicates. Despite a relatively high sequencing depth (> 38 000 sequences per sample, Table S6), the number of bacterial OTUs shared between field replicates was low ranging from 0.9% to 27.9% of all bacterial OTUs (Table S7). Because the bac-terial assemblages associated to some seed samples were composed of only one to three abundant OTUs, the heterogeneity observed between seed samples is likely due to the presence of dominant taxa within the assem-blage that masked the detection of other bacterial taxa. In comparison, composition of seed-associated fungal assemblage was more homogenous with 27.6–55.9% of OTUs conserved across all field replicates (Table S7). As the replicates were not obtained by resampling one seed lot, but consisted of field replicates obtained from a field trial sown in complete replicated blocks, this heterogene-ity may be explained in part by variations within the trial field.
Next, we explored OTUs that were conserved across bean cultivars and experimental sites. A total of 22 and 16 fungal OTUs systematically associated to every seed lot were observed in BZH and LUX respectively (Fig. S4 and Table S8). Moreover, each bean cultivar was composed of 11–20 ubiquitous fungal OTUs depending on the plant genotype (Fig. S4 and Table S8). Overall, seven fungal OTUs were conserved between all the sites and cultivars suggesting that these OTUs represent the core mem-bers of fungal assemblages associated to common bean seeds. These seven OTUs corresponded to five Ascomycota and two Basidiomycota. As stated earlier, data obtained with the 16S rRNA gene sequence were more variable. Consequently, one to three OTUs were associated with different bean cultivars and only one OTU affiliated to Pseudomonas genus was conserved between all the experimental sites and cultivars (Fig. S4 and Table S8).
The experimental site influences the structure of microbial assemblages
The influence of experimental site and bean cultivar on bacterial and fungal richness was initially assessed by comparing the number of OTUs between treatments. According to Kruskal–Wallis test, no significant difference in bacterial richness was observed between experimental sites (P= 0.11; Fig. 1) nor between bean cultivars (P= 0.34, Fig. S5). Moreover, α-diversity of bacterial
© 2015 Society for Applied Microbiology and John Wiley & Sons Ltd, Environmental Microbiology
1bs_bs_query 2bs_bs_query 3bs_bs_query 4bs_bs_query 5bs_bs_query 6bs_bs_query 7bs_bs_query 8bs_bs_query 9bs_bs_query 10bs_bs_query 11bs_bs_query 12bs_bs_query 13bs_bs_query 14bs_bs_query 15bs_bs_query 16bs_bs_query 17bs_bs_query 18bs_bs_query 19bs_bs_query 20bs_bs_query 21bs_bs_query 22bs_bs_query 23bs_bs_query 24bs_bs_query 25bs_bs_query 26bs_bs_query 27bs_bs_query 28bs_bs_query 29bs_bs_query 30bs_bs_query 31bs_bs_query 32bs_bs_query 33bs_bs_query 34bs_bs_query 35bs_bs_query 36bs_bs_query 37bs_bs_query 38bs_bs_query 39bs_bs_query 40bs_bs_query 41bs_bs_query 42bs_bs_query 43bs_bs_query 44bs_bs_query 45bs_bs_query 46bs_bs_query 47bs_bs_query 48bs_bs_query 49bs_bs_query 50bs_bs_query 51bs_bs_query 52bs_bs_query 53bs_bs_query 54bs_bs_query 55bs_bs_query 56bs_bs_query 57bs_bs_query 58bs_bs_query 59bs_bs_query 60bs_bs_query 61bs_bs_query 62bs_bs_query 63bs_bs_query 64bs_bs_query 65bs_bs_query 66bs_bs_query 67bs_bs_query 68bs_bs_query 69bs_bs_query 70bs_bs_query 71bs_bs_query 72bs_bs_query 73bs_bs_query 74bs_bs_query 75bs_bs_query 76bs_bs_query 77bs_bs_query 78bs_bs_query 79bs_bs_query 80bs_bs_query 81bs_bs_query 82bs_bs_query 83bs_bs_query 84bs_bs_query 85bs_bs_query 86bs_bs_query 87bs_bs_query 88bs_bs_query 89bs_bs_query 90bs_bs_query 91bs_bs_query 92bs_bs_query 93bs_bs_query 94bs_bs_query 95bs_bs_query 96bs_bs_query 97bs_bs_query 98bs_bs_query 99bs_bs_query 100bs_bs_query 101bs_bs_query 102bs_bs_query 103bs_bs_query 104bs_bs_query 105bs_bs_query 106bs_bs_query 6 bs_bs_query 7 bs_bs_query
assemblage (assessed by Simpson’s inverse index) was also unaffected by experimental site and bean cultivars (P= 0.25 and P = 0.29 respectively). On the contrary fungal richness andα-diversity of fungal assemblage sig-nificantly decreased in LUX site in comparison to BZH (P< 0.001 and P = 0.01, Fig. 1), whereas no differences were observed between bean cultivars (P= 0.61 and
P= 0.78, Fig. S5).
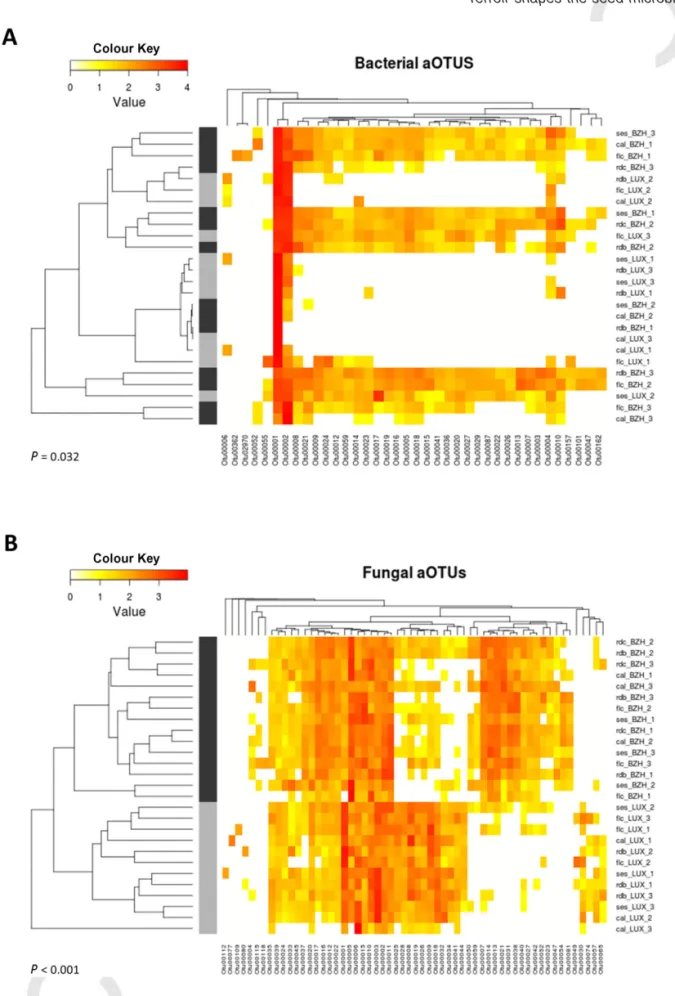
Because fungal richness and α-diversity of seed-associated fungal assemblages were affected by the experimental sites, diversity between samples (also known asβ-diversity) was estimated with Bray–Curtis dis-similarity (Bray and Curtis, 1957). Hierarchical clustering of Bray–Curtis dissimilarity index and subsequent AMOVA revealed a significant effect of the experimental site on the structure of bacterial (P= 0.032; Fig. 2A) and fungal assemblages (P< 0.001, Fig. 2B). In contrast, the bean cultivar was neither significantly shaping the composition of bacterial assemblage (P= 0.64) nor the composition of fungal assemblage (P= 0.81). The relative contribution of terroir and bean cultivar on microbial β-diversity was further inspected by a canonical analysis of principal coor-dinates (CAP) on Bray–Curtis dissimilarity matrix. On the one hand, CAP analyses revealed that the majority of the variation in fungal diversity across seed samples is explained by the terroir (39.7% of the variation,
P< 0.001), whereas 12.2% of variation in bacterial
β-diversity is explained by this factor (P = 0.037). On the other hand, bean varieties did not explain variation in fungal (P= 0.80) and bacterial (P = 0.78) β-diversity. In conclusion, the terroir was the main factor driving fungal and bacterial assemblage structure.
Taxonomic composition of the bean seed microbiota
Because the structure of seed microbiota was mainly shaped by the location of the production region, we exam-ined the variation in seed microbiota composition between seeds harvested from both experimental sites. According to 16S rRNA gene sequences, bacterial OTUs were mostly affiliated to Gammaproteobacteria with a relative abundance of 91% and 79% for the BZH and LUX sites respectively. Pseudomonas was by far the most repre-sented bacterial genus with 48% and 77% of all reads for BZH and LUX respectively. Regarding fungal community composition, the seed microbiota of LUX was mainly com-posed of Ascomycota (83%), whereas ratio between Ascomycota (59%) and Basidomycota (37%) was more balanced in BZH. At the genus level, Cryptococcus and
Fusarium were well represented in BZH, whereas Alternaria, Eurotium and Fusarium were frequently
asso-ciated to LUX (Fig. S6).
Next, we investigated changes in relative abundance of OTUs between experimental sites and cultivars. Bacterial and fungal OTUs were defined as significantly enriched or depleted in one treatment at a corrected P-value< 0.001 and a log2 fold change magnitude ≥ 2. Using these
criteria, we only detected significant changes in relative abundance of bacterial and fungal OTUs between experi-mental sites (Table S9 and Table S10). More precisely, 24 bacterial OTUs, mostly affiliated to Bacilli, were enriched in BZH in comparison to LUX (Table S9). On the con-trary, 34 OTUs were enriched in LUX. Seven of these OTUs were affiliated to Enterobacteriaceae. Interestingly, members of the bacterial phyla Acidobacteria and
Fig. 1. Estimation of bacterial and fungal diversity. Richness (OTUs) and diversity (Simpson’s inverse index) were estimated in seed samples harvested in Brittany and Luxembourg. Seed samples of each bean cultivar are represented by different colours lines, whereas the grey area represents the estimation of the distribution. Kruskal–Wallis one-way analysis of variance was performed to assess the effect of the production region on richness andα-diversity.
1bs_bs_query 2bs_bs_query 3bs_bs_query 4bs_bs_query 5bs_bs_query 6bs_bs_query 7bs_bs_query 8bs_bs_query 9bs_bs_query 10bs_bs_query 11bs_bs_query 12bs_bs_query 13bs_bs_query 14bs_bs_query 15bs_bs_query 16bs_bs_query 17bs_bs_query 18bs_bs_query 19bs_bs_query 20bs_bs_query 21bs_bs_query 22bs_bs_query 23bs_bs_query 24bs_bs_query 25bs_bs_query 26bs_bs_query 27bs_bs_query 28bs_bs_query 29bs_bs_query 30bs_bs_query 31bs_bs_query 32bs_bs_query 33bs_bs_query 34bs_bs_query 35bs_bs_query 36bs_bs_query 37bs_bs_query 38bs_bs_query 39bs_bs_query 40bs_bs_query 41bs_bs_query 42bs_bs_query 43bs_bs_query 44bs_bs_query 45bs_bs_query 46bs_bs_query 47bs_bs_query 48bs_bs_query 49bs_bs_query 50bs_bs_query 51bs_bs_query 52bs_bs_query 53bs_bs_query 54bs_bs_query 55bs_bs_query 56bs_bs_query 57bs_bs_query 58bs_bs_query 59bs_bs_query 60bs_bs_query 61bs_bs_query 62bs_bs_query 63bs_bs_query 64bs_bs_query 65bs_bs_query 66bs_bs_query 67bs_bs_query 68bs_bs_query 69bs_bs_query 70bs_bs_query 71bs_bs_query 72bs_bs_query 73bs_bs_query 74bs_bs_query 75bs_bs_query 76bs_bs_query Colour
Fig. 2. Seed-associated microbial assemblages clustered primarily by experimental site. Heatmaps of bacterial (A) and fungal OTUs (B). Clustering of seed samples was performed by calculation of Bray–Curtis dissimilarity matrix. Although Bray–Curtis dissimilarity matrix was calculated on every bacterial and fungal OTU, only OTUs with a relative abundance> 1% are shown in these figures. OTUs were also clustered by co-occurrence pattern. The effect of the experimental site on the structure of microbial assemblage was assessed by analysis of molecular variance (AMOVA). Light grey and dark grey colours indicate seed samples harvested from Brittany and Luxembourg respectively. © 2015 Society for Applied Microbiology and John Wiley & Sons Ltd, Environmental Microbiology
1bs_bs_query 2bs_bs_query 3bs_bs_query 4bs_bs_query 5bs_bs_query Colour
Verrucomicrobia were also found enriched in seed samples harvested from BZH (Table S9). Numerous vari-ations in relative abundance of fungal OTUs were also observed between the two experimental sites, confirming changes of fungal diversity observed previously. A total of 54 and 46 fungal OTUs were significantly enriched in LUX and BZH respectively (Table S10). Among these OTUs, the genera Rhizoctonia and Fusarium were mainly asso-ciated to LUX, while Cryptococcus and a group of unclas-sified OTUs were enriched in BZH (Table S10).
Interactions between microbial taxa associated to seed samples
Differences of microbial assemblage composition between seeds harvested from BZH and LUX are prob-ably linked to changes of microbial community structure. In order to predict microbial interactions within seed-associated assemblages, we explored positive and nega-tive associations between entities of these assemblages
by generating environment-specific correlations networks with Sparse Correlations for Compositional data algorithm (SparCC; Friedman and Alm, 2012). Considering only inferred correlations with pseudo P-values ≤ 0.001, we identified 260 and 132 associations between 85 and 48 bacterial OTUs associated to seeds harvested in BZH and LUX respectively (Fig. 3A and B and Table S11). The lower number of nodes in the network inferred with seed-associated bacterial assemblages from LUX could be explained by the high prevalence of OTU0001 (affiliated to Pseudomonas) in this site. Indeed the increase in rela-tive abundance of this OTU ultimately results in decrease of relative abundance of others OTUs, and consequently caused difference in co-occurrence patterns.
Overall, both bacterial correlation networks were frag-mented into one major module and some minor clusters consisting of two to three OTUs (Fig. 3A and B). Nodal degree (number of association between nodes) was rather low for each correlation network with a median number of two inferred correlations between bacterial
Fig. 3. Bacterial and fungal communities observed among microbial assemblages. Environment-specific correlation networks were inferred with bacterial (A and B) and fungal (C and D) OTUs associated to seeds harvested in Brittany (A and C) or in Luxembourg (B and D). Correlations between OTUs were inferred with the Sparse Correlations for Compositional data algorithm (SparCC) implemented inMOTHUR. The effect of uneven sampling was corrected by dividing sequence counts by total library size. Nodes correspond to OTUs, and connecting edges indicate inferred correlations between them. Node colour represents the different bacterial and fungal taxa. Only positive (orange) and negative (blue) correlations with pseudo P-value≤ 0.001 were represented in the network using the R packageQGRAPH.
1bs_bs_query 2bs_bs_query 3bs_bs_query 4bs_bs_query 5bs_bs_query 6bs_bs_query 7bs_bs_query 8bs_bs_query 9bs_bs_query 10bs_bs_query 11bs_bs_query 12bs_bs_query 13bs_bs_query 14bs_bs_query 15bs_bs_query 16bs_bs_query 17bs_bs_query 18bs_bs_query 19bs_bs_query 20bs_bs_query 21bs_bs_query 22bs_bs_query 23bs_bs_query 24bs_bs_query 25bs_bs_query 26bs_bs_query 27bs_bs_query 28bs_bs_query 29bs_bs_query 30bs_bs_query 31bs_bs_query 32bs_bs_query 33bs_bs_query 34bs_bs_query 35bs_bs_query 36bs_bs_query 37bs_bs_query 38bs_bs_query 39bs_bs_query 40bs_bs_query 41bs_bs_query 42bs_bs_query 43bs_bs_query 44bs_bs_query 45bs_bs_query 46bs_bs_query Colour
OTUs (Table S11). The highest degree nodes of BZH bacterial network (a.k.a hubs) were related to taxonomi-cally diverse OTUs including Alphaproteobacteria, Betaproteobacteria, Actinobacteria and Bacteroidetes
(Fig. 3A), whereas hubs of LUX bacterial correlation network were mostly affiliated to Gammaproteobacteria (Fig. 3B). According to edgeR analysis, these latter enti-ties are part of OTUs significantly enriched in the LUX site, whereas the relative abundance of BZH hubs was not significantly different between sites.
In comparison with bacterial networks, correlations net-works inferred from seed-associated fungal assemblages harvested in BZH (Fig. 3C) and LUX (Fig. 3D) were com-posed of less edges and nodes (Table S11), suggesting fewer interactions between entities of these assemblages. The topology of BZH fungal networks was clearly different from the topology of other fungal and bacterial networks with multiple modules composed of two to eight OTUs (Fig. 3C). The highest degree nodes of each environment-specific correlations network were related to fungal OTUs significantly enriched in BZH (Eurotiomycetes and Tremellomycetes) or LUX (Sordariomycetes). However, the number of connections that these hubs shared with other nodes was quite low in comparison with bacterial networks with a maximal degree of 5 and 4 for BZH and LUX respectively.
Discussion
Seeds have evolved in association with diverse microbial assemblages that may influence plant growth and health (Nelson, 2004; Darrasse et al., 2010; Goggin et al., 2015). To date, studies concerning the composition of these seed-associated microbial assemblages are scarce in comparison with other plant habitats such as the phyllosphere and the rhizosphere (Vorholt, 2012; Philippot et al., 2013). Results obtained in this work indi-cate that terroir is a key driver involved in the assembly of the seed microbiota. The variable farm sites were taken as a proxy of the terroir, which is a combination of human practices and environmental conditions (Prevost and Lallemand, 2010). Indeed the two farm sites targeted in our study explained 12% and almost 40% of the variation in bacterial and fungal β-diversity respectively. Interest-ingly, a significant regional pattern has also been observed in the grape microbiota, especially for grape-associated fungal assemblages (Bokulich et al., 2014), suggesting an important effect of terroir on habitats asso-ciated to the reproductive stages of the plant. Because terroir is the result of the interactions between a human community and the environment (Prevost and Lallemand, 2010), it is somewhat difficult to assess the relative contribution of each factor in the composition of seed-associated microbial assemblages. Nevertheless,
accord-ing to our results it seems that the plant genotype does not significantly explain variation of microbial diversity across seed samples. This finding is in agreement with a previous study performed on multiple seed-associated assemblages of various plant species (Barret et al., 2015). However, some entities of seed-associated assemblages can be conserved across different plant lin-eages (Links et al., 2014) and from one plant generation to another (Johnston-Monje and Raizada, 2011; Hardoim
et al., 2012).
An important fraction of variability in seed microbiota composition is explained neither by environmental struc-turing factors nor by host genotype. This is especially true for seed-associated bacterial assemblages where only 12.2% of variation in bacterial β-diversity is explained by the farm site. Although seeds of various origins shared a common microbiota at higher taxonomic rank, seed-associated bacterial assemblages are extremely different at the OTU level (Lopez-Velasco
et al., 2013; Links et al., 2014; Barret et al., 2015).
Indeed, only one abundant bacterial OTU affiliated to
Pseudomonas is conserved across all seed samples.
This high variability between seed lots is probably not due to insufficient sequencing effort because each seed sample contained a minimum of 38 000 high quality sequences. The lack of apparent shared OTUs between seed samples could be explained by within-individual heterogeneity of seed traits such as seed size (Halpern, 2005). Additionally, neutral processes such as assembly history may determine the structure of seed-associated bacterial assemblages (Aleklett and Hart, 2013). In other words, the colonization order of the seed habitat during its development and maturation could have a decisive impact on community assembly, as it has been previ-ously shown for other plant-related habitat such as the phyllosphere (Maignien et al., 2014).
Early seed colonizers are probably transmitted from plant to seed by two major pathways: (i) internal transmis-sion through the vascular system or (ii) floral transmistransmis-sion by the stigma (Maude, 1996; Darsonval et al., 2008). Then, other microbial entities are subsequently incorpo-rated within the microbiota during seed development through contact of the seed with microorganisms present on fruits, flowers or residues (Maude, 1996). At harvest and post-harvest, the seed is also in contact with tools used for harvest and threshing and with the locale in which it is stored. Therefore, the structure of seed-associated microbial assemblage is probably shaped by the spatio-temporal dynamics of microbial interactions. In order to detect potential interactions within bacterial and fungal communities associated to seeds, we have ana-lysed co-occurrence networks of OTUs among the seed samples examined in our study using SparCC (Friedman and Alm, 2012). These analyses revealed differences
© 2015 Society for Applied Microbiology and John Wiley & Sons Ltd, Environmental Microbiology
1bs_bs_query 2bs_bs_query 3bs_bs_query 4bs_bs_query 5bs_bs_query 6bs_bs_query 7bs_bs_query 8bs_bs_query 9bs_bs_query 10bs_bs_query 11bs_bs_query 12bs_bs_query 13bs_bs_query 14bs_bs_query 15bs_bs_query 16bs_bs_query 17bs_bs_query 18bs_bs_query 19bs_bs_query 20bs_bs_query 21bs_bs_query 22bs_bs_query 23bs_bs_query 24bs_bs_query 25bs_bs_query 26bs_bs_query 27bs_bs_query 28bs_bs_query 29bs_bs_query 30bs_bs_query 31bs_bs_query 32bs_bs_query 33bs_bs_query 34bs_bs_query 35bs_bs_query 36bs_bs_query 37bs_bs_query 38bs_bs_query 39bs_bs_query 40bs_bs_query 41bs_bs_query 42bs_bs_query 43bs_bs_query 44bs_bs_query 45bs_bs_query 46bs_bs_query 47bs_bs_query 48bs_bs_query 49bs_bs_query 50bs_bs_query 51bs_bs_query 52bs_bs_query 53bs_bs_query 54bs_bs_query 55bs_bs_query 56bs_bs_query 57bs_bs_query 58bs_bs_query 59bs_bs_query 60bs_bs_query 61bs_bs_query 62bs_bs_query 63bs_bs_query 64bs_bs_query 65bs_bs_query 66bs_bs_query 67bs_bs_query 68bs_bs_query 69bs_bs_query 70bs_bs_query 71bs_bs_query 72bs_bs_query 73bs_bs_query 74bs_bs_query 75bs_bs_query 76bs_bs_query 77bs_bs_query 78bs_bs_query 79bs_bs_query 80bs_bs_query 81bs_bs_query 82bs_bs_query 83bs_bs_query 84bs_bs_query 85bs_bs_query 86bs_bs_query 87bs_bs_query 88bs_bs_query 89bs_bs_query 90bs_bs_query 91bs_bs_query 92bs_bs_query 93bs_bs_query 94bs_bs_query 95bs_bs_query 96bs_bs_query 97bs_bs_query 98bs_bs_query 99bs_bs_query 100bs_bs_query 101bs_bs_query 102bs_bs_query 103bs_bs_query 104bs_bs_query 105bs_bs_query 106bs_bs_query 107bs_bs_query
in the topology of bacterial and fungal co-occurrence networks, with more inferred correlations within bacterial networks than within fungal networks. This might suggest less interactions between fungal entities of microbial assemblages as results of compartmentalization of fungal populations within different locations (from the embryo to the testa) of the seed habitat (Singh and Mathure, 2004; Pochon et al., 2012). Investigation of co-occurrence net-works also highlighted frequent co-occurrence of OTUs related to the same bacterial or fungal class, which is in agreement with previous network analyses (Toju et al., 2014; Barret et al., 2015). However, hubs of bacterial network were related to taxonomically diverse OTUs, which may indicate that these hubs possessed different functional potentials. However, this hypothesis has to be validated with experimental models in order to determine whether these distinct bacterial taxa are not functionally similar entities.
In comparison with seed-associated bacterial assem-blages, fungal assemblages are less diverse across seed samples harvested from the same bean cultivar at the same experimental site (27.6–55.9% of shared fungal OTUs), confirming previous observations on other seed-associated fungal assemblages (Barret et al., 2015). Although fungal assemblages of seeds of the same bean cultivar harvested on the same production region are rela-tively similar, we only detected seven conserved fungal OTUs across all genotypes cultivated on both experi-mental sites. These core OTUs are affiliated to ubiquitous fungal genera such as Alternaria (Woudenberg et al., 2013) and Cladosporium (Bensch et al., 2012), which are frequently associated to various plant habitats includ-ing seeds (Links et al., 2014; Barret et al., 2015). The relatively small proportion of fungal members systemati-cally associated to all seed samples is explained by a strong effect of terroir on fungal diversity. Hence, seed-associated fungal assemblages are, unlike bacterial assemblages, driven by deterministic processes, which is in accordance with biogeographic patterns observed in various soil-associated fungal assemblages (Meiser
et al., 2013; Bahram et al., 2015). Therefore, it seems
highly plausible that a majority of fungi associated to bean seeds are primarily derived from the local environment (e.g. soilborne or airborne fungi) rather than from one plant generation to another (seedborne). The taxonomic affiliation of fungal OTUs significantly enriched in the BZH or LUX sites promotes this hypothesis. For instance, OTUs related to soilborne fungi such as Fusarium (Roncero et al., 2003) and Rhizoctonia (Okubara et al., 2014) are significantly enriched in the experimental site located in LUX. Therefore, the dispersion of seed in different production regions (or terroirs) affects seed-associated fungal assemblages and may consequently impact seed fitness. Despite the use of genetically diverse
cultivars for this analysis, no cultivar effect on fungal assemblages was detected.
Overall, the present work suggests that seed-associated microbial assemblage is determined by niche-based processes and that the terroir is a key driver of these selective forces. Farmers engaged in small-scale, local seed production thus seem to be safeguarding not only the seed and genetic diversity of traditional cultivars (Negri & Tiranti, 2010), but also the seed-associated microbial assemblages specific of their terroirs. Although we cannot conclude on the specific implications of par-ticular terroir-bound microbial assemblages on plant health and fitness, it is tempting to speculate that these assemblages may play a role in the local adaptation of crops to their production site. Further research on the functional properties of seed-associated microorganisms will give further insight into this role.
Experimental procedures Field trials
The effect of terroir and cultivar on the structure of seed-associated microbial assemblages was assessed by analys-ing seed samples obtained in two different farms located in BZH and LUX. Seed samples were obtained by multiplying five initial seed lots for two consecutive years in both farms. Both farms are organic and engaged in small-scale seed production of traditional cultivars. According to the definition given in the introduction, terroir is the result of the interaction between a human community and the environment, including its biotic and abiotic components. Under real-life conditions, the bean crop interacts with the abiotic, biotic and human environment in the field and post-harvest. Therefore, crop management (Table S1), seed harvest and post-harvest cleaning and sorting were conducted according to the prac-tices of the local farmers to account for all the components of terroir. The two experimental sites are characterized by dif-ferences in average temperature and rainfall (Table S1). Moreover, soil analyses revealed variations in calcium, nitro-gen, potassium and phosphorous content as well as differ-ences of pH (Table S1).
Four of the seed lots consisted of farm seeds of traditional cultivars representing a range in tolerance to diseases and climatic factors, namely FlC, RdC, RdB and SES. Seed of the commercial cultivar Cal obtained from Hild Samen GmbH was used as a commercial control.
Field trials were organized as three complete replicated
blocks per cultivar with plot sizes ranging from 5.6 to 9 m2
according to site and year. Plants were harvested and threshed by stomping. A first cleaning and sorting step was carried out by a traditional wind separator. A second sorting step was done by hand according to the practices of the local farmers. A total of 27 seed samples were harvested in 2013 after the initial seed lots had been exposed to contrasting biotic and abiotic environments for two consecutive years. There were 15 seed samples obtained in BZH, whereas only 12 seed lots were harvested in LUX because the cultivar RdC failed to yield sufficient seed for analyses.
1bs_bs_query 2bs_bs_query 3bs_bs_query 4bs_bs_query 5bs_bs_query 6bs_bs_query 7bs_bs_query 8bs_bs_query 9bs_bs_query 10bs_bs_query 11bs_bs_query 12bs_bs_query 13bs_bs_query 14bs_bs_query 15bs_bs_query 16bs_bs_query 17bs_bs_query 18bs_bs_query 19bs_bs_query 20bs_bs_query 21bs_bs_query 22bs_bs_query 23bs_bs_query 24bs_bs_query 25bs_bs_query 26bs_bs_query 27bs_bs_query 28bs_bs_query 29bs_bs_query 30bs_bs_query 31bs_bs_query 32bs_bs_query 33bs_bs_query 34bs_bs_query 35bs_bs_query 36bs_bs_query 37bs_bs_query 38bs_bs_query 39bs_bs_query 40bs_bs_query 41bs_bs_query 42bs_bs_query 43bs_bs_query 44bs_bs_query 45bs_bs_query 46bs_bs_query 47bs_bs_query 48bs_bs_query 49bs_bs_query 50bs_bs_query 51bs_bs_query 52bs_bs_query 53bs_bs_query 54bs_bs_query 55bs_bs_query 56bs_bs_query 57bs_bs_query 58bs_bs_query 59bs_bs_query 60bs_bs_query 61bs_bs_query 62bs_bs_query 63bs_bs_query 64bs_bs_query 65bs_bs_query 66bs_bs_query 67bs_bs_query 68bs_bs_query 69bs_bs_query 70bs_bs_query 71bs_bs_query 72bs_bs_query 73bs_bs_query 74bs_bs_query 75bs_bs_query 76bs_bs_query 77bs_bs_query 78bs_bs_query 79bs_bs_query 80bs_bs_query 81bs_bs_query 82bs_bs_query 83bs_bs_query 84bs_bs_query 85bs_bs_query 86bs_bs_query 87bs_bs_query 88bs_bs_query 89bs_bs_query 90bs_bs_query 91bs_bs_query 92bs_bs_query 93bs_bs_query 94bs_bs_query 95bs_bs_query 96bs_bs_query 97bs_bs_query 98bs_bs_query 99bs_bs_query 100bs_bs_query 101bs_bs_query 102bs_bs_query 103bs_bs_query 104bs_bs_query 105bs_bs_query 106bs_bs_query 107bs_bs_query 108bs_bs_query 109bs_bs_query 110bs_bs_query 111bs_bs_query 112bs_bs_query 8 bs_bs_query
Plant DNA extraction and SSR genotyping
The diversity of morphological and agronomic traits among the bean cultivars employed suggested a large genetic diver-sity, suited to test the effect of host genotypes on seed-associated microbial assemblages. In order to verify and explore the genetic diversity existing among and within the five common bean cultivars, a total of 88 bean plants were genotyped using 11 SSR molecular markers. These included 18 plants from each one of the four traditional cultivars (FlC, RdC, RdB and SES) and 16 from the commercial cultivar Cal. In 2014, the plants were grown in a greenhouse from the seed lots used to implement the field trials and 50 mg of fresh leaf tissue were collected from each individual plant. Genomic DNA was extracted using the TissueLyser II (Qiagen) and the extraction kit DNeasy® 96 Plant Kit (Qiagen) according to protocols provided by the manufac-turer. The DNA quality and concentration were assessed through spectrophotometry using NanoDrop 2000 (Thermo Scientific).
The molecular characterization was carried out using 11 SSR markers covering all the species linkage groups (Table S2). For each primer combination, the forward primer
was 5′ end-labelled with one of the fluorescent tags 6-FAM,
VIC, NED and PET (Applied Biosystems). Multiplex reactions were prepared using primers with similar annealing tempera-ture and taking into account amplicon sizes. All the polymer-ase chain reaction (PCR) reactions were performed in an
Applied Biosystems 2720 Thermal Cycler in a volume of 12μl
containing the following: 20 ng of template DNA, 1× Type-it®
Multiplex PCR Master Mix (Qiagen) and 0.4μM of each
primer and using the following thermal profile: 94°C for 4 min, followed by 12 cycles of 94°C for 30 s, x°C for 30 s, 72°C for
30 s, 25 cycles of 94°C for 10 s, x′°C for 15 s, 72°C for 20 s
and 20 min at 72°C in the final extension where x was equal
to the annealing temperature and x′ to the same temperature
decreased by 1°C (Table S2). The amplification products were combined with highly deionized formamide and a size standard (GeneScan™ 500 LIZ®, Applied Biosystems) and separated on a ABI3130xl automated sequencer. Sample profiles were scored manually using the GENEMAPPER® Software version 4.0 (Applied Biosystems).
SSR data analysis
A moment-based richness estimator was used to calculate allelic richness up to the number of individuals present in each cultivar using the R function for allelic richness estima-tion (ARES) from Van Loon et al. (2007). Mean accumulaestima-tion curves of estimated allelic richness were produced. The total number of polymorphic loci was calculated following the cri-terion of 95% of major allele frequency. For each cultivar and SSR locus, number (Na) and effective number (Ne) of alleles per locus, observed (Ho) and (He) expected heterozygosity and number of private alleles (P) were calculated. A Mann– Whitney (MW) test was performed to assess the cultivar effect on the above-mentioned diversity parameters in pairwise comparisons. Because of the high degree of selfing of common bean, fixation index and deviation from Hardy– Weinberg equilibrium were not calculated.
A pairwise, individual-by-individual (N× N) GD matrix was
calculated for co-dominant data according to Peakall et al.
(1995) and Smouse and Peakall (1999) and used to perform
a PCoA. PCoA results were plotted using the GGPLOT2
package (Wickhan, 2009) inRsoftware (R Development Core
Team, 2014). AMOVA was used to study the partition of molecular variance components among and within cultivars. Statistical significance of obtained results was tested using
999 permutations with GENALEX software 6.3 version
(Peakall and Smouse, 2006). Within cultivar, diversity was worked out as average number of pairwise differences between individuals (PiX). Genetic differentiation between cultivars was also assessed as the average number of pairwise differences between cultivars (PiXY). Finally, the corrected number of average pairwise differences between
cultivars was worked out as [PiXY− (PiX + PiY)/2]. These
parameters were calculated using ARLEQUINver 3.5 (Excoffier
and Lischer, 2010).
Microbial DNA extraction, amplicon library construction and sequencing
Approximately 200 bean seeds of each sample were trans-ferred in a sterile blender bag containing 250 ml of phosphate buffer saline supplemented with 0.05% (v/v) of Tween® 20. Samples were incubated overnight at 4°C under constant
agitation. Suspensions were centrifugated (6000× g, 10 min,
4°C) and pellets were re-suspended in approximately 2 ml of supernatant and transferred in microtubes. Total genomic DNA was extracted from 27 different samples using PowerSoil® DNA isolation kit (MO BIO) following the manu-facturer’s protocol (Table S6). In addition, an artificial com-munity sample was prepared by mixing equal amounts of genomic DNA of 15 bacterial strains belonging to 13 distinct bacterial families (Barret et al., 2015). This artificial commu-nity sample is a useful indicator of sequencing error rate (Schloss et al., 2011).
Amplicon libraries were constructed following two rounds of PCR amplification. The first round was performed with the PCR primers 515f/806r (Caporaso et al., 2011) and ITS1F/ ITS2 (Buee et al., 2009), which target the V4 region of 16S rRNA gene and ITS1 respectively. Forward and reverse
primers carry the following 5′-CTTTCCCTACACGACGCT
CTTCCGATCT-3′ and 5′-GGAGTTCAGACGTGTGCTCTTC
CGATCT-3′ tails respectively. All PCR reactions were
per-formed with a high-fidelity polymerase (AccuPrimeTM Taq
DNA Polymerase System; Invitrogen) using the
manufactur-er’s protocol and 2μl of environmental DNA (approximately
10 ng). Cycling conditions for 515f/806r and ITS1F/ITS2 were adapted from Caporaso and colleagues (2011) and Buee and colleagues (2009). Reactions were held at 94°C for 2 min, followed by 30 cycles of amplification 94°C (30 s), 50°C (60 s) and 68°C (90 s) with a final extension step of 10 min at 68°C. All amplicons were purified with the Agencourt®
AMPure® XP system and quantified with QuantITTM
PicoGreen®. The second round of amplification was
per-formed with 5μl of purified amplicons and primers containing
the Illumina adapters and indexes. PCR cycling conditions were: 94°C (2 min), followed by 12 cycles of amplification [94°C (1 min), 55°C (1 min) and 68°C (1 min)] and a final extension step at 68°C (10 min). All amplicons were purified and quantified as previously described. The purified amplicons were then pooled in equimolar concentrations and © 2015 Society for Applied Microbiology and John Wiley & Sons Ltd, Environmental Microbiology
1bs_bs_query 2bs_bs_query 3bs_bs_query 4bs_bs_query 5bs_bs_query 6bs_bs_query 7bs_bs_query 8bs_bs_query 9bs_bs_query 10bs_bs_query 11bs_bs_query 12bs_bs_query 13bs_bs_query 14bs_bs_query 15bs_bs_query 16bs_bs_query 17bs_bs_query 18bs_bs_query 19bs_bs_query 20bs_bs_query 21bs_bs_query 22bs_bs_query 23bs_bs_query 24bs_bs_query 25bs_bs_query 26bs_bs_query 27bs_bs_query 28bs_bs_query 29bs_bs_query 30bs_bs_query 31bs_bs_query 32bs_bs_query 33bs_bs_query 34bs_bs_query 35bs_bs_query 36bs_bs_query 37bs_bs_query 38bs_bs_query 39bs_bs_query 40bs_bs_query 41bs_bs_query 42bs_bs_query 43bs_bs_query 44bs_bs_query 45bs_bs_query 46bs_bs_query 47bs_bs_query 48bs_bs_query 49bs_bs_query 50bs_bs_query 51bs_bs_query 52bs_bs_query 53bs_bs_query 54bs_bs_query 55bs_bs_query 56bs_bs_query 57bs_bs_query 58bs_bs_query 59bs_bs_query 60bs_bs_query 61bs_bs_query 62bs_bs_query 63bs_bs_query 64bs_bs_query 65bs_bs_query 66bs_bs_query 67bs_bs_query 68bs_bs_query 69bs_bs_query 70bs_bs_query 71bs_bs_query 72bs_bs_query 73bs_bs_query 74bs_bs_query 75bs_bs_query 76bs_bs_query 77bs_bs_query 78bs_bs_query 79bs_bs_query 80bs_bs_query 81bs_bs_query 82bs_bs_query 83bs_bs_query 84bs_bs_query 85bs_bs_query 86bs_bs_query 87bs_bs_query 88bs_bs_query 89bs_bs_query 90bs_bs_query 91bs_bs_query 92bs_bs_query 93bs_bs_query 94bs_bs_query 95bs_bs_query 96bs_bs_query 97bs_bs_query 98bs_bs_query 99bs_bs_query 100bs_bs_query 101bs_bs_query 102bs_bs_query 103bs_bs_query 104bs_bs_query 105bs_bs_query 106bs_bs_query 107bs_bs_query 108bs_bs_query 109bs_bs_query 110bs_bs_query 111bs_bs_query 112bs_bs_query 113bs_bs_query 114bs_bs_query 115bs_bs_query 116bs_bs_query 117bs_bs_query 118bs_bs_query 119bs_bs_query 120bs_bs_query 9 bs_bs_query 10 bs_bs_query 11 bs_bs_query 12 bs_bs_query
the final concentration of the library was determined using a qPCR NGS Library Quantification Kit. Amplicon libraries were mixed with 5% PhiX control according to Illumina’s protocols. Sequencing run was performed with MiSeq Reagent Kit v2 (500 cycles).
Clustering MiSeq reads into OTUs
Raw reads were analysed using the steps described in Barret and colleagues (2015). Briefly, 16S rRNA gene sequences were aligned against the 16S rRNA gene SILVA alignment
using MOTHUR V1.33 (Schloss et al., 2009). Chimeric
sequences were detected withUCHIME (Edgar et al., 2011)
and subsequently removed from the data set. Taxonomic affiliation of 16S rRNA genes was performed with a Bayesian classifier (Wang et al., 2007) (80% bootstrap confidence score) against the 16S rRNA gene training set (v9) of the Ribosomal Database Project (Cole et al., 2009). Unclassified sequences or sequences belonging to Eukaryota, Archaea, chloroplasts or mitochondria were discarded. Sequences were assigned to OTUs at 97% identity.
The variable ITS1 regions of ITS sequences
were extracted with the Perl-based software ITSX
(Bengtsson-Palme et al., 2013). Then sequences were
pro-cessed using the QUANTITATIVE INSIGHT INTO MICROBIAL
ECOLOGY (QIIME V1.7.0) software (Caporaso et al., 2010).
Sequences were clustered at a 97% identity cut-off using
UCLUST (Edgar, 2010) and taxonomic affiliation was
per-formed with a Bayesian classifier (Wang et al., 2007) (80% bootstrap confidence score) against the UNITE database (Abarenkov et al., 2010).
Microbial community analyses
Only abundant OTUs representing at least 0.1% of the library size were conserved for microbial community analyses
(Barret et al., 2015). Bothα and β diversity indexes were
calculated withMOTHUR V1.33 (Schloss et al., 2009).
Rich-ness was assessed with the number of observed OTUs and diversity with Simpson’s inverse index. Kruskal–Wallis one-way analysis of variance by ranks (Kruskal and Wallis, 1952) was performed to assess the effect of the different factors on α-diversity. The effects of cultivation site and cultivar were tested across cultivation sites, whereas the effect of field replications was tested within each site. Beta-diversity was assessed using Bray–Curtis dissimilarity index (Bray and Curtis, 1957). AMOVA (Excoffier et al., 1992) was performed to assess the effect of the different factors on the microbial
community structure (P< 0.05). Moreover, CAP was
con-ducted to measure the relative influence of terroir and the
bean cultivar on the microbialβ-diversity. CAP analyses were
performed with the function capscale of vegan and signifi-cances of the factors were calculated with ANOVA-like per-mutation tests using the function permutest. Differences in taxonomic abundance were highlighted with Krona radial space-filling display (Ondov et al., 2011).
Differences in relative abundance of OTUs between the
different factors were assessed with the R packageEDGER
(Robinson et al., 2010). Sequence counts were first normal-ized with the Relative Log Expression method (Anders and
Huber, 2010), which is implemented inEDGER. Exact binomial
tests corrected for multiples inferences with the Benjamini– Hochberg method (Benjamini and Hochberg, 1995) were then performed to detect differences in relative OTUs abun-dance between factors. OTUs were defined as significantly enriched or depleted in one treatment with a corrected P-value< 0.001 and a log2fold change magnitude≥ 2.
Cor-relations between OTUs were calculated with the SparCC
(Friedman and Alm, 2012) implemented in MOTHUR.
The effect of uneven sampling was corrected by dividing sequence counts by total library size (proportion). Statistical significance of the inferred correlations was assessed with a bootstrap procedure (100 replications). Only correlations with
pseudo P-value ≤ 0.001 were represented in the network
using the R packageQGRAPH(Epskamp et al., 2012).
All sequences have been deposited in the ENA database under the accession number PRJEB8866.
Acknowledgements
This research was supported in parts by grants awarded by the Region des Pays de la Loire (Qualisem, metaSEED, 2013 10080). The PhD research of the first author is supported by the Fonds National de la Recherche, Luxembourg (project 5126594) and forms part of the SOLIBAM project (Strategies for Organic and Low input Integrated Breeding and Manage-ment, 2010–2014), funded by the European Community’s Seventh Framework Programme (FP7/2007–2013) under the grant agreement n. 245058. The authors wish to thank Ger-aldine Taghouti, Perrine Portier and CIRM-CFBP (http://www-intranet.angers.inra.fr/cfbp/ IRHS UMR 1345 INRA-ACO-UA) for providing bacterial strains; Muriel Bahut and Laurence Hibrand-Saint Oyant from the platform ANAN of SFR QuaSav for their help on the MiSeq experiments; Carlo Tissi, Univer-sity of Perugia, for his help in carrying out common bean genotyping runs; and the seed producers of the association Croqueurs de Carottes for their participation in the project. Authors of this manuscript report no conflicts of interest.
References
Abarenkov, K., Henrik Nilsson, R., Larsson, K.H., Alexander, I.J., Eberhardt, U., Erland, S., et al. (2010) The UNITE database for molecular identification of fungi – recent updates and future perspectives. New Phytol 186: 281– 285.
Aleklett, K., and Hart, M. (2013) The root microbiota – a fingerprint in the soil? Plant Soil 370: 671–686.
Anders, S., and Huber, W. (2010) Differential expression analysis for sequence count data. Genome Biol 11: R106. Bacilio-Jimenez, M., Aguilar-Flores, S., del Valle, M.V., Perez, A., Zepeda, A., and Zenteno, E. (2001) Endophytic bacteria in rice seeds inhibit early colonization of roots by Azospirillum brasilense. Soil Biol Biochem 33: 167–172. Badri, D.V., Zolla, G., Bakker, M.G., Manter, D.K., and
Vivanco, J.M. (2013) Potential impact of soil microbiomes on the leaf metabolome and on herbivore feeding behavior. New Phytol 198: 264–273.
Bahram, M., Peay, K.G., and Tedersoo, L. (2015) Local-scale biogeography and spatiotemporal variability in communi-ties of mycorrhizal fungi. New Phytol 205: 1454–1463.
1bs_bs_query 2bs_bs_query 3bs_bs_query 4bs_bs_query 5bs_bs_query 6bs_bs_query 7bs_bs_query 8bs_bs_query 9bs_bs_query 10bs_bs_query 11bs_bs_query 12bs_bs_query 13bs_bs_query 14bs_bs_query 15bs_bs_query 16bs_bs_query 17bs_bs_query 18bs_bs_query 19bs_bs_query 20bs_bs_query 21bs_bs_query 22bs_bs_query 23bs_bs_query 24bs_bs_query 25bs_bs_query 26bs_bs_query 27bs_bs_query 28bs_bs_query 29bs_bs_query 30bs_bs_query 31bs_bs_query 32bs_bs_query 33bs_bs_query 34bs_bs_query 35bs_bs_query 36bs_bs_query 37bs_bs_query 38bs_bs_query 39bs_bs_query 40bs_bs_query 41bs_bs_query 42bs_bs_query 43bs_bs_query 44bs_bs_query 45bs_bs_query 46bs_bs_query 47bs_bs_query 48bs_bs_query 49bs_bs_query 50bs_bs_query 51bs_bs_query 52bs_bs_query 53bs_bs_query 54bs_bs_query 55bs_bs_query 56bs_bs_query 57bs_bs_query 58bs_bs_query 59bs_bs_query 60bs_bs_query 61bs_bs_query 62bs_bs_query 63bs_bs_query 64bs_bs_query 65bs_bs_query 66bs_bs_query 67bs_bs_query 68bs_bs_query 69bs_bs_query 70bs_bs_query 71bs_bs_query 72bs_bs_query 73bs_bs_query 74bs_bs_query 75bs_bs_query 76bs_bs_query 77bs_bs_query 78bs_bs_query 79bs_bs_query 80bs_bs_query 81bs_bs_query 82bs_bs_query 83bs_bs_query 84bs_bs_query 85bs_bs_query 86bs_bs_query 87bs_bs_query 88bs_bs_query 89bs_bs_query 90bs_bs_query 91bs_bs_query 92bs_bs_query 93bs_bs_query 94bs_bs_query 95bs_bs_query 96bs_bs_query 97bs_bs_query 98bs_bs_query 99bs_bs_query 100bs_bs_query 101bs_bs_query 102bs_bs_query 103bs_bs_query 104bs_bs_query 105bs_bs_query 106bs_bs_query 107bs_bs_query 108bs_bs_query 109bs_bs_query 110bs_bs_query 111bs_bs_query 112bs_bs_query 113bs_bs_query 114bs_bs_query 115bs_bs_query 116bs_bs_query 117bs_bs_query 13 bs_bs_query
Baker, K.F., and Smith, S.H. (1966) Dynamics of seed trans-mission of plant pathogens. Ann Rev Phytopathol 4: 311– 332.
Barret, M., Briand, M., Bonneau, S., Préveaux, A., Valière, S., Bouchez, O., et al. (2015) Emergence shapes the structure of the seed microbiota. Appl Environ Microbiol 81: 1257– 1266.
Bengtsson-Palme, J., Ryberg, M., Hartmann, M., Branco, S., Wang, Z., Godhe, A., et al. (2013) Improved software detection and extraction of ITS1 and ITS2 from ribosomal ITS sequences of fungi and other eukaryotes for analysis of environmental sequencing data. Methods Ecol Evol 4: 914–919.
Benjamini, Y., and Hochberg, Y. (1995) Controlling the false discovery rate: a practical and powerful approach to multi-ple testing. J Roy Stat Soc B 57: 289–300.
Bensch, K., Braun, U., Groenewald, J.Z., and Crous, P.W. (2012) The genus Cladosporium. Stud Mycol 72: 1–401. Bokulich, N.A., Thorngate, J.H., Richardson, P.M., and Mills,
D.A. (2014) Microbial biogeography of wine grapes is con-ditioned by cultivar, vintage, and climate. Proc Natl Acad Sci USA 111: E139–E148.
Bray, J.R., and Curtis, J.T. (1957) An ordination of the upland forest communities of Southern Wisconsin. Ecol Monogr 27: 325–349.
Buee, M., Reich, M., Murat, C., Morin, E., Nilsson, R.H., Uroz, S., and Martin, F. (2009) 454 Pyrosequencing analyses of forest soils reveal an unexpectedly high fungal diversity. New Phytol 184: 449–456.
Bulgarelli, D., Rott, M., Schlaeppi, K., van Themaat, E.V.L., Ahmadinejad, N., Assenza, F., et al. (2012) Revealing structure and assembly cues for Arabidopsis root-inhabiting bacterial microbiota. Nature 488: 91–95.
Bulgarelli, D., Schlaeppi, K., Spaepen, S.,
Ver Loren van Themaat, E., and Schulze-Lefert, P. (2013) Structure and functions of the bacterial microbiota of plants. Annu Rev Plant Biol 64: 807–838.
Caporaso, J.G., Kuczynski, J., Stombaugh, J., Bittinger, K., Bushman, F.D., Costello, E.K., et al. (2010) QIIME allows analysis of high-throughput community sequencing data. Nat Methods 7: 335–336.
Caporaso, J.G., Lauber, C.L., Walters, W.A., Berg-Lyons, D., Lozupone, C.A., Turnbaugh, P.J., et al. (2011) Global pat-terns of 16S rRNA diversity at a depth of millions of sequences per sample. Proc Natl Acad Sci USA 108 (Suppl. 1): 4516–4522.
Cole, J.R., Wang, Q., Cardenas, E., Fish, J., Chai, B., Farris, R.J., et al. (2009) The Ribosomal Database Project: improved alignments and new tools for rRNA analysis. Nucleic Acids Res 37 (Database issue): D141–D145. Darrasse, A., Darsonval, A., Boureau, T., Brisset, M.-N.,
Durand, K., and Jacques, M.-A. (2010) Transmission of plant-pathogenic bacteria by nonhost seeds without induc-tion of an associated defense reacinduc-tion at emergence. Appl Environ Microbiol 76: 6787–6796.
Darsonval, A., Darrasse, A., Meyer, D., Demarty, M., Durand, K., Bureau, C., et al. (2008) The type III secretion system of Xanthomonas fuscans subsp. fuscans is involved in the phyllosphere colonization process and in transmission to seeds of susceptible beans. Appl Environ Microbiol 74: 2669–2678.
Edgar, R.C. (2010) Search and clustering orders of magni-tude faster than BLAST. Bioinformatics 26: 2460–2461. Edgar, R.C., Haas, B.J., Clemente, J.C., Quince, C., and
Knight, R. (2011) UCHIME improves sensitivity and speed of chimera detection. Bioinformatics 27: 2194–2200. Epskamp, S., Cramer, A.O.J., Waldorp, L.J., Schmittmann,
V.D., and Borsboom, D. (2012) qgraph: network visualiza-tions of relavisualiza-tionships in psychometric data. J Stat Softw 48: 1–18.
Excoffier, L., Smouse, P.E., and Quattro, J.M. (1992) Analysis of molecular variance inferred from metric dis-tances among DNA haplotypes: application to human mitochondrial DNA restriction data. Genetics 131: 479– 491.
Friedman, J., and Alm, E.J. (2012) Inferring correlation net-works from genomic survey data. PLoS Comput Biol 8: e1002687.
Goggin, D.E., Emery, R.J., Kurepin, L.V., and Powles, S.B. (2015) A potential role for endogenous microflora in dor-mancy release, cytokinin metabolism and the response to fluridone in Lolium rigidum seeds. Ann Bot (Lond) 115: 293–301.
Halpern, S.L. (2005) Sources and consequences of seed size variation in Lupinus perennis (Fabaceae): adaptive and non-adaptive hypotheses. Am J Bot 92: 205–213. Hardoim, P.R., Hardoim, C.C.P., van Overbeek, L.S., and van
Elsas, J.D. (2012) Dynamics of seed-borne rice
endophytes on early plant growth stages. PLoS ONE 7: ••–••.
Horton, M.W., Bodenhausen, N., Beilsmith, K., Meng, D., Muegge, B.D., Subramanian, S., et al. (2014) Genome-wide association study of Arabidopsis thaliana leaf micro-bial community. Nat Commun 5: 5320.
Johnston-Monje, D., and Raizada, M.N. (2011) Conservation and diversity of seed associated endophytes in Zea across boundaries of evolution, ethnography and ecology. PLoS ONE 6: e20396.
Kruskal, W.H., and Wallis, A. (1952) Use of ranks in one-criterion variance analysis. J Am Stat Assoc 47: 583–621. Lhomme, E., Urien, C., Legrand, J., Dousset, X., Onno, B., and Sicard, D. (2015) Sourdough microbial community dynamics: an analysis during French organic bread-making processes. Food Microbiol ••: ••–••.
Links, M.G., Demeke, T., Grafenhan, T., Hill, J.E.,
Hemmingsen, S.M., and Dumonceaux, T.J. (2014) Simul-taneous profiling of seed-associated bacteria and fungi reveals antagonistic interactions between microorganisms within a shared epiphytic microbiome on Triticum and Brassica seeds. New Phytol 202: 542–553.
Lopez-Velasco, G., Carder, P.A., Welbaum, G.E., and Ponder, M.A. (2013) Diversity of the spinach (Spinacia oleracea) spermosphere and phyllosphere bacterial com-munities. FEMS Microbiol Lett 346: 146–154.
Lundberg, D.S., Lebeis, S.L., Paredes, S.H., Yourstone, S., Gehring, J., Malfatti, S., et al. (2012) Defining the core Arabidopsis thaliana root microbiome. Nature 488: 86– 90.
Maignien, L., DeForce, E.A., Chafee, M.E., Eren, A.M., and Simmons, S.L. (2014) Ecological succession and stochas-tic variation in the assembly of Arabidopsis thaliana phyllosphere communities. mBio 5: e00682–13.
© 2015 Society for Applied Microbiology and John Wiley & Sons Ltd, Environmental Microbiology
1bs_bs_query 2bs_bs_query 3bs_bs_query 4bs_bs_query 5bs_bs_query 6bs_bs_query 7bs_bs_query 8bs_bs_query 9bs_bs_query 10bs_bs_query 11bs_bs_query 12bs_bs_query 13bs_bs_query 14bs_bs_query 15bs_bs_query 16bs_bs_query 17bs_bs_query 18bs_bs_query 19bs_bs_query 20bs_bs_query 21bs_bs_query 22bs_bs_query 23bs_bs_query 24bs_bs_query 25bs_bs_query 26bs_bs_query 27bs_bs_query 28bs_bs_query 29bs_bs_query 30bs_bs_query 31bs_bs_query 32bs_bs_query 33bs_bs_query 34bs_bs_query 35bs_bs_query 36bs_bs_query 37bs_bs_query 38bs_bs_query 39bs_bs_query 40bs_bs_query 41bs_bs_query 42bs_bs_query 43bs_bs_query 44bs_bs_query 45bs_bs_query 46bs_bs_query 47bs_bs_query 48bs_bs_query 49bs_bs_query 50bs_bs_query 51bs_bs_query 52bs_bs_query 53bs_bs_query 54bs_bs_query 55bs_bs_query 56bs_bs_query 57bs_bs_query 58bs_bs_query 59bs_bs_query 60bs_bs_query 61bs_bs_query 62bs_bs_query 63bs_bs_query 64bs_bs_query 65bs_bs_query 66bs_bs_query 67bs_bs_query 68bs_bs_query 69bs_bs_query 70bs_bs_query 71bs_bs_query 72bs_bs_query 73bs_bs_query 74bs_bs_query 75bs_bs_query 76bs_bs_query 77bs_bs_query 78bs_bs_query 79bs_bs_query 80bs_bs_query 81bs_bs_query 82bs_bs_query 83bs_bs_query 84bs_bs_query 85bs_bs_query 86bs_bs_query 87bs_bs_query 88bs_bs_query 89bs_bs_query 90bs_bs_query 91bs_bs_query 92bs_bs_query 93bs_bs_query 94bs_bs_query 95bs_bs_query 96bs_bs_query 97bs_bs_query 98bs_bs_query 99bs_bs_query 100bs_bs_query 101bs_bs_query 102bs_bs_query 103bs_bs_query 104bs_bs_query 105bs_bs_query 106bs_bs_query 107bs_bs_query 108bs_bs_query 109bs_bs_query 110bs_bs_query 111bs_bs_query 112bs_bs_query 113bs_bs_query 114bs_bs_query 115bs_bs_query 116bs_bs_query 117bs_bs_query 118bs_bs_query 119bs_bs_query 120bs_bs_query 121bs_bs_query 122bs_bs_query 14 bs_bs_query 15 bs_bs_query 16 bs_bs_query 17 bs_bs_query