Vol. 145: 109-121,1996 l
MARINE ECOLOGY PROGRESS SERIES
Mar Ecol Prog S e r Published December 31
Carbon fluxes in coral reefs. I. Lagrangian
measurement of community metabolism and
resulting air-sea CO2 disequilibrium
'Observatoire Oceanologique Europeen, Centre Scientiiique d e Monaco, Avenue Saint-Martin. MC-98000 Monaco, Principality of Monaco
'Laboratoire d e Biologie Marine et Malacologie. URA CNRS 1453, EPHE, Universite de Perpignan, F-66860 Perpignan Cedex. France
3 ~ u s t r a l i a n Institute of Marine Science, PMB No. 3, Townsville M. C., Queensland 4810, Australia 4Centre de Recherches Insulaires et Observatoire d e l'Environnement, EPHE, BP 1013, Moorea, French Polynesia
'Laboratoire d'Oceanologie, Universite d e Liege, Institut d e Chimie Bat B6, B-4000 Sart Tilman, Belgium
ABSTRACT- Community metabolism was investigated uslng a Lagrangian flow resplrometry tech- nique on 2 reef flats at Sloorea (French l'olynesia) during austral winter and Yonge Reef (Great Barrier Reef) during austral summer. The data were used to estimate related air-sea CO, disequilibrium. A slne funct~on did not sdtisfactorily model the d ~ e l light curves and ov~rrstsmated the metabolic parameters. The ranges of community gross primary production and respirat~on (P,, and R, 9 to 15 g C m-? d-') were within the range previously reported for reef flats, a n d community net calcification (G; 19 to 25 g CaCO, m-2 d.') was higher than the 'standard' range. T h e molar ratio of organlc to inorganic carbon uptake was 6 : l for both sites. The reef flat at hdoorea displayed a higher rate of organic production and a lower rate of calcification compared to previous measurements carried out during austral summer. The approximate uncertainty of the daily metabolic parameters was estimated using a procedure based on a Monte Carlo simulation. The standard errors of P,, R and R,IR expressed as a percentage of the mean are lower than 3 % but are colnparat~vely larger for E, the excess production (6 to 78'1;,). The daily air-sea CO? flux (F,-,,,) was positive throughout the field experiments, indicating that thc reef flats at Moorea and Yonge Reef released CO2 to the atmosphere at the time of measurement. F,-,,, decreased as a function of increasing dally Irradiance
KEY WORDS: Coral reefs Pr~mary production . Respiration - Calc~fication . Air-sea CO, flux. Light
INTRODUCTION
The biological processes controlling the CO2 partial pressure in seawater ( p C 0 2 ) a n d , consequently, the air-sea C O 2 fluxes a r e net organic production a n d calcification, which have opposite effects on p C 0 2 . Coccolithophorid blooms and coral reefs a r e the major marine photosynthetic a n d calcifying systems and are, therefore, well suited to studies of the interactive
'E-mail: gattuso@naxos.unice.fr
"Present address: Un~versiti. de Liege, Mecanique des F l u ~ d e s Geophysiques, Unite d'oceanographie Chimique, Institut d e Physique (B5). 8-4000 Sart Tilman, Belglum
effects of photosynthesis-respiration a n d precipita- tion-dissolution of calcium carbonate on the seawater CO2 system a n d air-sea CO2 fluxes. Coccolithophorid blooms a r e transient (Holligan et al. 1993), annually cover on average 14 X 105 k m 2 of the world's oceans (Brown & Yoder 1994) a n d have been shown to behave as sources for atmospheric CO, (Robertson et al. 1994). Coral reefs a r e permanent, long-lived ecosystems cov- ering 6 X 10⁵ km2 (Smith 1978a). There is a rather large set of data on reef community lnetabolism (Kinsey 1985, Smith 1995) but very few estimates of air-sea CO2 fluxes in coral reefs (Gattuso e t al. 1993). In most reefs investigated, gross primary production (Pg) a n d respiration (R) a r e nearly balanced (P,/R = 1) a n d net O Inter-Research 1996
110 Mar Ecol Prog Ser 145 109-121, 1996
community production IS close to 0 Net calcificat~on (G) IS, therefore the main process a f f e c t ~ n g the sea- water CO, system
Ware et a1 (1992) p r o v ~ d e d n u m e ~ i c a l evidence on the effect of calcification on the seawater Inorganic carbon system a n d suggested that coral reefs a r e slight sources of CO, to the atmosphere Smith (1995) pro- posed that the net air-sea transfer of CO2 In complete reef systems is less than + 4 to 5 m01 m - 1 r
'
Gattuso et a1 (1995) described a model which enables the estima- tion of the effect of photosynthetic and calcifl rng sys- tems of air-sea CO, fluxes from average values of Pg, R a n d G They predicted that 'standard reef flats a n d complete reef systems can be expected to cause CO, evasion to the atmosphere The sign~flcance of this predlctlon for complete reef systems is unclear d u e the lack of confidence intervals for P,, R a n d G (Gattuso et a1 1995) Information on the v a r ~ a b ~ l i t y of daily meta- bolic parameters is cr~tical, for example, to compare metabolic performances between reefs but is also missing for individual sites d u e to the lack of a n appro- priate technique to estimate them The prediction that reef flats release CO, to the atmosphere seems robust a n d is confirmed by the only existing data on air-sea CO, flux which showed that a barrler reef flat a t Moorea (French Polynesia) was a s l ~ g h t source of CO, during austral summer 1991 (Gattuso et a1 1993)Several recent studies suggest, however, that reefs may be sinks for atmospheric CO2 d u e to a h ~ g h net pnmary production (Kayanne et a1 1995, Yamamuro et a1 1995, Krames et a1 In press) Whlle concerns have been expressed about the techniques used In some of these studies, including the limlted data set a n d the representativity of the study sites (Smlth 1995, Gattuso et a1 19961, as well as about the long-term Inconsis- tency of this suggestion (Buddemeler 19961, it IS not surprising that some lndivtdual reefs or some of thelr components (see Hatcher 1988) depart from the g e n - eral trend (low net prlmary production)
Previous measurements of community metabolism a n d air-sea CO, flux (Gattuso et a1 1993) were carried out durlng a single season (austral summer) in a single local~ty (Tlahura Barrier Reef Moorea) There is clearly a need to complement these data both on tem- poral a n d spatial scales Indeed the seasonal pattern of reef metabolism in French Polynesia (Payri 1987) and elsewhere (see Kinsey 1985) is leported to be very strong a n d may result in important changes in the cy- cling of carbon A d d ~ t ~ o n a l l y the Tiahura reef system is subject to a relatively Intense human Impact (Wolanskl et a1 1993) whlch may lead to a n increase in commu- nlty net production a n d a decrease In net calcif~cation compared with more p r ~ s t l n e reefs (Klnsey 1988)
The aim of the present study is to Investigate (1) the effect of reef metabolism on the lnorgarlic carbon
system during summer and ~ v i n t e r at Moorea, (2) site- specif~c differences by comparing the metabolic per- formances at Moorea and Yonge Reef (Great B a r r ~ e r Reef, subject to little human Impact) a n d (3) the air-sea CO2 d i s e q u ~ l i b r ~ u m resulting from reef metabolism We also attempted to derlve a p r o c e d u ~ e enabllng estl- mation of the robustness of the daily metabolic para- meters derived from L a g ~ a n g l a n measurements of community pi eduction, r esp~ration and calclficat~on The present paper focuses on community metabolism issues (Lagrangian approach) while the dynamics of the Inorganic carbon system (Eulerian approach) 1s presented In a companion paper (Frank~gnoulle et a1 1996 in this issue)
MATERIAL A N D METHODS
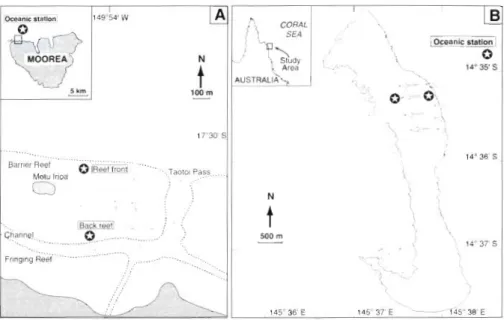
Geographical framework. The reef at Moorea (17" 29' S, 149" 54' W) formed around a volcanic Island (Flg 1A) The reef is comparatively narrow at the study site a n d oceanic water flows across it to a drainage channel. I t is exposed to typically oceanic waters on its seaward slde and ~ t s landward fringe is affected by terrlgenous influence and anthropogenic pressure d u e to the proximity of the island (Wolanski et al. 1993). The tidal range IS 1 0 . 5 m and the annual variation of the sea surface temperature is 1 7 ° C (Galzin & Pointier 1985)
Yonge Reef (14" 35' S , 145" 37' E ) , ~n the northern half of the Great Barrier Reef (GBR), grows on the mar- gin of the contlnental shelf (Flg 1B) I t is a barrier reef with the typical 'ribbon' morphology of shelf e d g e coral reefs and has a well developed reef flat. It is sep- arated a n d isolated from the Australian contlnental landmass by the GBR lagoon, which in that area is -50 km wide. The tidal range 1s 1 3 m and the annual variation of the sea surface temperature IS 56°C ( M . Pichon unpubl. obs.).
Community composition. Quantitative information on the structure and z o n a t ~ o n of benthic reef commu- nities were obtained by the use of the line transect method (e.g. Loya 1972, P ~ c h o n & Morrissey 1.981) Lines parallel to the reef front were surveyed for coral species compos~tion and cover (Yonge Reef), a n d for corals and other benthic components (turf, fleshy and coralline algae, rubble and sediment) at Moorea Length of ind~vidual line transects was 30 m at Yonge Reef a n d 50 m at Moorea.
Community productivity and calcification. Field
experiments: Community metabolism was measured
in flowing water (Marsh & Smith 1.978, Smith 1978b) using a Lagrangian flow respirometry technique (Barnes 1983, Barnes & Devereux 1984). Field experi- ments took place In July and August 1992 at Moorea
Gattuso et al.. Carbon fluxes in coral reefs. I. Lagrangian approach
Fig. 1 Locations of the study sites
a n d in December 1993 a t Yonge Reef. Changes in the chemistry of the water flowing from the reef front to the back reef were monitored during transect experi- ments by a surface-drifting instrument package (buoy). Transects (n = 12 a t Moorea a n d n = 15 a t Yonge Reef) were carried out under a wide range of average irradiance in air (0 to 1900 pm01 photons m-, S-'). Both the oxygen and CO2 techniques were used (Marsh & Smith 1978) The buoy carried 4 sensors: a galvanic oxygen sensor (Kent), a p H electrode (Radiometer, GK 2401C), a thermistor (Analog Devices, AC 2626 K4) and a quantum l ~ g h t sensor (Li- Cor, LI-192SA). T h e pH electrode was pressure-com- pensated (see Chisholm et al. 1990). Sensors were interrogated every second a n d average data w e r e stored every 10 S during the transects. The buoy was tracked down every minute from the upstream station. Duplicate seawater samples w e r e taken a t the begin- ning a n d e n d of each transect for later determination of total alkalinity. Incident irradiance was measured onshore (Moorea) or o n a mast at the back reef site (Yonge Reef) throughout the field experiments using a n LI-192SA quantum sensor, averaged a n d logged every minute on an LI-1000 datalogger.
Calibration o f sensors: The oxygen sensor a n d pH electrode were calibrated daily. The oxygen sensor was calibrated against air-saturated seawater a n d a saturated solution of sodium dithionite (zero oxygen). The pH electrode was calibrated against National Bureau of Standards (NBS) buffers: pH 6.865 a n d 7.413 a t 37°C (Radiometer). Calibration had been checked against the seawater scale (SWS; Dickson 1993) on some occasions. The pH of a TRIS buffer (Bates 1982) was typically overestimated by 0.006 pH units using the NBS scale.
Total alkalinity: Seawater for total alkalinity (TA) determination was filtered immediately after sampling on Whatman GF/C membranes a n d stored in BOD bot- tles in darkness at 4 to 10°C pending analysis. TA was measured a s described by Gattuso et al. (1993). Accu- racy against pure carbonate standard solutions was 0.1'K-, ( 2 Fieq kg-') a n d the average precision (2 X SD/mean) was 0.16 % .
Data processing: Back in the laboratory, raw data stored in the buoy w e r e dumped a n d converted to absolute pH, 02, temperature a n d light values. Calcifi- cation and partitioning of organic a n d inorganic car- bon metabolisms were estimated using the alkalinity anomaly technique (Smith & Key 1975). T h e contribu- tion of nutrients to changes in total alkalinity was neg- ligible at Yonge Reef since there w e r e no or very small changes in nutrient concentrations during the tran- sects (data not shown). Since it is likely that a similar situation prevailed a t Moorea, fluxes of total alkalinity were not corrected for changes in ions other than those of the carbonate system.
Net primary production a n d calcification during each transect w e r e calculated a s follows:
ADICpz
P n e t (CO2 =
At - g + fco, ATA pz
g = 2 A t
where p,,, is net primary production (in terms of O2 or CO,) in mm01 m-* h-' a n d p,,, = r, the community res-
112 Mar Ecol Prog Ser 145: 109-121, 1996
piration at night; g is calcification in mm01 C a C 0 3 m
'
h-'; A 0 2 is change in dissolved oxygen concentration (pm01 kg-') estimated by regressing [02] versus time; p is seawater density in k g m-:' (Millero & Poisson 1981);z is depth (m); At is duration of transect (h); fo2 and fCOl a r e air-sea
O2
a n d CO2 fluxes (mmol m-2 h-') during transect estimated as described by Gattuso et al. (1993); ADIC is change in total dissolved inorganic carbon (mmol kg-'); and ATA is change in total alkalin- ity (meq kg-').By convention, small letters refer to instantaneous and hourly fluxes (fCO2, p, r, g) while capital letters
(FCOZ, Pg, R, G) refer to fluxes integrated over the day, night or 24 h . Absolute values of Pg/R a r e reported throughout the paper. pn,,(02) and p,,,.,(CO,] were used to compute the respiratory quotient at night [ R Q = Ip,,,(CO2)/pner(O2)1] and the net photosynthetic quo- tient during the day [PQ,,[ = Ip,,,(O2)lp,,,(CO2)J The net productivity data measured around the compensa- tion irradiance were excluded from the computation of average PQ,,,. True P Q was computed as described by Gattuso & Jaubert (1988) for plant-animal symbiotic units. Calcification rates were expressed a s negative values and rates of dissolution of C a C 0 3 as positive values.
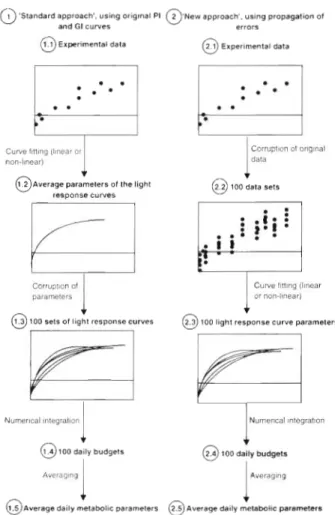
Computation o f light response curve parameters: The light response curve parameters, i.e. the produc- tivity- and calcification-irradiance (P-I and G-I) curves, were calculated using 2 different approaches (Fig. 2). The first approach is similar to that used by previous investigators (e.g Barnes & Devereux 1984, Gattuso et al. 1993). Functions were fitted to the light response curves of net primary production (p,,,, in terms of O2 and CO2) and calcification (g) using linear or non-linear curve fitting (JMP 3.0 for Macintosh, SAS Institute Inc., or MacCurveFit 1.1). The comparison of the parameters of the light response curves is difficult when different functions are used for different sites. However, as the overriding consideration was to get the best estimates of the daily metabolic budgets, we nevertheless decided to select the funct~ons providing the best fits. The exponential function ( y = a [ l - exp(-x/b)j
+
c] and the hyperbolic tangent function [ y = a tanh(-x/b)+
c] produced the best fits for P - l curves of, respectively, Moorea and Yonge Reef. The G - l curves were modelled using a n exponential function at Moorea a n d a linear function for Yonge Reef. The curve fitting procedure returns average parameters t asymptotic standard error (non-linear curve fitting) or+ standard error (linear curve fitting).
In the second approach, a Monte Carlo simulation was applied to the rates of net primary production (p,,,, in terms of O2 and CO2) and calcification ( g ) mea- sured during each transect using their standard errors as derived by taking into account the errors of each
'Standard approach', using origlnal PI 2 'New approach'. u s ~ n g propagation 01
Q
and GI curves0
errors0
Experimental data @ E x p e r l m e n l a l data4 @ 100 data sets
Corruplmn al
I
I
Culw llnlng Illna%rparameters or nmllnear)
0
l 0 0 sets 01 light responsecurves 100 light response curve parametersl I
0 1 0 0 daily budgets
0
roo daily4
bu-8 Averag~ngI
1
Averaging@/\wrage daily metabolic parameters
0
2.5 Average daily metabolic parametersFig. 2. Two procedures adopted in this paper to estimate the uncertainty of daily metabolic parameters
variable used to compute p,,, and g (Eqs. 1 to 3 ) . Stan- dard errors were calculated using data shown in Table 1 and standard error propagation formulae given by Gans (1992). The experimental data points of the P-I and G-I curves were corrupted using a random n.umber generator (Excel 5.0) in order to produce 100
Table 1. Errors used to estimate the standard errors of daily metabolic parameters. Errors are reported a s a percentage of the mean (SD/mean) or as an absolute value. (1) A 0 2 was computed using the standard deviation of the regression line of oxygen concentration versus time; (2) the exact errors for
fo, and fc.02 are unknown and were arbitrarily set to 30%
I
Vanable Error SourceI
~0~ (pm01 kg-') 1-1 1% (1)
DIC (pm01 kg-') 0 . 6 X j Dickson & Riley (1978) TA W ¶ kg-') 0.08% Gattuso et al. (1993) Density (kg m-3) 3.66 X 10⁻² Millero & Poisson (1981)
Depth. (m) 0.1
Au-sea O2 flux 30'%, (2) Air-sea COz flux 30'); (2)
Gattuso et al.: Carbon fluxes in coral reefs. I. Lagranglan approach 113
data sets for each curve. The corrupted data sets were normally distributed with a mean equal to the experi- mental data point and a standard deviation calculated as described above. The curve fitting procedure was then applied to the 100 data sets, returning 100 P-I and G - l curve parameters which were averaged.
Computation of daily metabolic budgets: The daily
metabolic parameters, such as gross primary production (P,), respiration (R) and calcification (G), were estimated by integrating the P-I and G-Icurves derived from the 2 approaches described above with respect to the diurnal changes of irradiance in air. Both field and modelled die1 light curves were used. The theoretical light data were obtained using a sine function (Chalker & Dunlap 1983) based on the average times of the beginning (Moorea 06:07 h; Yonge Reef 05:lO h) and end (Moorea 18:08 h; Yonge Reef 19:10 h) of the light record. These times are close to the times of morning and afternoon civil twilights used by Chalker & Dunlap (1983). The average maxi- mum surface irradiance measured during the field ex- periments was 1795 and 2256 pm01 m-2 S-', respectively, at Moorea and Yonge Reef.
The parameters of the P-I and G-I curves obtained using the first approach (see 'Computation of light re- sponse curve parameters') (Fig. 2) were corrupted using a random number generator (Excel 5.0) in order to produce 100 sets of P-I and G-I curves. The cor- rupted data sets were normally distributed with mean and standard deviation equal, respectively, to the aver- age parameter and asymptotic standard error returned by the curve fitting procedure. 100 daily metabolic budgets were constructed from the 100 P - l and G-I curves. Similarly, the 100 sets of P-I and G - I parame- ters derived from the second approach were used to produce 100 daily metabolic budgets.
P,, R and G were used to estimate the daily air-sea CO2 flux resulting from reef metabolic processes as described by Gattuso et al. (1995).
Statistics. Statistical testing was carried out using JMP 3.0 for Macintosh computers (SAS Institute Inc.). Homoscedasticity was checked prior to the use of analysis of variance (ANOVA). The Welsh procedure (W-ANOVA) was used when the condition of variance homogeneity was not met.
RESULTS
Community composition a n d physiographic features At Moorea (Tiahura), the number of coral specles is close to 80. The part of the reef flat over which the buoy drifted is composed of 2 benthic con~munities: a seaward community where corals are dominant and macrophytes are either absent or in moderate abun-
dance (0 to 8 % ) and a second community developed closer to the drainage channel (back reef) with very few corals (1 to 2 % ) and abundant macrophytes, prin- cipally Turbinaria ornata and Sargassum spp. (12 to 38%). Coralline algae were slightly more abundant in the back reef community (9 to 21%) than in the sea- ward community (4 to 17 %).
At Yonge Reef, close to 200 coral species have been recorded overall a n d the percentage substratum cover by corals can be > 6 0 % on the upper slopes a n d on parts of the reef flat. The metabolic experiments were conducted across a single community characterized by dominance of Acropora palifera. Overall, coral cover increased regularly from the algal pavement seaward of the A. palifera zone (3 % ) to the A. grandis commu- nity lagoonward (43 %). Average coral cover in the A. palifera (experiment) zone was 30%. Although no quantitative data are available, the abundance of coralline algae decreased significantly from the outer algal pavement (where it is almost 100%) to the A. grandis community. The tall phaeophytes Turbinaria and Sargassum were conspicuously absent.
Oceanic parameters
Seawater parameters measured in the ocean, approximately 1 mile (1.6 km) off the reef front, a r e shown in Table 2. Temperature and dissolved oxygen concentration were similar at both sites but pH and total alkalinity were higher at Moorea than at Yonge Reef, which resulted in a lower oceanic CO2 partial pressure at Moorea than at Yonge Reef (326 vs 349 patm).
Transect experiments: primary productivity and calcification
The transects were run under similar conditions a t both study sites. The average seawater temperature was slightly higher than 27°C and the average depths at Moorea and Yonge Reef were, respectively, 1.3 and 1.7 m. Transects were longer a t Yonge Reef than at Table 2. Oceanic parameters at Yonge Reef and Moorea.
Mean + SE. Sample sizes are shown in parentheses Moorea 1992 Yonge Reef 1993
~ Temperature ("C) 27.1 t 0.1 (6) 27.2 (1) O2 (pm01 kg-') 210 t 2 (6) 208 (1) PH 8.262 + 0.002 (6) 8.235 (1) TA (meq kg-') 2.378 r 0.003 (7) 2.334
+
0.003 (3) p c 0 2 (patm) 326 t 2 (6) 349 (1)Mar Ecol Prog Ser
Moorea (463 vs 382 m) and were completed in less time (0.33 vs 0.71 h) due to higher current velocity. Wind speed never exceeded 11 m S-' and was, on average, 2 m S-' higher at Yonge Reef than at Moorea.
The starting values for transects at Moorea and Yonge Reef were as follows (mean
*
SE; n = 12 at Moorea and n = 15 at Yonge Reef): dissolved oxygen, 217 r 2 and 218 r 2 pm01 k g - ' ; pH, 8.277 r 0.003 and 8.241*
0.002; TA. 2.367 +- 0.002 and 2.329 +- 0.001 meq kg-'Seawater temperature increased slightly during transects carried out during the day and decreased slightly at night. The range of temperature variation was -0.1 to +0.4'C. Other parameters changed within the following ranges: O,, -13 to + 3 9 pm01 kg-'; pH, -0.019 to +0.048; TA, -0.001 to +0.020.
Metabolic quotients
The average respiratory quotient (RQ) was 0.9 * 0.2 at Moorea (mean
+
SE; n = 2) and 0.8*
0.1 at Yonge Reef (n = 3). It was significantly lower than 1 (p = 0.04) at Yonge Reef. PQ,,, was 1*
0.1 at Moorea (n = 5) and 1.1 0.1 a t Yonge Reef (n = 10); it was not significantly different from 1 ( p > 0.25). True PQ was not signifl-cantly different at Moorea (1.07 * 0.06; n = 10) or Yonge Reef (1.08
+
0.03; n = 12).Productivity- a n d calcification-irradiance curves The analysis of propagation of errors for data col- lected at Yonge Reef revealed that the average stan- dard deviation of net productivity (0, and CO2) and calcification rates expressed as a percentage of the mean were ~ ' Y o (6 to 24 X ) , 20% (9 to 41 % ) and 109% (15 to 449%), respectively.
The parameter estimates of the light response curves (P-I a n d G-I) obtained from curve-fitting of the original data sets and of the 100 data sets derived from the Monte Carlo simulation differed on average by ap- proximately 2 % . The asymptotic standard errors given by the non-linear curve fitting routines correspond to the square root of the diagonal of the covariance ma- trix and represented therefore the standard deviation of the parameters (Zimmerman et al. 1987). Asymptotic error vanances were, on average, 1.4 times higher with the non-linear cu.rve fitting procedure than with the Monte Carlo simulation. We chose to report the asymp- totic standard errors in order to enable comparisons with results previously published.
All functions fitted to the experimental productiv- ity-irradiance (P-I) data provided similar values of r2, all of them higher than 0.9 (data not shown). The func- tion displaying the lowest range of asymptotic stan-
30 1001) MW l DPO m 1 W Moorea 92
g
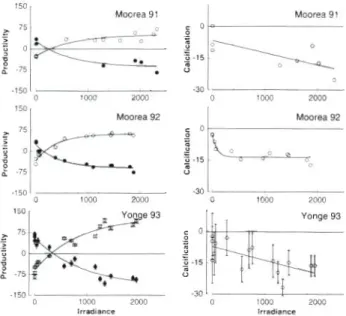
as 0 loop 2000 loo0 2000 Irradiance IrradianceFig. 3. Community photosynthesis- and calcification-irradi- ance curves. Net primary productivity in mm01 O2 m-' h-' (0) or mm01 CO2 m-' h-' (a); calcification in mm01 CaCO, m'? h-'; incident irradiance in pm01 photons m'* h-' Light response curves for Moorea in summer 1991 are from Gattuso et al. (1993). Error bars shown for Yonge Reef were derived by the propagation of error approach (see text) and are
*
1 SE. Calci- fication rates are expressed as negative values and rates ofdissolution of CaCO, as positive values
dard error was selected for each site (exponential func- tion a t Moorea and hyperbolic tangent function at
Yonge Reef). The absolute values of the P-I curve
parameters obtained by the 0, and the CO2 techniques were not significantly different, and the light response
curves displayed similar shapes (Fig. 3). The maximum
gross productivity [p,,, (CO2)] was higher at Yonge
Reef than at Moorea (158 vs 90 mm01 m-2 S-') but the
saturation part of the P-I curve was not reached at
Yonge Reef (Fig. 3). The rate of dark respiration
[ r ( C 0 2 ) ] was also higher at Yonge Reef than at Moorea (-53 vs -31 mm01 m-2 ss') and
Ik
(the incidence at which the inital linear portion of the curve interceptsthe saturation plateau) was 3 times higher at Yonge
Reef than at Moorea.
There was no net reef dissolution, even at night, at
either site. The magnitude of net calcification was sim-
ilar at Moorea and Yonge Reef but data were noisier at the latter site (Fig 3). An exponential function was fit- ted to the calcification-irradiance (G-I) curve obtained
at Moorea (r2 = 0.86) whereas a linear function was used at Yonge Reef (r2 = 0.45).
Daily metabolic budgets
In accordance with earlier procedures (Gattuso et al. 1993), the sign of the daily metabolic parameters
Gattuso et al.: Carbon fluxes in coral reefs. I. Lagrangian approach 115
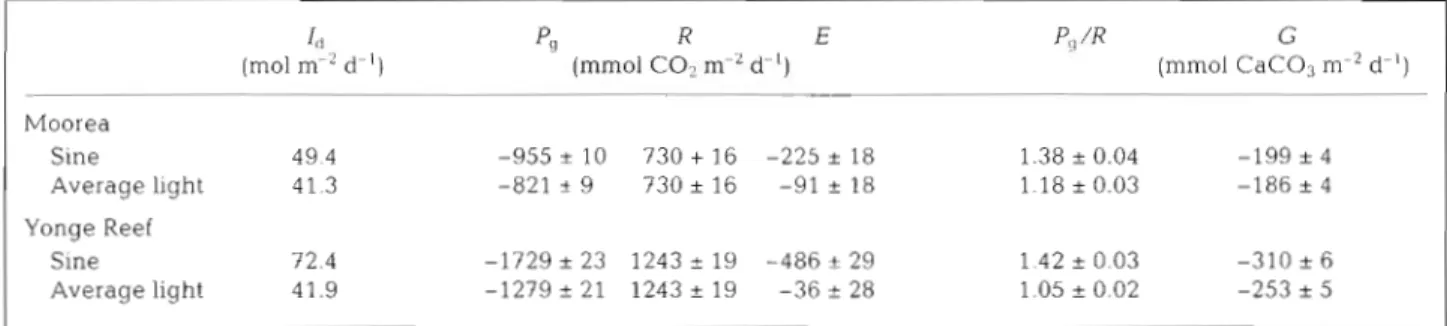
Table 3 . Comparison of daily irradiance (Id) and daily metabolic parameters (CO2 technique) obtained using a daily light curve modelled by a sine function and a n average light curve computed from measured light data. Pg: gross prlmary production; R: 24 h respiration; E: excess production; G: net calcification. e,/R: absolute and dimensionless values. Mean
*
SE obtained from aMontc Carlo simulation
1, pg R E p!, /R G
(mol m-' d-') (mmol CO1. m-' d-l) (mmol C a C 0 3 m-2 d-') Moorea Sine 49.4 - 9 5 5 + 1 0 7 3 0 + 1 6 - 2 2 5 t 18 1.38 5 0.04 -199 i 4 Average light 41.3 -821
+
9 730 5 16 -91 ? 18 1.18 i 0.03 -186 i 4 Yonge Reef Sine 72.4 - 1 7 2 9 k 2 3 1243*
19 - 4 8 6 + 2 9 1.42 5 0.03 -310 i 6 Average light 41.9 - 1 2 7 9 k 2 1 1 2 4 3 5 1 9 - 3 6 r 2 8 1.05 5 0.02 -253 i 5Table 4. Observed and simulated daily irradiance (I,; m01 photons m-2 d-l) d u r ~ n g the least cloudy days that occurred during the field experiments at Moorea and Yonge Reef Data from Aqaba (Jordan) were collected during a cloud-free day (M. Marchioretti unpubl. data). Overestimation of the
observed irradiance is shown in parentheses Moorea Yonge Reef Aqaba Date 20 Jul 1992 7 Dec 1993 19 May 1995
l,, (observed) 4 1 50 54
Id ( ~ 1 ~ 1 1 t ~ l l l g h t ~ ) 47 (+15?:t) 61 [+22 " c , ) 63 ( + l 7 %)
Id (sunnse-sunset) 44 (+7",.) 58 ( + 1 6 " ~ ~ ) 59 ( + g o u ) Id (from sin p) 44 ( + 7 % ) 57 ( + 1 4 % ) 57 ( + 6 % )
expressed in molar units is shown in Table 3 but absolute values are reported in the text and/or when using weight units. All parameters related to the organic metabolism were computed using net primary productivity measured according to the CO, tech- nique.
Estimates of the daily metabolic parameters obtained from the original data sets and from the 100 data sets derived from the Monte Carlo simulation differed by less than 3 % . Estimates reported in this section are those derived from the latter procedure. Integration of the photosynthesis-irradiance curves provided good consistency between the oxygen and carbon dioxide techniques. The average gross production (P,) and daily respiration (R) obtained by both methods differed by less than 15 % a n d the P,/R ratios were very similar (data not shown). The standard errors of P,, R and G, expressed as a percentage of the mean, were typically lower than 2 % . The standard error was also relatively low for Pg/R (< 3 %) but comparatively larger for E, the excess (= net) production (6 to 78 %).
Daily surface irradiance was 41.3
+
0.8 m01 m-' d-' at Moorea (n = 7) and 41.9+
2.4 m01 m-, d-' at Yonge Reef (n = 9 ) . The diel light curve is not adequately modelled by a sine function which overestimates the irradianceby a factor of 1.3 at local solar noon and by a factor of 2 to 1000 during the early morning (05:lO to 09:OO h) and late afternoon (16:30 to 19:09 h) a t Yonge Reef. Conse- quently, the average simulated daily irradiance ob- tained using a sine model overestimates the measured daily irradiance by 20 to 73 % (Table 4). As a result, Pg and G and Pg/R are also overestimated when using a modelled diel light curve. All daily metabolic parame- ters were therefore computed using measured light data.
P, and C both increased as a function of daily irradi- ance (Id) but G increased at a slower rate than P,. As a result, P,/R increased and G/P, decreased as a func- tlon of increasing daily irradiance (Fig. 4 ) .
The metabolism of organic carbon was significantly higher a t Yonge Reef than at Moorea (t-test, p < 0.001). P, and R were approximately 40% higher at Yonge Reef than at Moorea (1279 vs 821 and 1243 vs 730 mm01 CO2 m-2 d-l). The average excess production (E) was similar at both sites (W-ANOVA; p = 0.09). It was significantly lower than 0 a t Moorea (p < 0.001) but was not statistically different from 0 at Yonge Reef (p = 0.20). The Pg/R ratio was significantly higher at
I
0.7 0 0
30 40 50
Daily irradiance (rnol d-')
Fig. 4 . P,/R (0, a) and G / P 0 , W ) ratios at Moorea (open sym- g. (
bols) and Yonge Reef [sohd symbols) as a function of daily irl-ad1an~e.P~: dally gross primary production; R : daily respi-
116 Mar Ecol Prog Ser 145: 109-121, 1996 5
7
- 1 6 /' 'i 0 . Photosynthesis-
, Dissolution-
-
-5 . 'm 1g
- t o5
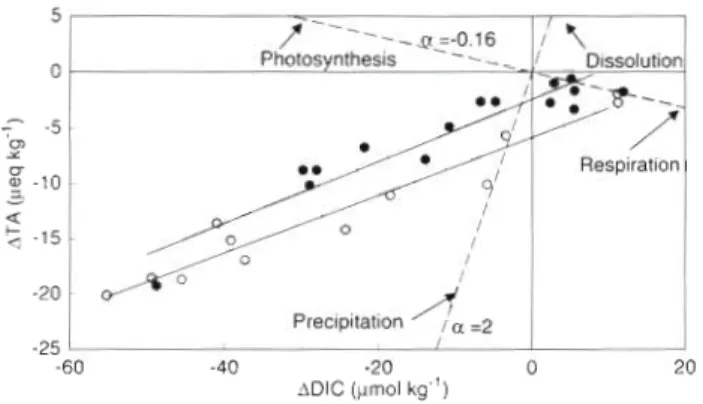
-15 - I - - -60 -40 -20 0 20 ADIC (pmol kg-') -20 -25Fig. 5. Changes in total alkalinity (ATA) as a function of changes in dissolved inorganic carbon (ADIC) during the transect experiments at Moorea ( 0 ) and Yonge Reef ( 0 ) . Functional regression lines are shown with a solid line. Dashed pattern shows the theoretical relationships when photosynthesls-respiration or precipitation/dissolution of cal- cium carbonate are the sole processes taking place (see text).
a: slopes of the theroretical relationships
- I
/f
Precipitation l a =2- I
Moorea than at Yonge Reef (1.18 vs 1.05; W-ANOVA, p = 0.002) a n d both were significantly higher than 1 ( t -
test, p < 0.01).
The net calcification during the day was 4 times higher than at night at Moorea (150 vs 36 mm01 m-') and 2.5 times higher at Yonge Reef (181 vs 72 mm01 m-'). The average daily calcification was significantly higher a t Yonge Reet than at Moorea (253 vs 186 mm01 m-2 d- l
1.
The changes in TA and DIC were significantly corre- lated a t Moorea and Yonge Reef (Fig. 5). Functional regression was used instead of predictive regression because both variables were subject to experimental error (see Jacques & Pilson 1980). The regression lines, with ATA in peq kg-' and ADIC in pm01 kg-', were Moorea: ATA = -5.81
+
0.27ADIC (r2 = 0.94, n = 12) Yonge Reef: ATA = -3.96 + 0.28ADIC ( r 2 = 0.88, n = 15) Since 1 m01 of CaCO, is precipitated when TA decreases by 2 equivalents, the contribution of inor- ganic carbon metabolism on instantaneous changes in DIC were, respectively, 13 and 14%, a t Moorea a n d Yonge Reef.+ 47 mm01 m-' d-l, respectively, at Moorea and Yonge -
Reef. Both estimates were significantly higher than 0 (t-test, p < 0.04) and their difference was statistically significant (W-ANOVA, p = 0.02).
DISCUSSION
Our results provide an estimate of the uncertainty associated with metabolic parameters as well as infor- mation on seasonal and geographic differences of metabolic performances of 2 Pacific reef flats. They also provide, along with a companion paper (Frankig- noulle et al. 1996), further evidence that coral reef flats a r e sources of CO2 for the atmosphere.
Net primary productivity was measured by both the O2 and CO2 techniques and this enabled estimation of the photosynthetic (PQ,,,) a n d respiratory quotients (RQ). These quotients are useful to express productiv- ity data measured by the 0, technique in terms of CO2 and a r e required to estimate calcification when using the pH-O2 technique (Barnes 1983). Their interrela- tionship is also important because they are related to the concepts of autotrophy and heterotrophy (Barnes 1983). The average PQneI at Moorea and Yonge Reef a r e in good agreement with the data set published by Kinsey (1979) suggesting that PQ,,, is in the range of 1.0 to 1.1 in reef flats dominated by corals and c o r a l h e algae. However, we found average RQs lower than 1, and the generally assumed relationship, according to which PQ&: = RQ = 1 (see Barnes 1983), was not valid. Barnes (1983) showed that estimates of community metabolism obtained by the pH-O2 technique were rel- atively robust to the set of metabolic quotients, but we suggest that care should be exercised when using empirically derived metabolic quotients. All daily metabolic parameters reported in the present paper were computed using the net primary productivity measured according to the CO2 technique.
Air-sea CO2 disequilibrium
The daily air-sea CO2 flux resulting from reef meta-
bolic processes (FCo2) was positive (i.e. CO2 evasion)
throughout the field experiments and declined as a "
-
30 40 50
function of ~ncreasing daily irradiance from 114 to
Daily irradiance (mol
m-2 d.')
0 mm01 CO2 m-2 d-l at Moorea and from 366 to52 mm01 CO2 m-2 d-' at Yonge Reef (Fig. 6). The aver- Fig. 6 . Estimated air-sea CO2 fluxes at Moorea (0) and Yonga a g e FCoz d.uring our experiments were 31 ? 15 and 182 Reef ( 0 ) as a function of daily ~rradiance
Gattuso et al.. Carbon fluxes in coral reefs. I. Lagrangian approach 117
In our first approach, to provide confidence intervals for daily metabolic parameters, a Monte Carlo simula- tion was applied to the rates of net primary production (p,,,) and calcification (g) measured during each tran- sect using their standard errors as derived by taking into account the errors of each variable used to com- pute the p,,, and g. The resulting 100 P-I and C-I curves were then numerically integrated using a daily light curve. Such a technique is sensitive to the set of errors used, and some of the errors we used are proba- bly underestimated. For example, Dickson & Riley (1978) reported that DIC conlputed from pH and total alkalinity is known to within 0.6 % but, since the uncer- tainty on pH measurements is higher in the field than in the laboratory, it is likely that the standard error of DIC was higher than 0.6 % in the present study.
In the second approach, the Monte Carlo procedure is applied to the parameters of the P-I and G-I curves, using the standard error or the asymptotic standard error predicted by the curve fitting routine. We sug- gest, however, that confidence intervals obtained with this technique are relatively conservative since the asymptotic errors variances were 1.4 times higher with the non-linear curve fitting than with the 'propagation of error' approach. The results show that the confi- dence intervals of the 'primary' daily metabolic para- meters and for P,/R are narrow but that they are com- paratively larger for E, the excess production.
We found that simulated light data grossly overesti- mated the average daily irradiance at Moorea and Yonge Reef and, in turn, overestimated community gross production a n d calcification. Daily metabolic performances of algae (e.g. Zimmerman et al. 1994), symbiotic organisms (e.g. Chalker & Dunlap 1983) and reef flats (e.g. Barnes & Devereux 1984, Gattuso et al. 1993) are often computed by nun~erically integrating photosynthesis-irradiance curves using simulated solar radiation. Such a procedure provides metabolic esti- mates on a cloudless day and enables comparison of data collected under varying cloud cover. Solar surface radiation is simulated assuming that the daily variation of irradiance follows a sine function between the beginning of the morning civil twilight and the end of evening civil twilight (civil twilight is the interval dur- ing which the sun is between the horizon and 6" below the horizon; Chalker & Dunlap 1983, Barnes & Dev- ereux 1984), or during the period when irradiance is different from zero (this study), and by setting the max- imum irradiance at noon to a measured value. Other authors (e.g. Zimmerman et al. 1994) have assumed that the daily variation of irradiance follows a sine function between sunrise and sunset.
Surface irradiance data collected during the least cloudy days that occurred during measurements of reef community metabolism at Moorea and Yonge Reef
are not well described when using the times of civil twilights (Table 4). The simulated data always over- estimate the measured irradiance and, as a result, the daily irradiance is overestimated by 15 to 22 %. Calcu- lating daylength using the times of sunrise and sunset instead of the times of the civil twilights significantly decreases the simulated daily irradiance which re- mains nevertheless higher than the measured daily irradiance. The discrepancy between sim.ulated and observed data are partly due to a combination of 2 fac- tors. Firstly, the maximum irradiance required in the modelling function is poorly known. Maximum irradi- ance data are crltical since any error on peak irradi- ance is carried over the whole daily light curve. In the present study, it was estimated by averaging all peak irradiances measured during the field trips. However, due to ship motion, light reflections and/or focussing effects on the edges of clouds (D. J. Barnes & B. E. Chalker pers, comm.), some very high values (up to 2470 pm01 m-' S-') were recorded, which resulted in unrealistically high maximum irradiances. Secondly, cloudy periods occurred at Yonge Reef and the sine function, as expected, did not properly mimic real light curves and led to a n overestimation larger than at Moorea. Measurements took place during a nearly cloudless day at Moorea but simulation still overesti- mates the observed daily irradiance by 15%. Similar calculations carried out with data collected a t Aqaba (Jordan; 29" 30' N, 35" E; M. Marchioretti unpubl. data) during a n absolutely cloud-free day provide sim- ilar results, suggesting that the simulation procedure may not be appropriate.
Kirk (1994) has provided a detailed analysis of the diurnal variation of solar irradiance. Irradiance of a horizontal surface due to direct solar radiation is pro- portional to the cosine of the solar zenith angle and to the sine of the solar elevation
( P )
Therefore, solar irra- diance varies over a 24 h period in a similar fashion a s sinp,
except that its value is zero a t night. The varia- tion of sinp
is sinusoidal with respect to time measured within a 24 h cycle (from 00:OO h) but not with respect to daylight hours. The increased atmospheric path- length early in the morning and late in the afternoon results in an increased attenuation (although partly offset by a greater contribution from skylight) which has the effect of making the diurnal variation of irradi- ance approximately sinusoidal with respect to daylight hours (Kirk 1994).Our data show that simulation of daily irradiance using the diurnal variation of sin P provides better esti- mates, with overestimation down to 6 %, of daily irradi- ance on a cloudless day than the other procedures (Table 4).
The use of simulated irradiance data has the useful advantage of enabling comparison of daily metabolic
118 Mar Ecol Prog Ser 145: 109-121, 1996
budgets of organisms and communities irrespective of the cloud cover. It has, however, some drawbacks w h e n cloudy passages occur during metabolic mea- surements. Firstly, it makes the implicit assumption that the relationship between productivity a n d irradi- ance observed on cloudy days can b e used to predict productivity a t high irradiances. Secondly, it can b e difficult to estimate the maximum irradiance at local solar noon. Additionally, d ~ u r n a l changes in irradiance a r e not adequately simulated by a sine curve between t h e times of sunrise a n d sunset or the times of the civil twilights. It is suggested that the use of a sine curve with respect to hours from 00:OO h (using the variation of sin
p)
or the use of real light data should b e pre- ferred.Community gross primary production a n d respira- tion a t both study sites (9 to 15 g C m-' d-') a r e higher than the rates reported by Kinsey (1983, 1985) for ' s t a n d a r d ' reef flats (Pg = R = 7
*
1 g C m-' d.') but remain within t h e range that h e reported (4 to 19 g C m-' d-l). Net calcification (19 to 25 g C a C 0 3 m-' d-') was also higher than Kinsey's 'standard' range (8 to 14 g C a C 0 3 m-2 d-'). T h e latter result could be explained by the relatively high abundance of the major calcifying organisms (corals a n d calcareous algae).T h e r e w a s a marked effect of the period of measure- ment a n d site on the metabolic performances of the 2 reefs investigated. The barrier reef at Moorea dis- played a higher rate of organic production a n d a lower rate of calcification i n winter (this study) compared with measurements carried out during the previous summer (Gattuso e t al. 1993). The ratios between the summer a n d winter values a r e 0.8 for P, a n d 1.3 for G. Kinsey (1985) reviewed the effect of seasonality o n reef community metabolism; data available at that time showed that, in every reef investigated, the gross pri- mary production, respiration a n d net calcification w e r e approximately twice as high in summer than in winter. Barnes (1988) subsequently reported similar findings at
Davies Reef (GBR), except for R, which was slightly lower in summer than In winter. The seasonality of community metabolism of the Moorea ('Tiahura') bar- rier reef flat has been studied extensively by Payn (1987). In 1984 and 1985,Pg a n d R w e r e 1.5 times higher in summer than in winter a n d G was 2.5 times greater. Our observation of a decrease in G between summer 1991 and winter 1992 is therefore consistent with the behaviour of all reefs previously investigated, but the increase in P, and R from summer to winter is not.
There is some hope that metabolic parameters may be used as an indication of reef health (Ruddemeier 1996). The barrier reef flat a t Moorea could be a good site to test such a hypothesis since its community meta- bolism has been investigated on several occasions dur- ing the past 15 yr (Table 5). During this time span, the reef was subject to various stresses, such a s infestation of the starfish Acanthasterplanci (Faure 1989), bleach- ing (Salvat 1992), cyclone (Delesalle e t al. 1993, Harmelin-Vivien 1994) a n d , poss~bly, eutrophication (Wolanski e t al. 1993), which have led to changes in the benthic communi.ties (Bouchon 1985, Galzin et al. 1993, D. H. Augustin unpubl. data). Overall, P,, R a n d G a r e variable but net calcification seems relatively higher in the more recent measurements (Table 5 ) . Part of the variability is d u e to the effect of seasonality (see above) but also to different experimental proce- dures. The early studies (Sournia e t al. 1981, Pichon 1985, Payri 1987) used the slack-water technique, whereas the latest ones used the flow respirometry technique. Both approaches relate to spatially different areas: the metabolic parameters obtained by the for- mer technique relate to a limited area of a few square metres, whereas the latter integrates a much greater surface area, typically of the order of several hundred square meters. I t 1s therefore still difficult to correlate the long-term changes in metabolic performances with the health status of the Tiahura Barrier Reef.
Net calcification at Yonge Reef (summer) was higher than a t Moorea (winter; 25.3 vs 18.6 g C a C 0 3 m-' d-l),
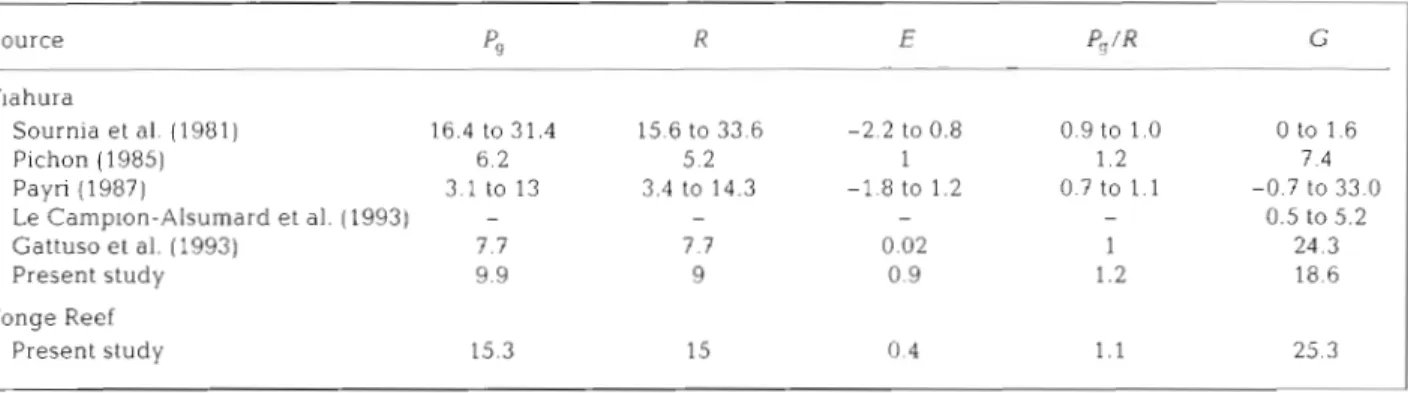
Table 5. P u b l ~ s h e d values of community metabolism at Tiahura a n d Yonge Reef. P,,: gross primary production; R: 24 h respiration; E: excess production. G. net calcification P,, R, E: g C m-' d-l; G. g CaCO, m-' d.'; P,IR: absolute a n d dimenslonless values
Source PS R E P,/R G Tlahura Sournia et al. (1981) 16.4 to 31.4 15.6 to 33.6 -2.2 to 0.8 0 to 1.6 Pichon (1985) 6.2 5.2 1 7.4 Payri (1987) 3 1 to 13 3.4 to 14.3 -1.8 to 1.2 -0.7 to 33.0 Le Camplon-Alsumard et al. (1993) - - - 0.5 to 5.2 Gattuso e t al. (1993) 7.7 7.7 0.02 24.3 Present study 9.9 9 0.9 18.6 Yonge Reef Present study 15.3 15 0.4 1.1 25.3
Gattuso e t a l . : Carbon fluxes in coral reefs. 1. Lagrangian approach 119
but this may be d u e to seasonality rather than to geo- graphic or community structure differences since there is nearly no difference in net calcification between Yonge Reef a n d Moorea in summer (24.3 g CaCO, m-2 d-l for Moorea in summer; Gattuso et al. 1993). Sum- mer values of
Pg
and R displayed, however, a 2-fold difference between Yonge Reef and Moorea which can be explained by the comparatively higher biomass (in particular of primary producers) at the former site.The contribution of planktonic primary production to the productivity of the Tiahura reef system was low in austral winter (B. Delesalle unpubl. data) a n d similar to the contribution estimated by Gattuso e t al. (1993) in austral summer (0.04 vs 0.15 O u ) .
There is a tight coupling between changes In total alkalinity and dissolved inorganic carbon (DIC), and net calcification contributes to ca 14'% of changes in DIC both at Moorea a n d Yonge Reef. Since net com- munity calcification a n d production CO-vary a s a func- tion of irradiance, this contribution should b e relatively similar during the day a n d night. However, d u e to the small number of nighttime data available (53) a n d their relatively high scatter, it is not clear whether this contribution is constant. Frankignoulle et al. (1996) obtained similar results using independent measure- ments and a different approach. They estimated that the contribution of net calcification to changes In DIC a r e 27 a n d 1 9 % ) at Moorea a n d Yonge Reef, respec- tively. Additionally, their data confirm that this contri- bution is constant throughout a diel cycle.
These data can b e used to estimate the molar ratio of organic to inorganic carbon uptake. Our approach gives a ratio of 6 : l (0.86:0.14) for both sites, a n d that of Frankignoulle e t al. (1996) gives a ratio of 3:l a n d 4:1, respectively, at Moorea a n d Yonge Reef There a r e few estimates of such ratlos in photosynthetic and calcify- ing planktonic ecosystems and none in benthlc ecosys- tems. Robertson et al. (1994) reported a ratio of 1.1 in the northeast Atlantic coccolithophorid bloom. As could b e expected, this ratio increases (6:l) when the northeast Atlantic phytoplanktonic community be- comes depleted in calcifying coccolithophores a n d dominated by diatoms (Robertson et al. 1994) a n d is also high in systems displaying weak C a C O , produc- tion, such a s the equatorial Pacific (Archer et al. 1996). It can be concluded that the short-term effect of cal- cium carbonate precipitation on the inorganic carbon system is comparatively lower in coral reef flats than In actively calcifying transient planktonic communities. The long-term effect of calcification by these perma- nent ecosystems is, however, likely to be significant.
Reef metabolic processes cause shifts in the inor- ganic carbon system leading to changes in the magni- tude a n d direction of the p C 0 2 gradient between sea- water a n d the atmosphere. Such disequilibrium drives
air-sea CO2 exchange to restore previous initial (oceanic) conditions. The daily air-sea CO2 flux (FCo2) can b e estimated from community metabolism data (Lagrangian approach) but continuous irradiance should preferably be used to derive community meta- bolic data. The decrease of FC02 as a function of increasing irradiance results from a combination of 2 factors. Firstly, there is a differential response of pro- ductivity and calcification to incident light. At Yonge Reef, where the most important changes in daily irra- diance (Id) were observed, P, increased by a factor of
1.4 a s a function of increasing Id while G increased by a factor of 1.1 only. Secondly, the effect of changes in the balance between P,, a n d R on FCO2 is comparatively larger than the effect of calcification (Gattuso et al. 1995). Consequently, the increase of CO2 uptake by photosynthesis is higher than the increase In C O 2 release by calcification. FCo2 was significantly higher than 0; we therefore conclude that both sites w e r e sources of CO, to the atmosphere a t t h e time of mea- surement.
The daily air-sea C O 2 fluxes were also estimated in a companion study using a different technique based on a Eulerian approach during 3 die1 cycles (Frankig- noulle et al. 1996) The direction of the fluxes obtained by both techniques a r e in agreement (COz evasion) but there is a discrepancy in their magnitude. Our esti- mates of F,,, are higher than those reported by Frankignoulle et al. (1996) by 1 to 2 orders of magni- tude: 31 versus 1.8 mm01 m-' d-' a t Moorea a n d 182 versus 5.1 mm01 m - 2 d-' a t Yonge Reef. Several considerations could explain such a large difference.
Firstly, both techniques involve a number of assump- tions which a r e likely to result in some uncertainty of the estimates. For example, the Eulerian approach assumes that (3.) there is no change in oceanic p C 0 2 during and between the diel cycles and (2) that the daily water flow is similar for the 3 diel cycles. Sec- ondly, the 2 studles do not refer to the same communi- ties (Lagrangian vs Eulerian techniques) a n d d o not encompass the s a m e reef a r e a : the zone located between the ocean a n d the starting point of the tran- sects is not taken into account by the Lagrangian approach, whereas it is included in the estimate based o n the Eulerian technique. It is therefore difficult at this stage to estimate precisely the magnitude of the CO2 evasion Both techniques, however, show that the CO2 release I S higher at Yonge Reef than at Moorea. The conirnunlty metabolism data suggest that this is d u e to a higher uptake of CO2 by net photosynthesis a n d a lower release of CO2 by net calcification a t Moorea.
Gattuso et al. (1993) showed that the reef flat a t Moorea was a source of CO2 to the atmosphere during austral summer 1991 using direct measurements of
120 Mar Ecol Prog Ser 145: 109-121, 1996
Calcification/Gross primary production
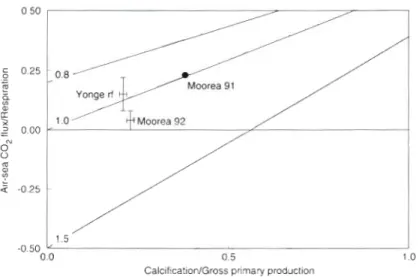
Fig. 7. Estimates of the ratio of air-sea CO2 flux versus community respi-
ration ( F C + / R ) as a function of G/Pg. Data for Moorea 1991 are from Gat-
tuso et al. (1993). Error bars are 95% confidence limits. Solid lines indi-
cate the model output for the following P,/R rdt~os: 0.8, 1.0 dnd 1.5
(see Gattuso et al. 1995)
Acknowledgements. Assistance in the field was
provlded by J . Algret. I. Bourge, Y. Chancerelle, E.
Coutures and A. Salih, as well as by the Master and crew of the RV 'Lady Basten' Thanks are due
to C. Bussi for data processing, J. Clavier and F
Ibanez for helpful d~scussion on Monte Carlo sim-
ulation~, and F. Teanlniuraitemoana for help w ~ t h
positioning the stations at hloorea, as well a s the workshop and analytical sc,rvices staffs of the Aus-
tralian Institute of Marine S c ~ e n c e for helpful as-
sistance. We also thank J. T 0. Kirk for revlewing an early note on the simulation of solar radiation,
M. Marchioretti for providing irradiance data from
Aqaba and M. Devereux for his help in gathering data from the Nautical Almanac. D. Barnes, B.
Chalker, S. V Smith and an anonymous referee
provlded helpful comments on a n earlier draft of the manuscript. This work was supported by grants from Centre National d e la Recherche Sci- entifique (Sciences d e la Vie-INSU), Centre S c ~ e n - tifique de Monaco, Australian Institute of Marine Science, Council of Europe, Socikte Natlonale Elf-Aquitaine. Programme National Recifs Coral- liens (PNRCO], Australian Department of Industry and Technoloav and Commerce and FNRS [Bel-
air-sea CO2 fluxes. This conclusion was subsequently confirmed by a model using community metabolism data (Gattuso et al. 1995; Fig. 7) which also suggested
that a n average coral reef flat was a source of CO2. The present results confirm and extend our previous con- clusion on a temporal scale, using wintertime measure- ments at Moorea, a n d on a spatial scale on a reef
subject to little human impact (Yonge Reef). It also pro- vides evidence that the estimations of air-sea CO2
fluxes a r e statistically robust since their confidence intervals do not include Fco2/R = 0 (Fig. 7 ) . As already pointed out (Gattuso et al. 1995, 1996, Smith 1995), this conclusion does not rule out the possibility that some reefs, or some physiographic zones within a coral reef, display a different role with respect to atmospheric
CO2. For example, Barnes & Lazar (1993) measured the metabolic performance of a high latitude reef patch
of the Gulf of Aqaba using techniques similar to
ours. They reported daily metabolic parameters
(Pg
= 384 mm01 m-' d-'; R = 240 mm01 m-2 d-' and G =163 mm01 m-2 d-l) suggesting that this site was a sink
for atmospheric CO2 in March 1990 (Fco2 = -46 mm01
m-2 d - I ), probably as a result of an extensive epilithic
algal community. The strong relationship between daily irradiance and FCOZ suggests that Moorea and
Yonge Reef might display a transient sink-like behav-
iour when they receive full solar irradiance. This con-
clusion would only be valid if the light response curves under such conditions a r e similar to those measured under sub-optimal light conditions a n d if no saturation phase or photoinhibition occur. This could only be
demonstrated through long-term (at least 1 yr) mea- surements of community metabolism.
-.
gium), with which M.F. is a research associate This 1s a contribution of PNRCO.
LITERATURE CITED
Archer DE, Takahashi T. Sutherland S, Goddard J , Chipman D, Rodgers K , Ogura H (1996) Daily, seasonal, and inter- annual var~ability of sea surface carbon and nutrient con- centration in the Equatorial Pacific Ocean. Deep Sea Res 43:779-808
Barnes DJ (1983) Profiling coral reef productivity and calcifi- cation using pH and oxygen electrodes. J Exp Mar Biol Ec0166:149-161
Barnes DJ (1988) Seasonallty in community productivity and calcification at Davies Reef, Central Great Barrier Reef. Proc 6th Int Syrnp Coral Reef 2:521-527
Barnes DJ, Devereux MJ (1984) Productivity and calcification on a coral reef. a survey using pH and oxygen electrode techniques. J Exp Mar Biol Ecol79:213-231
Barnes DJ, Lazar B (1993) Metabolic performance of a shal- low reef patch near Eilat on the Red Sea. J Exp Mar Biol ECOI 174:l-13
Bates RG (1982) pH measurements in the manne envlron- ment. Pure Appl Chem 54:229-232
Bouchon C (1985) Quantitative studies of scleractinian com- mun~ties of T ~ a h u r a reef (Moorea, French Polynesia) Proc 5th Int Coral Reef Congr 6:279-284
Brown CW, Yoder JA (1994) Coccolithophorid blooms in the global ocean. J Geophys Res 99:7467-7482
Buddemeier RW (1996) Coral reefs and carbon dioxide. Sci- ence 271:1298-1299
Chalker RE, Dunlap WC (1983) Primary production and pho- toadaptation by corals on the Great Barrier Reef. Proc Inaugural Great Barrier Reef Conf, p 293-298
Chisholm JRM, Co1,lingwood J C , Gill EF (1990) A novel in situ respirometer for investigating photosynthesis and calc~flca- tionin crustose c o r a h e algae. J Exp Mar Biol Ecol141:15-29 Delesalle B, Pichon M , Frankignoulle M, Gattuso JP (1993)
Effects of a cyclone on coral reef phytoplankton biomass, primary production and composition (Moorea Island, French Polynesia). J Plankton Res 15:1413-1423
Gattuso et al.. Carbon fluxes in coral reefs I Lagrangian approach 12 1
Dickson AG (1993) pH buffers for seawater media based on the total hydrogen ion concentration scale. Deep Sea Res 40:107-118
Dickson AG. Riley J P (1978) T h e effect of analytical error on the evaluation of the components of the aquatic carbon- dioxide system. Mar Chem 6:77-85
Faure G (1989) Degradation of coral reefs a t Moorea Island (French Polynesia) by Acanthasterplanci. J Coastal Res 5 . 295-305
Frankignoulle M , Gattuso JP, Biondo R, Bourge I, Copin- Montegut G, Pichon M (1996) Carbon fluxes in coral reefs.
11. Eulerian study of inorganic carbon dynamics and r n ~ \ a -
surement of air-sea CO, exchanges. Mar Ecol Prog Ser 145:123-132
Galzin R, Marfin JP, Salvat B (1993) Long term coral reef mon- itoring program: heterogeneity of the Tiahura barrier reef (Moorea, French Polynesia). Gdlaxea 11:73-91
Galzin R, Pointier J P (1985) Moorea Island, Society Archipel- ago. Proc 5th Int Coral Reef Congr 1:73-102
Gans P (1992) Data fitting in the chemical sciences by the method of least squares. John Wiley, Chichester
Gattuso JP, Frankignoulle M, Smith SV, Ware JR, Wollast R (1996) Coral reefs and carbon dioxide. Science 271:1298 Gattuso JP, Jaubert J (1988) Computation of metabolic quo-
tients in plant-animal symbiotic units. J Theor Biol 130: 205-212
Gattuso JP. Pichon M. Delesalle B, Frankignoulle M (1993) Community metabolism and air-sea CO2 fluxes in a coral reef ecosystem (Moorea, French Polynesia). Mar Ecol Prog Ser 96 259-267
Gattuso JP, Pichon M. Frank~gnoulle M (1995) Biological control of alr-sea CO2 fluxes: effect of photosynthetic and calcifying marlne organisms and ecosystems. Mar Ecol Prog Scr 129:307-312
Harmelin-Vivlen ML (1994) The effect of storms and cyclones on coral reefs a review. J Coastal Res (Special Issue) 12 211-231
Hatcher BG (1988) Coral reef primary productivity: a beggar's banquet. TREE 3:106-111
Holligan PM, Fernandez E, Aiken J , Balch WM. Boyd P, Burkill PH, Finch M, Groom SB, Malin G , Muller K, Purdie DA, Robinson C. Trees CC, Turner SM, van der Wal P (1993) A biogeochemical study of the coccolithophore, En~iliania h u x l e y ~ in the North Atlantic. Global Biogeo- chem Cycles 7:879-900
Jacques TG. Pilson MEQ (1980) Experimental ecology of the temperate scleractinian coral Astangia danae. l. Partition of respiration, phtosynthesis a n d calcification between host and symbionts. Mar Biol 60:167-178
Kayanne H , S u z u k ~ A , Saito H (1995) Diurnal changes in the partial pressure of carbon dioxide in coral reef water. Sci- ence 269 214-216
Kinsey DW (1979) Carbon turnover and accumulation by coral reefs PhD d~ssertation, University of Hawaii, Hon- olulu
Kinsey D\Y (1983) Standards of performance in coral reef primary production and turnover In: Barnes DJ (ed) Per- spectives on coral reefs. Australian lnstitute of Marine Science, Townsville, p 209-220
Kinsey DW (1985) Metabolism, calcification and carbon pro- duction. 1. System level studies. Proc 5th Int Coral Reefs Congr 4505-526
Kinsey DW (1988) Coral reef system response to some natural and anthropogenic stresses. Galaxea 7 :113-128
Kirk JTO (1994) Light and photosynthesis in aquatic ecosys- tems. Cambridge University Press, Cambridge
Kraines SB, Suzuki Y . Yamada K, Komiyama H (in press) This article rvas submitted to the editor
Separating biological and physical changes in dissolved oxygen concentration in a coral reef. Limnol Oceanogr Le Campion-Alsumard T, Romano JC. Peyrot-Clausade M.
Le Campion J , Paul R (1993) Influence of some coral reef communities on the calcium carbonate budget of Tiahura reef (Moorea, French Polynesia). Mar Biol 115685-693 Loya Y (1972) Community structure a n d species diversity of
hermatypic corals at Eilat, Red Sea A4ar Biol 13:lOO-123 Marsh JA Jr, Smith SV (1978) Productivity measurements of coral reefs in flowing water In: Stoddart DR, Johannes RE (eds) Coral reefs research methods. UNESCO. Paris, p 361-378
Millei-o FJ, Poisson A (1981) International one-atmosphere equation of state of seawater. Deep Sea Res 28 625-629 P a y r ~ CE (1987) Variabilite spatiale et temporelle d e la com-
munaute des macrophytes des recifs coralliens d e hlloorea (Polynesie franqaise). Contribution des algues a u metabo- lisme du carbone d e I'ecosysteme recifal. These d e Doc- torat d'Etat, Universite des Sciences e t Techniques du Languedoc, Montpellier
Pichon M (1985) Organic production and calcification in some coral reefs of French Polynesia. Proc 5th Int Coral Reef Congr 6:173-177
Pichon M. Morrissey J (1981) Benthic zonation a n d commu- nity structure of South Island Reef, Lizard Island (Great Barrier Reef). Bull Mar Sci 3581-593
Robertson J E , Robinson C , Turner DR, Holligan P, Watson AJ, Boyd P. Fernandez E, Finch M (1994) The impact of a coc- colithophore bloom on oceanic carbon uptake In the northeast Atlantic during summer 1991 Deep Sea Res 41: 297-314
Salvat B (1992) Blanchissement et mortalite des madrepo- raires sur les recifs de Moorea (Iles d e la Societe) C R Acad Sci Pans Ser 111 314105-111
Smlth SV (1978a) Coral-reef drea a n d the contnbutlons of reefs to processes and resources of the world's oceans. Nature 273:225-226
Smith SV (197813) Alkalinity depletion to estimate the calcifi- cation of coral reefs in flowing waters. In: Stoddard DR, Johannes RE (eds) Coral reefs: research methods. UNESCO, Paris, p 397-404
Smith SV (1995) Reflections on the measurement and signifi- cance of carbon metabolism on coralreefs. Kansas Geolog- ical Survey, Open-File Report 95-56a, Lawrence, p 1-18 Smith SV, Key G S (1975) Carbon dioxide a n d metabolism in
marine environments. Limnol Oceanogr 20.493-495 Sournia A. Delesalle B, Ricard M (1981) Premlers bllans d e
production organique et d e calcification d'un recif bar- n e r e d e la Polynesie Franqaise. Ocean01 Acta 4.423-431 Ware JR, Smith SV, Reaka-Kudla ML (1992) Coral reefs:
sources or sinks of atmospheric CO2? Coral Reefs 11. 127-130
Wolanski E, Delesalle B, Dufour V, Aubanel A (1993) Model- ing the fate of pollutants in the Tiahura lagoon, Moorea, French Polynesia. Proc 11th Australasian Conf Coastal Ocean Engineering, p 583-589
Yamamuro M, Kayanne H, Minagawa M (1995) Carbon and nitrogen stables isotopes of primary producers in coral reef ecosystems. Limnol Oceanogr 40:617-621
Zimmerman RC, Cabello-Pasini A, Alberte RS (1994) Model- ing daily production of aquatic macrophytes from irradi- ance measurements: a comparative analysis. Mar Ecol Prog Ser 114:185-196
Zimmerman RC, SooHoo JB, Kremer J N , D'Argenio DZ (1987) Evaluation of variance approximation techniques for non-linear photosynthesis-irradiance models Mar B101 95:209-215
Man script first received: D e c e n ~ ber 15, 1995 R e v ~ s e d version accepted: October 2, 1996