1
Evolution of Basel Regulation:
Impact on European Banks
Alexandre CHARPENTIER
Master Thesis
Majeure Finance 2013 – 2014
2
Acknowledgments
I would like to thank all the people who helped me to achieve my work, by reading it and
making comments that improved its quality, by providing me with many documents and
references that helped me studying the subject in more depth.
I want to thank more specifically:
Patrick Legland, my advisor during this master thesis, for his valuable advice,
elaborate guidance and strong support, either in terms of bibliography or re-reading,
Jacques Olivier for being in charge of HEC Majeure Finance, which implies
tremendous amount of work to build and run such a program.
3
Contents
In
troduction……….. 5Section A: History of regulation
I.
Basel I – The birth of regulation
... 7i. Basel Committee ... 7
ii. Cooke ratio ... 7
iii. Impact on banking strategy ... 9
iv. From Basel I to Basel II ... 11
II.
Basel II
... 13i. Basel II – First Pillar – Minimum Capital Requirement ... 13
ii. Basel II – Second Pillar – Supervisory Review Process ... 17
iii. Basel II – Third Pillar – Market Discipline ... 18
iv. Implementation of Basel II ... 19
v. Role of Basel II in the financial crisis ... 19
III. Basel III ... 21
i. Strengthening the capital base ... 21
ii. Leverage ratio ... 23
4
Section B: Application of Basel III by European Banks
I. European Banking Association’s study on Basel III implementation on European banks ... 32
i. Impact of Basel III on capital ratios ... 33
ii. Impact of Basel III on leverage ratio ... 35
iii. Impact of Basel III on liquidity ratio ... 37
II. Focus on specific European banks ... 38
III. HSBC Case study ... 40
i. HSBC at a glance ... 40
ii. HSBC regulatory disclosure ... 40
IV. Deutsche Bank Case study ... 44
i. Deutsche Bank at a glance... 44
ii. Deutsche Bank regulatory disclosure ... 44
V. BNP Paribas Case study ... 47
i. BNP Paribas at a glance ... 47
ii. BNP Paribas regulatory disclosure ... 47
VI. BBVA Case study ... 50
i. BBVA at a glance ... 50
ii. BBVA regulatory disclosure ... 50
Conclusion..
………... 545
Introduction
The financial system recently experienced one of its biggest crisis, which impacted much more than the financial world. Many discussions occurred to determine who had to be blamed for this. Among the actors that are criticized, regulators played a critical role. The purpose of this work is not at all to draw a list of criticisms towards a player or another but rather to understand how the regulator reacted to this crisis. Indeed, one easy example concerns liquidity. Regulators learnt from the crisis that capital requirements are not sufficient in order to regulate the financial system (some would argue that it is not only insufficient but also dangerous as it has pro-cyclical effects).
Consequently, the purpose of this paper is to focus on the changes of the regulation that occurred post crisis with the change from Basel II to Basel III. However, in order to understand how the regulation evolved, we chose to start back from the beginning of the financial regulation with Basel I. Indeed, the regulation is continuously evolving but it has a starting point. Then it tries to evolve at the same rhythm as the financial system does.
While Basel I was mainly focusing on credit risk for banks with capital requirements associated to specific risk weighted assets, Basel II had to adapt to changes of finance illustrated by the expansion of financial markets. Indeed, when Basel I only took into account credit risk, it became clear in 2000’s that other types of risks had to be added, such as market risk or operational risk. Another major change from Basel I to Basel II consisted in the adoption of internal models of banks to realize their own risk assessment. Only a few years later, those models proved being inefficient during the recent financial crisis and the need for regulators to include leverage and liquidity among the regulated fields became obvious. All of this led to the birth of Basel III.
The evolution of the regulation will thus be discussed, but we will also focus on the impact on banks. Indeed, a change in regulation implies adaptation and sometimes changes in the business model. Thus, the second part of this paper will be about a case study led on 4 European banks about the way they reacted to the change to Basel III.
6
Section A:
7
I.
Basel I – The birth of regulation
i.
Basel Committee
Basel Committee was founded in 1975 by the central bank governors of the G10 countries in response to disruptions in the international finance market, illustrated by the Herstatt crisis. In June 1974, German bank Herstatt was withdrawn its license after facing severe losses on its foreign exchange operations (losses of DM 470m for a bank with DM 2bn assets). Indeed, the bank chose to bet on the appreciation of dollar, but dollar started to depreciate early 1974. By that time, the foreign exchange risk was 3 times as large as the amount of its capital. The end of the Bretton Woods System in 1973 is one cause of this crisis. Under this system, exchange rates were fixed, meaning that activities of foreign trade payments carried little risk. Management of the bank probably underestimated risks carried in free-floating currencies.
Few months later, Peter Cooke suggested creating a committee of central banks, which became the Basel Committee. Now renamed Basel Committee on Banking Supervision (BCBS), it was designed as a forum to provide ideas on how to enhance financial stability by improving the quality of banking supervision. The Committee has been expanded to 27 countries since 2009. Each country is represented by its central bank and the relevant local authority for the prudential supervision of banking industry.
ii.
Cooke ratio
The first decision of the Basel Committee came in 1988 under the name of Basel I. The goal was to prevent international banks from taking positions without adequate capital backing. These capital requirements were calculated by taking into account the risks associated with each specific asset. Assets were divided in categories, each of them being given a specific risk weight. Table 1 depicts the split of assets among those categories as it was defined in the official publication of Basel I1:
8
RISK WEIGHT TYPE OF ASSETS
0%
• Cash,
• Claims on central governments and central banks denominated in national currency and funded in that currency
• Claims on OECD, central governments and central banks
• Claims collateralized by cash of OECD central-government securities or guaranteed by OECD central Governments
20%
• Claims on multilateral development banks and claims guaranteed by or collateralized by securities issued by such banks
• Claims on banks incorporated in the OECD and claims guaranteed by OECD incorporated banks
• Claims on, or guaranteed by, banks incorporated in countries outside the OECD with residual maturity of up to one year
• Claims on non-domestic OECD public-sector entities, excluding central government, and claims guaranteed by or collateralized by securities issued by such entities
• Cash items in the process of collection
50% • Loans fully securitized by mortgage on residential property that is or will
be occupied by the borrower or that is rented.
100%
• Claims on the private sector
• Claims on banks incorporated outside the OECD with residual maturity of over one year
• Claims on central governments outside the OECD (unless denominated and funded in national currency)
• Claims on commercial companies owned by the public sector • Premises, plant and equipment, and other fixed assets • Real estate and other investments
• Capital instruments issued by other banks (unless deducted from capital) • All other assets
Table 1 Risk-weight categories in Basel I
It is interesting to observe that claims on sovereigns were considered riskless (0% risk weight). There were no distinctions between countries to assess this risk, only the fact of being a country was sufficient. Even with the evolution of the regulation, this point has not really changed and the question of sovereign remains tricky to address for regulators.
9 In addition to defining risk weighted assets, Basel I also defines capital requirement or more accurately which the constituents of capital are. “The Committee considers that the key element of capital on which the main emphasis should be placed is equity capital and disclosed reserves. This key element of capital is the only element common to all countries’ banking systems”2, says the official text of Basel I. It thus constitutes core capital or tier 1 capital. “The Committee has therefore concluded that capital, for supervisory purposes, should be defined in two tiers in a way which will have the effect of requiring at least 50% of a bank’s capital base to consist of a core element comprised of equity capital and published reserves from post-tax retained earnings (tier 1). The other elements of capital (supplementary capital) will be admitted into tier 2 up to an amount equal to that of the core capital”.
This tier 2 capital is made of: Undisclosed reserves; Asset revaluation reserves; General provisions/general loan-loss reserves; Hybrid (debt/equity) capital instruments; Subordinated debt. However, each of these elements can be accepted or not by the national regulators at their discretion and depending on the national accounting standards.
Based on those definitions of capital and risk weighted assets, the Basel Committee was able to fix the minimum capital requirement level. Indeed banks had to have a ratio of capital to risk weighted assets, the Cooke ratio, at least equal to 8% (of which the core capital has to represent at least 4%).
Figure 1 Cooke ratio
The Committee stated that this 8% level was “consistent with the objective of securing over time soundly-based and consistent capital ratios for all international banks”
iii.
Impact on banking strategy
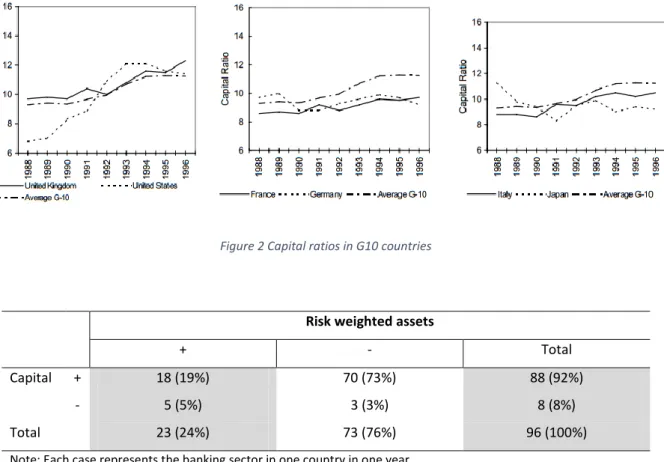
On a publication of April 993, the Basel Committee assessing the impact on bank behavior of Basel I noted that: “Since the introduction of the Basle Accord in 1988, the risk-based capital ratios in developed economies have increased significantly. *…+ The charts [Figure 2] show an increasing trend with the industry average capital ratio rising from 9.3% in 1988 to 11.2% in 1996. Most countries experienced increases in their capital ratios although those countries which were close to, or below,
2
(Basle Committee on Banking Supervision 1988)
10 the Basle minimum capital adequacy ratio of 8% in 1988 evidenced a much higher overall increase than those which had historically high capital ratios”.
This study also focuses on the actions banks chose to implement in order to match the required 8%. Indeed, the Cooke ratio can be impacting both assets and capital. Figure 3 summarizes the main outputs of the study. A (+) and a (–) refers to the impact on the capital ratio. Thus, a (–) in risk weighted assets means that risk weighted assets contributed to a decrease in capital ratio, i.e. risk weighted assets increased. In 73% of cases over the period covered, banks chose to both increase capital and risk weighted assets. In total, 92% of banks chose to increase their capital level. However, the study also points out discrepancies between countries, mainly due to the economic situation.
Figure 2 Capital ratios in G10 countries
Risk weighted assets
+ - Total
Capital + 18 (19%) 70 (73%) 88 (92%)
- 5 (5%) 3 (3%) 8 (8%)
Total 23 (24%) 73 (76%) 96 (100%)
Note: Each case represents the banking sector in one country in one year
Source: Calculations by De Nederlandsche Bank based on data obtained from the Basle Committee, FitchIBCA or national supervisory authorities
Figure 3 Number of cases where changes in capital and risk-weighted assets contributed positively (+) or negatively (-) to the change in capital ratio
For instance, a study led by the French regulator4 (Commission Bancaire as it was called by the time of the study) showed that between 1988 and 1989, based on a sample of 16 French banks, equity
11 increased by 14%. Among this increase, core capital increased by 14.8% and supplementary capital by 7.1%. However, this study is also more specific on how banks chose to adapt on the asset-side. First of all, banks started using regulation at their advantage by choosing assets for which the internal risk assessment differed from the regulator’s one. Indeed, a riskier asset will theoretically yield a higher return. Thus regulatory arbitrage becomes an option by choosing among a given risk-weight category the riskiest assets, meaning that banks try to maximize their return for the same amount of capital. For instance, though claims on banks incorporated in the OECD are given a 20% risk-weight, some of them can be riskier given the own risk of the country providing banks with opportunities to better remunerate their capital.
Besides, another important consequence for banks of the Basel I concerned the development of the market activity. Indeed, the Cooke ratio refers to credit risk but no other type of risks. There was no capital requirements for positions on capital markets which were generating either market risk or exchange risk. Thus according to another study led by the French regulator5, between 1988 and 1990, for French banks, most of the increase of the banking activity occurred in off-balance sheet activities related to interest rates or exchange rates. Over this period, the relative weight of those activities went from 34.2% to 44.5% of the total assets.
The last issue that appeared concerning the choice banks made to adapt to Basel I is related to macro economy. Indeed, when banks are capital constrained, fixing a minimum capital requirement can lead banks to cut credits. This point has been discussed a lot by economists but no clear evidence was found that Basel I created a credit crunch. For instance, the IMF launched a survey on the impact of Basel I on the credit slowdown in Latin America6, whose conclusion is: “Our results give only weak evidence of a Basel-induced credit crunch in Latin America. Overall, we do not find evidence that the loan supply curve shifted on average after Basel, but we do find some evidence of risk retrenchment, as loan growth became more sensitive to the lagged equity-asset ratio.”
iv.
From Basel I to Basel II
In addition to the apparition of Basel I, which was the first international regulation for banks, the last two decades of the 20th century was an area of deep changes for the financial system. Indeed the 80’s is a time of globalization, which impacts the bond markets. Before that date, retail investors,
5
(Commission Bancaire April 1991)
12 foreign investors or mutual funds were not very active on the financial markets. We can quote an article of Daniel Fuss in 2001: Fixed Income Management: Past, Present And Future. According to him the bond market had experienced more development and innovation in the last twenty years of the 20th century than in any years before. It can be illustrated by the introduction of new assets such as asset backed securities, high yield securities or derivatives. This period is also characterized by the emergence of disintermediation.
As an example, in France, reforms are undertaken starting in 1984 to unify financial markets and monetary markets in order to rule an anti-inflation policy. New derivatives markets appear from 1986 to 1988. In addition the law of 1984 puts a term to the specialization of French banks and authorizes them to commercialize different services. All of this led to a quick increase of the financial markets which can also be illustrated by the Internet bubble at the end of the 90’s. This trend will continue up to the beginning of the 2000’s.
Investment banks evolved alongside to financial markets. Indeed, new products were available for sale such as derivatives, high yield and structured products. The internet bubble also implied lots of IPO in the 90’s. In 1999, 548 IPO deals were done which is among the most ever in a single year. Besides, in the US, the Gramm-Steagall Act was repealed. It has prohibited banks from taking deposits and underwriting securities since its introduction in 1933.
This period of evolution of the financial system goes with changes in the nature of risks associated. Market risk for instance becomes a real matter of concern for banks in this period. Counterparty risk and operational risk arose as well. Banks thus had to deal with a wider variety of risks.
Alongside of these evolutions, changes in the regulation became necessary to adapt. Indeed, with such a development of financial markets, could the capital requirements continue to focus only on credit risk? As a consequence, 7 years after Basel I accords, Basel Committee published their “Planned Supplement to the Capital Accord to incorporate Market Risks”7. Basel II was on the track.
13
II.
Basel II
In June 2004, the BIS publishes: “International Convergence of Capital Measurement and Capital standards: A Revised Framework”8. This revised framework is more known as the Basel II accords. It includes elements from the Basel I accords9 in addition to elements of the 1996 Amendment to the Capital Accord to Incorporate Market Risks10. When it was first announced in 2001, William McDonough, Chairman of the Basel Committee and President and Chief Executive Officer of the Federal Reserve Bank of New York presented the purpose of the revised framework in those words: “the new framework is intended to align regulatory capital requirements more closely with underlying risks, and to provide banks and their supervisors with several options for the assessment of capital adequacy”. A BIS press release11 summarizes the new Basel Capital Accord as “a proposal based on three mutually reinforcing pillars that allow banks and supervisors to evaluate properly the various risks that banks face. The New Basel Capital Accord focuses on: minimum capital requirements, which seek to refine the measurement framework set out in the 1988 Accord; supervisory review of an institution's capital adequacy and internal assessment process; and market discipline, through effective disclosure to encourage safe and sound banking practices.”
i.
Basel II – First Pillar – Minimum Capital Requirement
The first pillar, also known as Minimum Capital Requirements is the one who changed the most compared to Basel I. Indeed, it incorporated most of the criticisms made against Basel I about the simplicity of risk model.
Credit risk – Standardized Approach
As in Basel I, the level of capital still depends on the risk of the asset. However, the risk is now assessed by rating agencies. Concerning sovereign claims, while the amount of capital was decided by the appurtenance in the OECD in Basel I, it is now the credit rating assigned to a sovereign‘s debt that matters (Table 212). Moreover, if debt is funded in local currency, local regulators can decrease the weight to adjust to its real riskiness.
8 (Bank for International Settlements 2004) 9
(Basle Committee on Banking Supervision 1988)
10
(Basle Committee on Banking Supervision 1996)
11
(Secretariat of the Basel Committee on Banking Supervision 2001)
14
Credit Assessment AAA to AA- A+ to A- BBB+ to
BBB- BB+ to B- Below B- Unrated
Risk Weight 0% 20% 50% 100% 150% 100%
Table 2 Claims on Sovereign under Basel II
Concerning bank debts, two options are available. The choice will depend on the choice of the national regulator, and this choice will be made for all the banks under their jurisdiction. The first option consists in using the country’s rating and thus determining the rating of all the banks with this rating (Table 313). Thus, assuming a sovereign’s debt is rated A, all banks under its jurisdiction will receive a risk weight of 50% under option 1.
Credit Assessment
of Sovereign AAA to AA- A+ to A-
BBB+ to
BBB- BB+ to B- Below B- Unrated
Risk Weight 20% 50% 100% 100% 150% 100%
Table 3 Claims on Banks debt under Basel II - Option 1
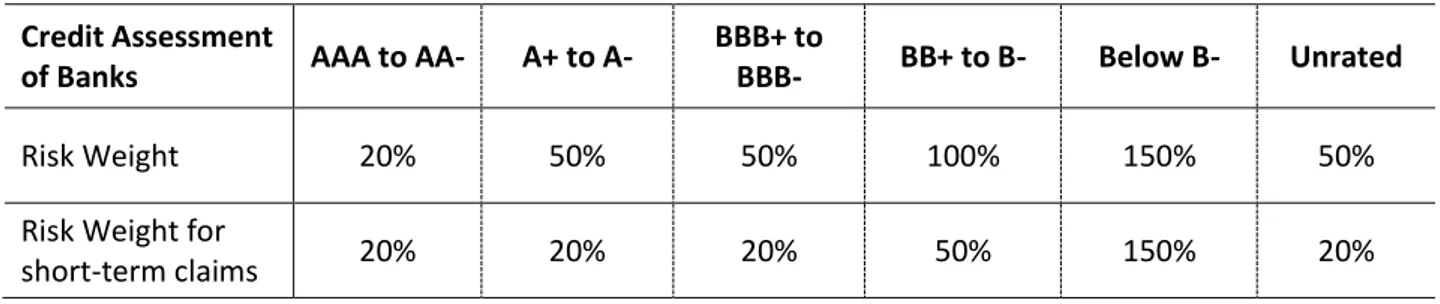
The other option consists in using the rating of the bank debt itself. In this case, the risk weight is assigned based on the bank’s riskiness. Under this option, claims with maturities of less than three months are considered as short-term claims (Table 413). Besides, corporate debt is weighted as bank debt is except debt ranked between BBB+ and BBB- which is rated at 100%.
Credit Assessment
of Banks AAA to AA- A+ to A-
BBB+ to
BBB- BB+ to B- Below B- Unrated
Risk Weight 20% 50% 50% 100% 150% 50%
Risk Weight for
short-term claims 20% 20% 20% 50% 150% 20%
Table 4 Claims on Banks debt under Basel II - Option 2
Credit risk – Internal Rating Based (IRB) Approach
This approach allows banks, after regulatory approval, to use their own risk model to determine the risk weights for their assets. There are several assumptions in this model. First, the probability of default (PD) associated with a specific borrower. Then, the Loss Given Default (LGD) and the
15 Exposure at Default (EAD). The final element to be taken into account is the maturity (M). As for the standardized model, 2 options are available. The first one, the Foundation IRB, in which banks assess the risk of default of their obligor, but all other risk factors derived from the application of standardized supervisory rules. The second one is known as Advanced IRB. It is mainly the same as the Foundation IRB except that most of the assumptions of the risk model are determined by the banks themselves rather than regulator.
IRB approaches are more convenient for both regulators and banks. Indeed, first it incentivized banks to take customers with lower PD as the risk weight will be lower. It would have been fixed whatever the PD in the standardized approach. This lower risk weight implies lower capital requirement and thus higher returns. It also allows banks to reallocate money to the private sector. Indeed, in the IRB approach, there is no reason for private debt to be riskier than public debt. It can have a positive impact on the country’s economy. In addition, IRB is also a way to reduce costs of regulation and to engage banks in self-surveillance.
Operational risk
Concerning operational risk, Basel Committee presents “three methods for calculating operational risk capital charges in a continuum of increasing sophistication and risk sensitivity: the Basic Indicator Approach; the Standardised Approach; and Advanced Measurement Approaches (AMA).”14
The Basis Indicator Approach. Under this approach, banks must hold an amount of capital for operational risk equal to the average over the previous three years of a fixed percentage of positive annual gross income. This fixed percentage is set at 15% but can be changed by national regulators according to their risk assessment of each bank.
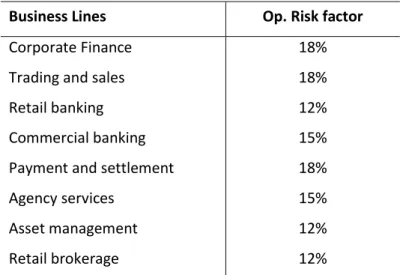
The Standardised Approach. Into this approach, banks’ activities are split into 8 business lines. A capital charge is then calculated per each business line by multiplying its gross income by a factor specific to the business line (Table 514). The total capital charge is then calculated as the three-year average of the summation of each business line’s capital charge. Thus, as we can see in Table 5, Retail Banking appears as less operationally risky than Corporate Finance or Settlement, the two riskiest business lines.
16
Business Lines Op. Risk factor
Corporate Finance Trading and sales Retail banking Commercial banking Payment and settlement Agency services Asset management Retail brokerage 18% 18% 12% 15% 18% 15% 12% 12%
Table 5 Factors for Operational Risk under Standardised Approach
The Advanced Measurement Approach. This approach allows banks to develop their own reserve calculations for operational risk. Those results have to be approved by regulators. To be eligible to this method, banks have to meet several criteria, including the existence of an independent operational risk management function; the existence of regular reporting of operational risk exposures; or granting regular access to external auditors which will control the operational risk declared. As for the IRB approach in credit risk, this method aims at bringing market discipline and self-surveillance of banks.
Market risk
Concerning market risk, Basel II framework suggests many options and scenarios all being available in specific situations. In a nutshell, a clear distinction is made between fixed income and all other market-based assets. Concerning fixed income, banks are allowed to use value at risk (VaR) model to assess market risk. As for IRB and AMA, this is an incentive for banks to use their own models after approval by the regulator. For banks choosing not to use VaR, Basel II recommends splitting market risk between interest rate risk and volatility risk. The main driver of the interest rate risk is the maturity of the asset. As far as volatility risk is concerned, Basel II suggests risk weightings correlated to the credit rating of the underlying bank assets.15
15 The financial crisis of 2009 proved that VaR models were almost all the time inappropriate and did not work
well. Indeed, most of these models are based on historical observations of the data under study which are used as an inputs for statistical models. However, these statistical models become inefficient during times of stress for companies. Indeed, models were calibrated with non-crisis data and it is this kind of data which is expected as inputs. When crisis comes, pre-crisis data becomes irrelevant for understanding the crisis. Thus, models become inefficient and thus useless during times where banks require them the most. This is why many consider that over-relying on historical data and statistical forecasting models can endanger the financial system.
17 McDonough ratio
The whole purpose of the first pillar of Basel I is the definition of the McDonough16 ratio. Indeed, as mentioned, the first pillar is all about minimum capital requirement calculation. However, even if the 8% barrier introduced with the Cooke ratio stands, the difference comes from the calculation of the denominator (Figure 4). Indeed, when the denominator of the Cooke ratio was all about risk weighted assets related to credit risk; with Basel II, the ratio takes into account both Credit risk, Market risk and Operational risk with respective weightings of 85%, 5% and 10%.
Figure 4 McDonough ratio
ii.
Basel II – Second Pillar – Supervisory Review Process
In Basel II accords, “The supervisory review process of the Framework is intended not only to ensure that banks have adequate capital to support all the risks in their business, but also to encourage banks to develop and use better risk management techniques in monitoring and managing their risks”17. This pillar relies on 4 principles which confirm the ability of banks to use internal risk-assessment models and the power of the supervisor over these models.
The first principle confirms what was suggested in Pillar 1, i.e. that “banks should have a process for assessing their overall capital adequacy in relation to their risk profile and a strategy for maintaining their capital levels.16” However, even if the wish of the regulator of more autonomous and self-controlled banks is reiterated, the 3 other principles fix the limits of this autonomy. Indeed, according to the Pillar 2, “Supervisors should review and evaluate bank’s internal capital adequacy assessments *…+ take appropriate actions if they are not satisfied with the results (Principle 2) *…+ have the ability to require banks to hold capital in excess of the minimum (Principle 3) *…+ require rapid remedial action if capital is not maintained (Principle 4).” The purpose of these last 3 principles is to identify as quickly as possible any potential issue that could upraise and could have an impact on the bank or even the whole financial system.
Regulators are thus allowed to create a “buffer” of capital requirement if the situation requires it. They also have the ability to require rapid actions from banks if necessary. Banks can also be
16
McDonough headed the Basel Committee by that time, in addition of being vice-president of the Federal Reserve Bank of New York
18 penalized by the regulator if they fail in the reporting of their risk assessment. Thus, Basel II and the Second Pillar especially, reveal an enlargement of regulator’s power.
iii.
Basel II – Third Pillar – Market Discipline
“The Committee aims to encourage market discipline by developing a set of disclosure requirements which will allow market participants to assess key pieces of information on the scope of application, capital, risk exposures, risk assessment processes, and hence the capital adequacy of the institution. The Committee believes that such disclosures have particular relevance under the Framework, where reliance on internal methodologies gives banks more discretion in assessing capital requirements.18” In a nutshell, the Third Pillar concerns the information banks now have to disclose. Indeed, most of these information used to be only available for regulators beforehand. By doing this the Basel Committee aims at empowering shareholders of banks by increasing transparency. The disclosure requirement mainly concern information related to the First and Second Pillar, like details – either qualitative or quantitative – on credit risk, securitization, market risk… Table 619 is an example of Disclosure Requirement in Basel II, concerning the capital structure.
Qualitative Disclosures (a)
Summary information on the terms and conditions of the main features of all capital instruments, especially in the case of innovative, complex or hybrid capital instruments.
Quantitative Disclosures
(b)
The amount of Tier 1 capital, with separate disclosure of: paid-up share capital/common stock;
reserves;
minority interests in the equity of subsidiaries; innovative instruments;
other capital instruments;
surplus capital from insurance companies;
regulatory calculation differences deducted from Tier 1 capital;
other amounts deducted from Tier 1 capital, including goodwill and investments.
(c) The total amount of Tier 2 and Tier 3 capital. (d) Other deductions from capital.
(e) Total eligible capital.
Table 6 Disclosure Requirement – Third Pillar – Capital structure
18
(Bank for International Settlements 2004)
19
iv.
Implementation of Basel II
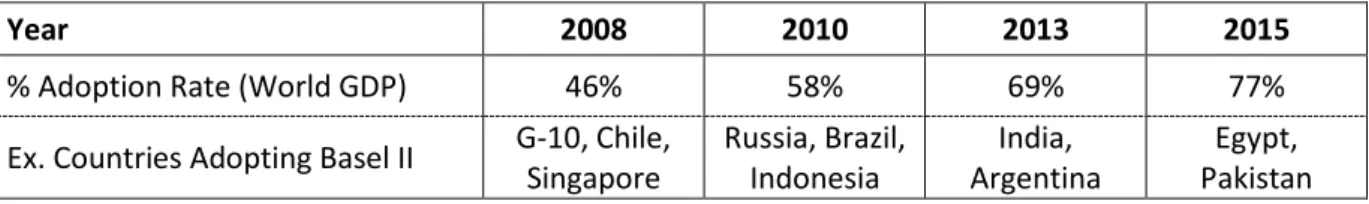
First drafts of Basel II appeared in 2001, followed 3 years later by the first version of the accords in 2004. This version was reviewed and changed again twice in 2005 before a final agreement in July 2006. One major sticking point in the negotiations concerned the scope of the Accord. Indeed, EU wanted the Accord to apply to all banks, while the US wanted it to be only for large international banks. All G-10 countries chose in 2006 to target a full implementation of Basel II in 2008. A study led by Andrew Cornford for the UN details the implementation of Basel II across the world. Indeed, 105 countries – including the G-10 – announced their intention to implement Basel II by 201520. By 2015, 77% of the world’s GDP and 70% of its population would thus be covered by Basel II.
Year 2008 2010 2013 2015
% Adoption Rate (World GDP) 46% 58% 69% 77%
Ex. Countries Adopting Basel II G-10, Chile, Singapore Russia, Brazil, Indonesia India, Argentina Egypt, Pakistan
Table 7 Adoption of Basel II (Source Cornford)
v.
Role of Basel II in the financial crisis
The impact of Basel II in the financial crisis has been widely discussed. The purpose of this section is not to debate of its impact once again but to study how it impacted the regulation and thus, the banks.
We can first go through the main accusations that have been done on Basel II after the crisis. First accusation: the average level of capital required was inadequate and it led to the collapse of many banks. Though capital ratios remained at their Basel I level, the objective was to adapt the risk weights to the granularity of available risks for banks. Basel II is also accused of creating huge losses in portfolios due to its interaction with fair-value accounting. This one is probably a fair accusation but not for Basel II, nor Basel I but for fair-value accounting. Indeed, any regulation requires minimum capital levels. Thus balance-sheet losses due to mark-to-market impacts capital ratios compelling banks to raise new capital. Furthermore, we can add that Basel I and II were mainly focusing on slovability with capital ratios but not on liquidity or leverage, whereas there is no doubt that recent crisis was also a liquidity crisis, i.e. something that was not properly regulated in Basel II, nor Basel I.
20 Basel II is also accused of having procyclical effects. Indeed, during a crisis, the number of borrowers unable to pay back their debt increases, profits decline and the bank capital can be used to address those losses. Moreover, the increasing amount of default rate implies a decrease of borrower’s rating. As a consequence, banks lose on both sides of the capital ratio with a decrease of their capital base and an increase of the risk weighted assets.
Two last points are often raised, first the assessment of credit risk delegated to rating agencies which are subject to conflicts of interest; second, internal models incentivized in Basel II have proven wrong.
Once again, the purpose is not to discuss those criticisms but to study the response that has been done by the Basel Committee. Indeed, as a reaction to the crisis, Basel committee reacted in two times. First, in 2009 with the publication of two amendements to Basel II: Enhancements to the Basel II framework21 and Revisions to the Basel II market risk framework22. The introduction of the document enhancing the framework is extremely clear: “Banks are expected to comply with the revised requirements by 31 December 2010. These enhancements are intended to strengthen the framework and respond to lessons learned from the financial crisis.”
This version is known as Basel 2.523 and was expected to be fully implemented by 31 December 2010 (while modifications concerning Pillar 2 were immedialtely applicable). Modifications concerned all pillars. For Pillar 1, capital requirement was strengthened for certain securitizations to better reflect the risk inherent to those products. For Pillar 2, the update provides banks with additional guidance to address weaknesses that appeared during the financial crisis such as firm-wide governance and risk management, capturing the risk off-balance sheet exposures and securitization activities or even better evaluating and managing risk. Eventually, concerning Pillar 3, requirements are for instance strenghtened in securitization exposures in the trading book and sponsorship of off-balance sheet vehicles. Concerning market risk, the main enhancement concerns VaR models which have to include a stress scenario of the VaR.
While Basel 2.5 was defined to be operational from 2010, focusing only on amendments of Basel II, Basel Committee also started working on a more comprehensive modification of the regulation that would take into account elements that proved being critical during the crisis such as leverage or liquidity: Basel III.
21
(Bank for International Settlements 2009)
22 (Bank for International Settlements 2009) 23
Basel 2.5 is developed by the Basel Committee. However it is not a law but an evolving set of international standards rules which has to be transposed into EU (and national) laws. Thus, while Basel 2.5 stands for the publication of the Basel Committee, CRD III (Capital Requirement Directive) refers to the law that has been voted by the European Commission and is thus mandatory in Europe. CRD IV is the application law of Basel III.
21
III.
Basel III
The first signs of what will become Basel III appeared through two summits of G-20 in June 2010 in Toronto and in November 2010 in Seoul. They both shared the same topic, the international financial system. In December 2010, the BIS published Basel III: A global regulatory framework for more resilient banks and banking systems24. This version had been revised a few months later in June 201125. By the end of the year 2011, in December, all the financial centers of G-20 country committed to adopt Basel III.
i.
Strengthening the capital base
Strengthening the quality of the capital base
The first reform of Basel III concerns the quality of the capital base. “The reforms raise both the quality and quantity of the regulatory capital base and enhance the risk coverage of the capital framework *…+ It is critical that banks’ risk exposures are backed by a high quality capital base. The crisis demonstrated that credit losses and writedowns come out of retained earnings, which is part of banks’ tangible common equity base. It also revealed the inconsistency in the definition of capital across jurisdictions24”.
The first concern is thus to redefine more specifically (and more drastically) what capital means. The regulatory capital is made of Tier 1 and Tier 2 Capital. It is recommended by Basel III that Tier 3 Capital disappears. Tier 1 Capital is itslef made of Common Equity Tier 1 (CET 1) and Additional Tier 1. This Common equity Tier 1 consists of the sum of Common shares and retained earnings. The additional Tier 1 is made of equity-like debt instruments. Criteria for inclusion in Tier 2 Capital will also be strengthened: Minimum original maturity of at least five years, Subordinated to depositors and general creditors of the bank and no incentives to redeem.
Moreover, the purpose of the capital base is to be able to write off potential losses, thus in order to improve the quality of the capital base, deductions have to be done from CET 1 by deleting the elements that cannot fulfill this goal. Thus have to be deducted: Goodwill, Minority interests, Deferred tax assets, Bank investments in its own shares, Benefit pension fund assets.
24
(Bank for International Settlements 2010)
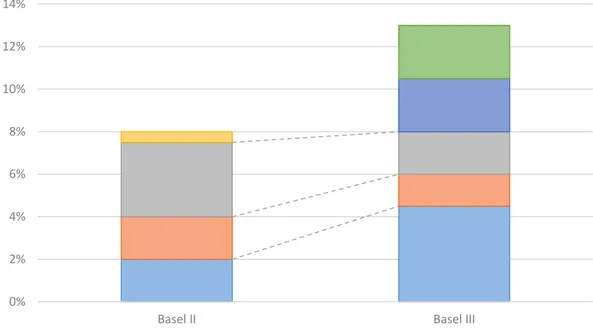
22 Strengthening the quantity of the capital base
The amount of required capital evolves as well. Indeed, even if total capital ratio will remain 8%, CET 1 increases from 2 to 4.5%,. Additional Tier 1 capital ratio is 1.5%, making Tier 1 capital ratio worth 6%. Meanwhile, Tier 2 capital ratio decreases to 2% of the risk weighted assets.
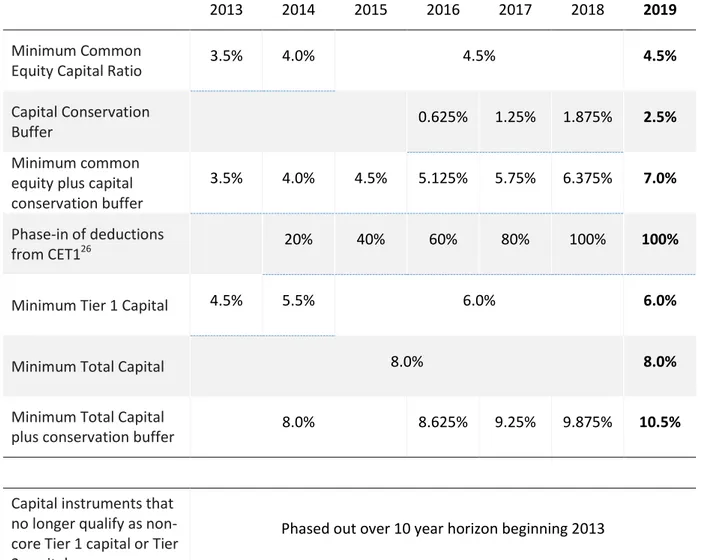
In addition, Basel III introduces two new capital buffers: a capital conversion buffer of 2.5% and a countercyclical buffer of 0 – 2.5% depending on the state of the economy. Besides, the regulator can also require extra capital to cover risks related to Pillar 2 as it was in Basel II. The accords have also defined a phase-in for all those ratio to become mandatory which is presented in Table 8. The cells underlined in blue correspond to transition periods.
2013 2014 2015 2016 2017 2018 2019
Minimum Common
Equity Capital Ratio 3.5% 4.0% 4.5% 4.5% Capital Conservation
Buffer 0.625% 1.25% 1.875% 2.5% Minimum common
equity plus capital conservation buffer
3.5% 4.0% 4.5% 5.125% 5.75% 6.375% 7.0%
Phase-in of deductions
from CET126 20% 40% 60% 80% 100% 100%
Minimum Tier 1 Capital 4.5% 5.5% 6.0% 6.0%
Minimum Total Capital 8.0% 8.0%
Minimum Total Capital
plus conservation buffer 8.0% 8.625% 9.25% 9.875% 10.5%
Capital instruments that no longer qualify as non-core Tier 1 capital or Tier 2 capital
Phased out over 10 year horizon beginning 2013
Table 8 Basel III phase-in arrangements27
26
Including amounts exceeding the limit for deferred tax assets (DTAs), mortgage servicing rights (MSRs) and financials
23
Figure 5 Capital requirements Basel II vs. Basel III28
Besides, we have to notice that the countercyclical buffer is designed as a response to the alleged procyclicality of Basel II. Indeed, during good economic situation, the buffer implies additional capital requirement up to 2.5%. However, in economic dowturn, when capital becomes rare and expensive, the buffer is set around 0% in order to reduce the requirements for the banks and to offer them some regulatory flexibility.
ii.
Leverage ratio
“One of the underlying features of the crisis was the build-up of excessive on- and off-balance sheet leverage in the banking system. In many cases, banks built up excessive leverage while still showing strong risk-based capital ratios. During the most severe part of the crisis, the banking sector was forced by the market to reduce its leverage in a manner that amplified downward pressure on asset prices, further exacerbating the positive feedback loop between losses, declines in bank capital, and contraction in credit availability29”. The BIS justifies by those words the introduction of the “leverage” topic in the banking regulation. Indeed, before Basel III, leverage was not an area for regulators. However, regulators observed that leverage played a role in the financial crisis of 2007 and after and it constitutes a rationale for the introduction of leverage in the reglementation. This
28
(Bank for International Settlements 2011)
29 (Bank for International Settlements 2011)
0% 2% 4% 6% 8% 10% 12% 14%
Basel II Basel III
24 leverage ratio was first introduced in the 2011 version of Basel III but was then amended in 2013 before a final version in January 201430.
The leverage ratio is defined as the capital measure divided by exposure measure. In its actual version it is set at a minimum of 3%.
Figure 6 Definition of leverage ratio under Basel III
The capital measure of this leverage ratio actually refers to the total Tier 1 Capital. Moreover, the regulators are considering the option of using CET1 instead of total Tier 1 Capital for this ratio in the future.
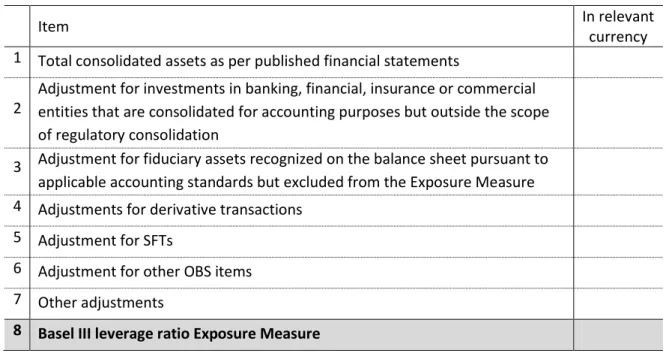
The exposure measure is the sum of four distinct elements: On-balance Sheet Exposures ; Derivatives Exposures ; Securities Financing Transacations Exposures and Other Off-balance Sheet Exposures. The Basel Committee published a table comparing accounting assets versus leverage ratio exposure measure (Table 9). In other words, the denominator is the sum of the exposure values of all assets and off-balance sheet items not deducted from the calculation of Tier 1 capital.
Item In relevant
currency 1 Total consolidated assets as per published financial statements
2
Adjustment for investments in banking, financial, insurance or commercial entities that are consolidated for accounting purposes but outside the scope of regulatory consolidation
3 Adjustment for fiduciary assets recognized on the balance sheet pursuant to applicable accounting standards but excluded from the Exposure Measure 4 Adjustments for derivative transactions
5 Adjustment for SFTs
6 Adjustment for other OBS items 7 Other adjustments
8 Basel III leverage ratio Exposure Measure
Table 9 Summary comparison of accounting assets vs leverage ratio exposure measure31
30
(Bank for International Settlements 2014)
25 Concerning the timing for implementation of this leverage ratio, a parallel run started in January 2013 and will last up to January 2017. During this perdiod, the leverage ratio and its components are reported and tracked. On January 2015, banks will have to start making public disclosures regarding the leverage ratio. Final adjustments to the ratio may be applied in 2017 and the ratio in its definitive version will then become mandatory starting from January 2018.
iii.
Liquidity ratio
One of the main outcome of Basel III is without any doubts, the implementation of liquidity ratios. Indeed, according to the BIS: “During the early liquidity phase of the financial crisis that began in 2007, many banks – despite adequate capital levels – still experienced difficulties because they did not manage their liquidity in a prudent manner. The crisis drove home the importance of liquidity to the proper functioning of financial markets and the banking sector32”. Consequently, the Basel Committee defined 2 new ratios concerning liquidity, the Liquidity Coverage Ratio (LCR) and the Net Stable Funding Ratio (NSFR).
Liquidity Coverage Ratio (LCR)
“The objective of the LCR is to promote the short-term resilience of the liquidity risk profile of banks. *…+ The LCR will improve the banking sector’s ability to absorb shocks arising from financial and economic stress, whatever the source, thus reducing the risk of spillover from the financial sector to the real economy”33. The purpose of this ratio is to get sure that banks have enough high quality liquid assets to withstand a 30-day stressed funding scenario that is specified by supervisors.
Figure 7 Definition of Liquidity Coverage Ratio (LCR)
Assets are considered High Quality Liquid Assets (HQLA) if they can easily be converted in cash with almost no loss of value. However, as the liquidity of an asset depends on the underlying stress scenario, there is no exhaustive list of HQLA. Though, the Basel Committee defined the characteristics of an HQLA. We find among those characteristics the necessity of carrying low risk, being easy and certain to valuate, having low correlation with risky assets, being listed on a
32
(Bank for International Settlements 2013)
26 developed and recognized exchange, having a low volatility. It is also key that an HQLA is not issued by the institution or parent/subsidiary.
There are also operational requirements in order to be considered as HQLA. Indeed, the assets must be appropriately diversified, being legally and practically available at any time during the next 30 days and even being controlled by a liquidity management function.
Those HQLA are split into two groups: Level 1 assets and Level 2 assets. Level 1 assets can be included without limit, while Level 2 assets are limited to 40% of the HQLA. Level 1 comprises cash, central bank reserves and any marketable securities representing claims that has been asigned a 0% risk-weight under Basel II. Those assets are included at their market value without any haircut. However, a 15% haircut is applied to the market value of Level 2 assets. It consists of the marketable securities that have been applied a 20% risk-weight under Basel II.
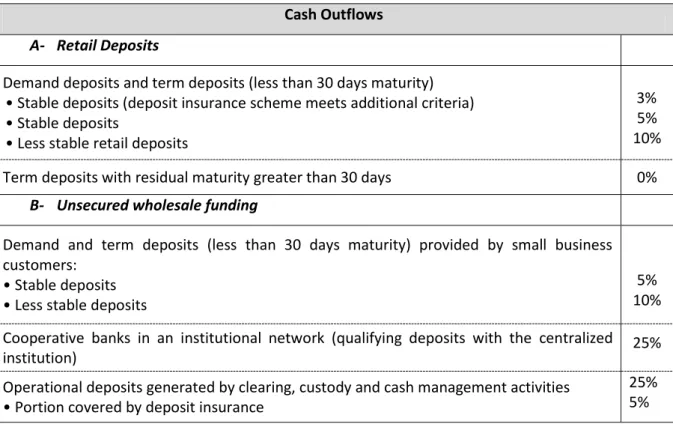
The denominator of the LCR, the Total Net Cash Outflow over a 30 day period is made of the total cash outflow expected for the period minus the minimum of the total cash expected inflow and 75% of the expected cash outflow. The minimum function aims at introducing a cap for the expected cash inflow to follow what could happen in a stress scenario. In order to compute the amount of cash outflow, Basel III provides banks with a list of all the eligible items with their respective run-off factor.
Cash Outflows
A- Retail Deposits
Demand deposits and term deposits (less than 30 days maturity) • Stable deposits (deposit insurance scheme meets additional criteria) • Stable deposits
• Less stable retail deposits
3% 5% 10%
Term deposits with residual maturity greater than 30 days 0%
B- Unsecured wholesale funding
Demand and term deposits (less than 30 days maturity) provided by small business customers:
• Stable deposits • Less stable deposits
5% 10% Cooperative banks in an institutional network (qualifying deposits with the centralized
institution) 25%
Operational deposits generated by clearing, custody and cash management activities • Portion covered by deposit insurance
25% 5%
Table 10 Example of the run-off factors for the cash outflow in LCR calculation34
27 For instance, a retail deposit with a maturity less than 30 days is a potential cash outflow, its amount has thus to be multiplied by 5% (3% if related to an insurance scheme) to get the actual cash outflow. Table 10 provides us with examples of these run-off factors for some elements to be taken into account in the cash outflow calculation. The same table exists for the cash inflow calculation, each specific item being assigned an inflow factor.
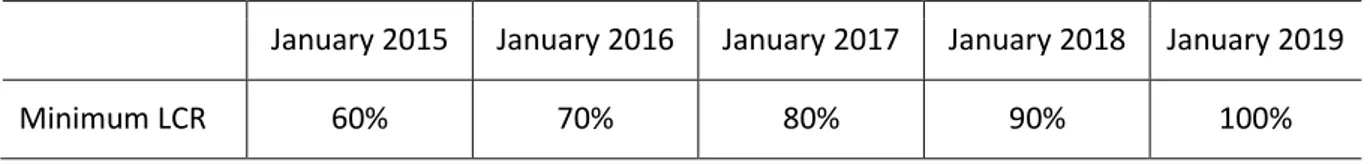
Eventually, the LCR has been fixed at a minimum level of 100%. However, this 100% level will only be reached in 2019. Indeed, regulators chose to introduce the LCR in January 2015 at a 60% level. It will then rise of 10% per year to reach 100% in 2019.
January 2015 January 2016 January 2017 January 2018 January 2019
Minimum LCR 60% 70% 80% 90% 100%
Table 11 Evolution of the minimum LCR before reaching its final value of 100% in 2019
Figure 8 represents a very clear and explicit summary of the LCR realized by Accenture in its Basel III Handbook35.
Figure 8 Summary of the LCR ratio
Net Stable Funding Ratio (NSFR)
The other liquidity ratio introduced in Basel III was specified one year after the LCR, in January 2014 under a consultative version. The definitive version is not available at that date. While the LCR aims at monitoring the ability of banks to find liquidity on a stress scenario, “the NSFR will require banks to maintain a stable funding profile in relation to the composition of their assets and off-balance sheet
28 activities. A sustainable funding structure is intended to reduce the likelihood that disruptions to a bank’s regular sources of funding will erode its liquidity position in a way that would increase the risk of its failure36”. The NSFR is equal to the available amount of stable funding divided by the required amount of stable funding. This ratio has to be greater than 100%. It will become mandatory by 2018.
Figure 9 Definition of the NSFR ratio
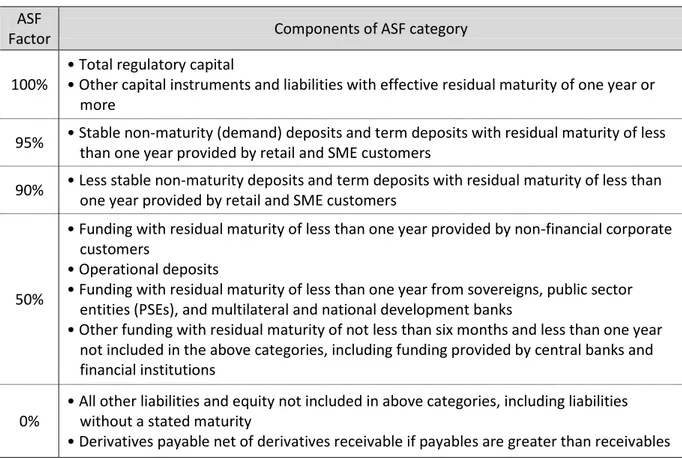
The available amount of stable funding is computed using bank’s liabilities, each item being assigned an Amount of Stable Funding (ASF) assessing its “stability”. Maturity is for instance one element used to assess this stability.
ASF
Factor Components of ASF category
100%
• Total regulatory capital
• Other capital instruments and liabilities with effective residual maturity of one year or more
95% • Stable non-maturity (demand) deposits and term deposits with residual maturity of less than one year provided by retail and SME customers
90% • Less stable non-maturity deposits and term deposits with residual maturity of less than one year provided by retail and SME customers
50%
• Funding with residual maturity of less than one year provided by non-financial corporate customers
• Operational deposits
• Funding with residual maturity of less than one year from sovereigns, public sector entities (PSEs), and multilateral and national development banks
• Other funding with residual maturity of not less than six months and less than one year not included in the above categories, including funding provided by central banks and financial institutions
0%
• All other liabilities and equity not included in above categories, including liabilities without a stated maturity
• Derivatives payable net of derivatives receivable if payables are greater than receivables
Table 12 Summary of liability categories and associated ASF factors37
As for the available amount of stable funding, the required amount of stable funding, i.e. the denominator of the NSFR ratio is defined in very specific terms by the Basel Committee. Basically, assets are given a required stable funding (RSF) factor which is specific for each category. For
36
(Bank for International Settlements 2014)
29 instance, coins and banknotes are assigned a 0% RSF factor, while the level 1 Assets of the LCR ratio are assigned a 5% RSF factor. Level 2 Assets are either assigned a 15% or 50% RSF factor. Some assets such as all assets that are encumbered for a period of one year or more, are assigned a 100% RSF factor.
Impact of liquidity ratios on the financing of the economy
A key question related to these liquidity ratios concerns their impact on the financing of the economy. Indeed, in Europe banks finance more than 80% of the economy.
The LCR, which focuses on short term liquidity, incentivizes banks to acquire sovereign debt rather than corporate debt as it is less risky and more liquid. Thus banks could have to strengthen their short term liabilities rather than long term. By doing so, their ability to make the link between short term savings and long term loans could be reduced.
In addition, one major role of banks is the transformation of maturity. Indeed, banks grant loans from middle to long term, and they finance themselves on the short term through deposits and the collection of liquid savings. However, the NSFR will force banks to finance on long term to match the maturity of their positions, the granted loans. Their financing could thus become more expensive and reduce their ability to make this transformation. This increase in financing cost could either be impacting the price of their loans for individuals or simply reduce the number of loans they grant. We can thus wonder who could still be lending money to individuals and SMEs. Increase of disintermediation is a possible consequence of this change in regulation.
Some studies focused on this question of financing of the economy. All of them highlighted the fact that the change in regulation came at a price for banks and some of its price impacted final customers. However, they also conclude that the impact on the financing of the economy is relatively moderate. We can for instance quote a study by the IMF38 entitled Estimating the Costs of the Financial Regulation (Sep. 2012): “Financial reform comes at a price. Higher safety margins, particularly in terms of greater capital and liquidity, do add operating costs for lenders. Those costs will be passed on, at least partially, to the wider economy. Lending rates appear likely to rise 17 bps in Europe, 8 bps in Japan, and by 26 bps in the United States, according to the base case.” The study also isolates the impact of each change in the regulation. Table 13 represents the estimated impact of higher liquidity requirements of Basel III. It shows that banks will experience an increase in the average costs of their funds as they lengthen liability maturities or a decrease of their investment returns if they instead shorten the maturity of their assets. However, even if lending rates will
30 increase, the study also points out that banks should be able to compensate by reducing their costs, which could imply to reduce its workforce.
Europe Japan US Liquid assets needed for a 100% LCR (in US$ billion)
Reduction in liquid assets from capital increases (in US$ billion) Net liquid assets needed (in US$ billion)
Increase in pre-tax funding cost or reduction in investment income (in %) Reduction in pre-tax interest margin (in US$ billion)
Reduction in pre-tax interest margin (in percentage of total assets) Funding needed for a 100% NSFR (in US$ billion)
Reduction in the funding needed from capital increases (in US$ billion) Net funding needed (in US$ billion)
Increase in pre-tax funding cost or reduction in investment income (in %) Reduction in pre-tax interest margin (in US$ billion)
Reduction in pre-tax interest margin (in percentage of total assets) Elimination of overlap between actions to meet LCR and NSFR (in %) Total net effect of LCR and NSFR (in percent)
1,435 128.23 1,306 2.00 26.13 0.08 1,843 128.23 1,715 2.00 34.30 0.10 -0.04 0.14 54.21 27.93 26 1.25 0.33 0.01 563 27.93 535 1.25 6.69 0.11 0.00 0.11 700.00 92.20 608 2.00 12.16 0.11 1,000 92.20 9078 2.00 18.16 0.16 -0.05 0.21
Table 13 Estimated Effects of Liquidity Changes on Lending Rates39
While this first section was focusing on the evolution of the regulation over the year, it could now be interesting to focus on specific examples of banks, in order to see how they implement Basel III and how well prepared they are. To do so, we chose to focus on Europe by looking first at the European level before digging in specific examples. We chose to work on 4 different European banks, each of them corresponding to a specific geography.
31
Section B:
32
I.
European Banking Association’s study on Basel III
implementation on European banks
Before focusing on specific examples of European banks, it is worth getting the whole picture of the changes Basel III implies on European banks. To do so, data from the European Banking Association (EBA) can be used. Indeed, following the first launch of Basel III in 2011, the EBA started collecting data of more than 170 European banks. Those data include most of the relevant ratios for Basel III in addition to the levels of capital. The conclusions of this monitoring exercise40 are then published twice a year, in June and December. The first one came out in June 2011 and four others followed it. Those data provide us with an interesting overview of the situation for European banks. However, it can be even more interesting to compare those data in order to get a tendency on the evolution of those ratios over the last two years.
In terms of methodology, the EBA chose to split their results between two groups: Group 1 and Group 2. Group 1 banks are those with Tier 1 capital in excess of €3 bn and internationally active. All other banks are categorized as Group 2 banks. Group 1 is thus made of 41 banks while Group 2 is made of 126 banks41.
The conventions used by the EBA will be used in the following charts: Thick red line: Respective minimum requirement
Dashed lines: Respective minima plus the capital conservation buffer (capital)
Thin red line: Median value (50% of the observations are below this value, 50% are above this value)
‘x’: Mean (weighted average)
Blue box:
25th and 75th percentile values. A percentile is the value of a variable below
which a certain per cent of observations falls. For example, the 25th
percentile is the value below which 25 per cent of the observations are found
Black vertical lines (‘whiskers’):
The upper end-point represents the 95th percentile value, while the lower
end-point represents the 5th percentile value.
Table 14 Conventions used in the EBA charts42
40
(European Banking Association 2012) (European Banking Association 2013) (European Banking Association 2014)
41
This split corresponds to the study of June 2013, it was 48 for Group 1 and 110 for Group 2 in 2011
33
i.
Impact of Basel III on capital ratios
Figure 10 depicts the situation as of June 2013. Most of the banks of the sample match the CET 1 ratio requirement, but it is far less obvious for Tier 1 ratio with more than 25% of the Group 1 banks having a Tier 1 ratio lower than the requirements plus the capital buffer.
Figure 10 Distribution of CET 1, Tier 1 and Total capital ratio per group of banks43
Besides, Figure 11 represents for both groups the evolution of the CET 1 ratio over time from June 2011 to June 2013 under two scenarios: the current scenario takes into account CET 1 as it is calculated with current regulation, while the Basel III scenario corresponds to bank’s CET 1 if Basel III were fully applicable by now. We can observe on this chart that the CET 1 of European banks has been continuously increasing over the period, above the minimum requirements. However, if we take into account the capital buffer, when Group 1 banks are above the requirements in the Basel scenario, with an increasing tendency, Group 2 banks are 1% above with a stagnating tendency. We can also note that switching from current scenario to Basel III scenario implies a reduction of 3% to 4% of the CET 1 ratio. This is due both to a new definition of the numerator (the capital) and an increase of the denominator (RWA).
34 It is also possible to add that in Group 1, when 21% of banks had a CET 1 ratio inferior to 4.5% and 33% between 4.5% and 7% in June 2011, those figures have respectively decreased to 5% and 13%. It denotes a better adaptation of the European banks to their new regulation and it tends to prove that all European banks should be compliant with Basel III requirements when they are fully in application.
Figure 11 Change in CET 1 ratio over the time44
Figure 12 represents the evolution of the aggregate capital shortfall for European banks. The capital shortfall is the difference between capital requirements of Basel III and the existing eligible capital. It corresponds to the amount of capital banks will have to put aside in the coming years to match their Basel III constraints. Figure 12 clearly shows that capital shortfall has continuously decreased over the period from more than €450 bn to €150 bn for Group 1. Concerning Group 2, it is as if the capital shortfall were stagnating, however the EBA noted that this is due to one specific bank of the Group 2 panel, which acquired recently another bank which is outside of the panel, and was thus not monitored. It implied an increase in the capital shortfall for the last two monitoring exercises. The report as of June 2013 adds that without this specific bank, capital shortfall would have decreased by more than 50% between June 2011 and June 2013.
35
Figure 12 Change in capital shortfall over time by type of capital45
ii.
Impact of Basel III on leverage ratio
As for capital ratio the EBA monitoring exercise provides us with both a static and dynamic repartition of the leverage ratio. Figure 13 gives the vision as of June 201345.
Figure 13 Distribution of the Liquidity Ratio over the Groups
36 We can first observe that the dispersion of the leverage ratios is much bigger for Group 2 than Group 1. It is mainly due to the heterogeneity of the sample. In addition, we can conclude that if the leverage ratio were fully active by now, more than 25% of the banks would not match the 3% requirement.
Moreover, Figure 14 offers a dynamic view of the situation. We can see that banks of Group 2 have reached the 3% level and navigate above the cut. Concerning Group 1 banks, the leverage ratio has been increasing continuously from June 2011 to June 2012, but it seems to stagnate just below the cut. However, these figures have been collected and computed before the release of January 2014 on the leverage ratio, which means that leverage ratios in Figure 14 are not based on the last definition of the ratio. We can expect the leverage ratio to increase compared to the levels of June 2013 once the new definition will be taken into account, especially by the EBA in their monitoring exercise.
Consequently, this study tends to prove that European banks are on a good trend in order to fulfill their leverage requirements.
Figure 14 Change in the leverage ratio by bank group46
37
iii.
Impact of Basel III on liquidity ratio
Concerning the LCR, the EBA monitoring exercise sends excellent signals. Indeed, even if the LCR will only be introduced in January 2015 with a level set at 60% by that time, the average LCR is well above the requirements at 104% for Group 1 banks and 133% for Group 2 banks (Figure 15). More than 60% of the banks actually meet the 100% requirements, while only 14% of them are below the 60% level. Besides, concerning the numerator of the LCR, the study reveals that more than 80% of the HQLA are made of level 1 assets. Thus, it tends to prove that the maximum of 40% of level 2 assets does not constitute a restriction for banks.
Figure 15 Change in LCR by bank group47
38
II.
Focus on specific European banks
The study of the EBA tends to prove that European banks are currently doing their best to match the new Basel III regulation. Indeed, in average, banks are above the required capital ratios, LCR and leverage ratio. Besides, those ratios have been continuously increasing over the last year and the capital shortfall has decreased meanwhile.
This monitoring exercise is useful for giving the whole picture of the sector (European banks). However, it is also worth investigating the consequences on specific banks of Basel III. Indeed, even if the sector tends to adapt to the new regulation, what are the consequences of this adaptation for banks. For instance, Figure 16 – realized by Société Générale – gives an overview for more than 25 banks of the impact of the regulatory change on the CET 1 ratio. The adoption of Basel III implies a reduction of 2.3% of the CET 1 for the sector. Credit Suisse’s CET 1 ratio decreases more than 7% while the one of BBVA decreases less than 1%.
Figure 16 Basel III potential impact on CET 1 ratio (%)48
Obviously this decrease of the CET1 ratio implies additional work from banks to comply with the required level (using the new definition of the ratio). Possible solutions include increasing the capital, or reducing RWA. However, those solutions have an impact on the profitability of banks, as they will have to find more capital. We can also quote this other report (Figure 17) from Société Générale that shows correlation between return on tangible equity (RoTE) and Price to Tangible Book. This study distinguishes 3 groups, American banks for whom the correlation is excellent (R2=0.94), British banks and the top European banks excluding the British one (good correlation, R2=0.74). Thus according to this study, not only does Basel III require additional efforts from banks to comply with the regulation,
39 but it also diminishes their performance ratios, such as RoE and RoTE, which also lead to a decrease of their valuation. The next pages will thus focus on example of banks that have to adapt to this new regulatory environment. We will especially focus on the various changes they had to achieve to comply with the regulation and the associated evolution of their ratios.
Figure 17 Unfortunate consequence of Basel III: low valuation49
40
III.
HSBC Case study
i.
HSBC at a glance
HSBC is one of the largest banking organizations in the world with more than 54 million customers and 254,000 employees worldwide located in 75 countries and territories. HSBC’s global headquarter is located in London and they are listed in London, Hong Kong, New York, Paris and Bermuda. Table 15 summarizes some of the main metrics of HSBC.
Profit before Tax $22.6 bn
RoE 9.2%
Market cap $207 bn50
Share price £ 6.6250
Tier 1 ratio 14.5%
Table 15 HSBC at a glance51
ii.
HSBC regulatory disclosure
As Basel III only exists under its current version since 2013 and as it is not yet mandatory, HSBC disclosed their regulatory data using Basel 2.5 framework. However, they also disclose for 2013 the impact that would have the full adoption of Basel III.
50
Price as of 31 December 2013