HAL Id: tel-01580735
https://halshs.archives-ouvertes.fr/tel-01580735
Submitted on 1 Sep 2017HAL is a multi-disciplinary open access archive for the deposit and dissemination of sci-entific research documents, whether they are pub-lished or not. The documents may come from teaching and research institutions in France or abroad, or from public or private research centers.
L’archive ouverte pluridisciplinaire HAL, est destinée au dépôt et à la diffusion de documents scientifiques de niveau recherche, publiés ou non, émanant des établissements d’enseignement et de recherche français ou étrangers, des laboratoires publics ou privés.
Urban agglomerations and administrative boundaries of
cities
Hui Cao
To cite this version:
Hui Cao. New trends of urbanization in Sichuan and Chongqing: Urban agglomerations and ad-ministrative boundaries of cities. Demography. Université Paris-Diderot - Paris VII, 2014. English. �tel-01580735�
Diderot (Paris 7)
Sorbonne Paris Cité
École Doctorale 382
Économies, espaces, sociétés, civilisation, pensée critique, politique et pratiques sociales Laboratoire CESSMA
Centre d’études en sciences sociales sur les mondes africains, américains et asiatiques
THÈSE DE DOCTORAT
Géographie
AUTEUR
CAO Hui
Nouvelles tendances de l’urbanisation au Sichuan et à Chongqing:
Agglomérations urbaines et périmètres administratifs des villes
New trends of urbanization in Sichuan and Chongqing:
Urban agglomerations and administrative boundaries of cities
Thèse dirigée par François MORICONI-EBRARD soutenue publiquement le 11 juillet 2014 devant le jury composé de :
M. DENIS Eric
Directeur de Recherche au CNRS Mme MARIUS Kamala
Maître de Conférences HDR, Université de Bordeaux 3 (Rapporteur) Mme MERING Catherine
Professeur des Universités, Université Paris 7-Diderot (Présidente du jury) M. MORICONI-EBRARD François
Directeur de Recherche au CNRS (Directeur de thèse) M. REBOUR Thierry
Writing this Ph.D. thesis has been one of the longest and toughest journeys in my life. Fortunately, I am not alone throughout this journey, and I would like to thank all those who help me accomplish this task.
First of all, I wish to express my deepest gratitude to my thesis advisor François Moriconi-Ebrard for his guidance and patience in the various stages of my thesis work, and without him this thesis could not have been completed. Indeed, François is not only the advisor for this thesis but also my life mentor. I am grateful for having met such a great gentleman!
I also thank the jury members Catherine Mering, Kamala Marius, Thierry Rebour, and Eric Denis for accepting the invitation to judge my work.
For the e-Geopolis data used in this thesis, I acknowledge the assistance of l’Agence Na-tionale de la Recherche et l’Association as well as the e-Geopolis team members, including Catherine Chatel, Eric Denis, Hervé Gazel, Nicolas Douay, Dominique Harre-Rogers, Kamala Marius-Gnanou.
My special thanks go to Tat-kei for all of his tireless assistance in the thesis work. I also thank other friends for their help, including Salwa Ansart, Olivier N, and Shiming Meng. I will not forget the companion of my friends in Avignon where I have spent the last two years to work on this thesis, including Mamouch, Cathy, Florence, Elvire et Iris, Lelio, Liam, Eric, Louis, Mary, and Mounir. I also thank my friends in Paris, including Salwa, Anita Chen, Pascal, Shun Hai Xu, and Philippe, for their encouragement and help in my studies and my life.
最后我要特别提到我中国的父母,感谢你们这么多年对我一直的包容支持和关爱,我爱你 们。我想特别把这篇论文奉献给我舅舅,没有他多年前的建议和一直以来的鼓励和帮助,就没 有今天这篇论文。感谢我中国所有的亲人朋友们,谢谢大家的存在。
New trends of urbanization in Sichuan and Chongqing:
Urban agglomerations and administrative boundaries of cities
Keywords: Urbanization, Sichuan, Chongqing, Chengdu, China, e-Geopolis.
Measuring and comparing urban population in different countries, including China, have been a well-known problem because the national statistical agencies of different countries may use different definitions of “urban populations.” In this thesis, we use the e-Geopolis urban population statistics to uncover new trends of urbanization in Sichuan and Chongqing, two
shengjidivisions situated in the southwestern part of China, between 2000 and 2010. A novel approach of estimating population statistics, e-Geopolis uses a harmonized definition of urban population and thus its population estimates can be compared across different countries over time, irrespective of the actual definitions of urban population used by the national statistical agencies.
Our analysis shows that the urban population statistics estimated by e-Geopolis are very dif-ferent from those reported by the National Bureau of Statistics, the official statistical agency of China. This comparison suggests that the official statistics can be misleading and can portrait an inaccurate picture of the actual extent of urbanization in China. For example, based on the
e-Geopolisurban population statistics for Chongqing Zhixiashi and Sichuan Sheng, we find that the primacy index at shengji is higher. This situation can be explained by the concentration of capital in a labor-intensive economy where economies of agglomerations can reduce the costs of production. However, we cannot see the same patterns when we use the official urban population statistics provided by the National Bureau of Statistics.
Using e-Geopolis, we identify the larger urban agglomerations in Chongqing Zhixiashi and Sichuan Sheng and compare the urbanization patterns of the two largest urban agglomera-tions, Chongqing and Chengdu, between 2000 and 2010. We find that the Chongqing ag-glomeration was smaller than the Chengdu agag-glomeration, both in terms of agag-glomeration population and land area. Besides, between 2000 and 2010, the agglomeration population of Chongqing grew at a lower pace than that of Chengdu. Moreover, Chengdu’s urban popu-lation was more concentrated within the qu whereas Chongqing’s urban popupopu-lation scattered around different regions of the qu.
urbanization, economic development, and migration. We find that the larger urban agglomer-ations did not necessarily have larger GDP or secondary sectors. In particular, the Chongqing agglomeration had a smaller population than the Chengdu agglomeration; nevertheless the former had a larger GDP as well as a larger secondary sector. On the other hand, we find that faster growing urban agglomerations seemed to attract more external migrants.
We view our results as the first step of using e-Geopolis to understand the urbanization patterns of China. When the complete set of e-Geopolis urban population statistics of China is available, it should be very useful for researchers and policy makers to better measure China’s urbanization and also compare the urbanization experiences of China and other countries in the world.
Nouvelles tendances de l’urbanisation au Sichuan et à Chongqing:
Agglomérations urbaines et périmètres administratifs des villes
Mots-clefs : Urbanisation, Sichuan, Chongqing, Chengdu, Chine, e-Geopolis.
Mesurer et comparer la population urbaine dans différents pays, dont la Chine, est un problème récurrent lié au fait que les agences statistiques nationales des pays peuvent utiliser différentes définitions des termes « populations urbaines ». Dans cette thèse, nous utilisons la base de données e-Geopolis pour découvrir, entre 2000 et 2010, les nouvelles tendances de l’urbanisation au Sichuan et à Chongqing, les deux divisions shengji situées dans le sud-ouest de la Chine. Par une nouvelle approche de l’estimation de la population, e-Geopolis utilise une définition harmonisée de la population urbaine. Ses estimations de population peuvent être comparées dans différents pays et à différentes périodes, quelles que soient les actuelles définitions de la population urbaine utilisées par les organismes statistiques nationaux.
Notre analyse démontre que l’estimation statistique de la population urbaine réalisée par
e-Geopolisest très différente des statistiques de la population urbaine réalisées par le National Bureau of Statistics, agence statistique Chinoise officielle. Cette comparaison laisse à penser que les statistiques officielles peuvent être trompeuses et donner une image inexacte de la réalité de l’urbanisation en Chine. Par exemple, selon les statistiques e-Geopolis de la population urbaine de Chongqing Zhixiashi et Sichuan Sheng, nous trouvons que l’indice de la primauté à shengji est plus élevé. Cette situation peut s’expliquer par la concentration du capital dans une économie de main-d’œuvre où les économies d’agglomérations peuvent réduire les coûts de production. Cependant, il n’est pas possible de retrouver les mêmes modèles, lorsque nous utilisons les statistiques officielles de population urbaine fournies par le National Bureau of Statistics.
En utilisant e-Geopolis, nous identifions les grandes zones d’agglomération urbaine à Chongqing Zhixiashi et Sichuan Sheng et comparons les modèles d’urbanisation des deux plus grandes zones d’agglomération urbaine, Chongqing et Chengdu, entre 2000 et 2010. Nous constatons que l’agglomération de Chongqing est plus réduite que celle de Chengdu, à la fois en termes de population et de superficie. Par ailleurs, entre 2000 et 2010, la population de l’agglomération de Chongqing a augmenté à un rythme inférieur à celui de Chengdu. En
Chongqing était dispersée dans différentes régions du qu.
Nous utilisons également les statistiques de population urbaine e-Geopolis pour examiner la relation entre urbanisation, développement économique, et migration. Nous trouvons que les grandes agglomérations urbaines n’ont pas nécessairement un PIB ou un secteur secondaire plus développé. En particulier, l’agglomération de Chongqing avait une population plus ré-duite que celle de Chengdu alors que la première avait un PIB supérieur ainsi qu’un secteur secondaire plus développé. D’un autre côté, nous constatons que les agglomérations urbaines en croissance rapide semblent attirer plus de migrants externes.
Nous considérons nos résultats comme la première étape d’une utilisation de e-Geopolis pour comprendre les modèles d’urbanisation en Chine. Nous pensons que l’ensemble des statistiques e-Geopolis de la population urbaine en Chine devrait être très utile aux chercheurs et aux décideurs afin de mieux mesurer l’urbanisation chinoise et de comparer les expériences d’urbanisation de la Chine avec celles d’autres pays.
四
四
四川
川
川与
与
与重
重
重庆
庆
庆城
城
城镇
镇
镇化
化
化的
的
的新
新
新趋
趋
趋势
势
势:
:
:
城
城
城市
市
市聚
聚
聚集
集
集与
与
与城
城
城市
市
市之
之
之行
行
行政
政
政边
边
边
界
界
界
关键词:城镇化、四川、重庆、成都、中国、e-Geopolis 鉴于不同国家对“城市人口”的定义有所不同,计算和比较不同国家(包括中国)的城市人 口数据是一个众所周知的难题。本论文采用e-Geopolis的城市人口数据方法去研究中国西南部两 大省级行政区—四川和重庆—在2000年至2010年之间的城镇化新趋势。作为一个新颖的城市 人口计算方法,e-Geopolis采用一个统一的城市人口定义,因此其城市人口数据能在不同国家不 同时期加以比较,且不受不同国家统计机构采用的城市人口定义所影响。 我们的分析显示,e-Geopolis统计出来的城市人口数据与国家统计局提供的城市人口数据差 别很大。这个比较意味着官方数据可能存在误导性,并且不能反映中国城镇化的实际情况。 例如,根据e-Geopolis统计的重庆直辖市和四川省的城市人口数据,我们发现省级的首位度比较 高。这个现象是由于在一个劳力密集的经济内,资本集中能让聚集经济降低生产成本。但是, 当我们利用国家统计局提供的官方城市人口数据,我们观察不到相同的现象。 通过e-Geopolis,我们鉴定了重庆直辖市和四川省内较大的城市聚集,并比较了其最大的两 个聚集—重庆和成都—在2000年和2010年之间的城镇化模式。我们发现重庆聚集在聚集人口 和面积较成都聚集的小。其次,在2000年和2010年之间,重庆的聚集人口增长速度较成都的 慢。另外,成都的城市人口集中在市辖区内,而重庆的城市人口则分布不同的市辖区。 我们也采用了e-Geopolis的城市人口数据去研究城镇化、经济发展和迁移之间的关系。我们 的分析指出人口较大的聚集未必有较大的GDP和第二产业:重庆聚集虽然比成都聚集小,但前 者有更高的GDP和第二产业。另外,人口增长较快的聚集看来能吸引更多的外来人口。 我们认为本论文的发现是作为采用e-Geopolis数据去分析中国城镇化的第一步。我们相信当 整个中国的e-Geopolis数据统计出来之后,这些数据将有助研究人员和政策制定者在衡量中国的 城镇化及比较中国和其他国家在城镇化的经验上起到很大的作用。General Introduction 1 1 Literature Review 11 1.1 Introduction . . . 11 1.2 Theories of urbanization . . . 13 1.2.1 Modernization theory . . . 13 1.2.2 Dependency theory . . . 14
1.2.3 Urban bias theory . . . 14
1.2.4 Dual-sector and rural-urban migration models . . . 15
1.3 International patterns of urbanization . . . 17
1.3.1 The relationship between urbanization and economic development . . . 18
1.3.2 The evolution of world urbanization . . . 20
1.3.3 Urban agglomerations . . . 22
1.4 Different international urban population databases . . . 25
1.4.1 Some earlier databases used by historians and geographers . . . 25
1.4.2 More recent international urban population databases . . . 27
1.4.3 Urban population databases created by French researchers . . . 31
1.5 The problems of measuring urban population . . . 33
1.5.1 The definition of urban spaces . . . 34
1.5.2 The difficulty of using a harmonized definition by statistical agencies . . 38
1.6 Conclusion . . . 39
2 Methodology 41 2.1 Introduction . . . 41
2.2 e-Geopolis: An harmonized definition of urban agglomeration . . . . 42
2.2.1 Background of the Geopolis database . . . . 42
2.2.2 Harmonizing the definition of urban agglomeration . . . 43
2.2.3 The rules for identifying an urban agglomeration . . . 44
2.3 The estimation of e-Geopolis urban population statistics . . . . 48
2.3.1 Data requirements . . . 48
2.4 Main findings and limitations of e-Geopolis . . . . 54
2.4.1 The 30 largest urban agglomerations identified by e-Geopolis . . . . 54
2.4.2 The advantages and limitations of e-Geopolis . . . . 56
2.4.3 e-Geopolis versus World Urbanization Prospects . . . . 57
2.4.4 e-Geopolis versus GRUMP . . . . 59
2.5 From Geopolis to e-Geopolis: Inheritance and renewal . . . . 62
2.6 Conclusion . . . 64
3 Urbanization in China: Background and Issues 65 3.1 Introduction . . . 65
3.2 The problems of measuring urban population in China . . . 68
3.2.1 Distinction among hukou population (户籍人口), resident population (常 驻人口), and census population (普查人口) . . . 68
3.2.2 Defining urban population in different population censuses . . . 69
3.2.3 Changing boundaries of administrative areas . . . 73
3.2.4 Correction of the official urban population statistics . . . 76
3.2.5 Concluding remarks . . . 81
3.3 Urbanization patterns in China . . . 83
3.3.1 Evolution of urbanization, 1949-2010 . . . 83
3.3.2 Evidence of urbanization from satellite images . . . 89
3.3.3 Urbanization: China versus other countries, 1950-2050 . . . 99
3.3.4 Cities and urban agglomerations in China . . . 100
3.4 Administrative hierarchy (xingzhengquhua,行政区划) in China . . . 110
3.4.1 Evolution of the administrative structure of China . . . 110
3.4.2 The administrative structure of China, 1949-present . . . 113
3.4.3 Shengji divisions (省级行政区) . . . 115
3.4.4 Diji divisions (地级行政区) . . . 118
3.4.5 Xianji divisions (县级行政区) . . . 123
3.4.6 Xiangji divisions (乡级行政区) . . . 126
3.5 The household registration (hukou, 户口) system in China . . . 129
3.5.1 Early implementation . . . 129
3.5.2 The conversion of hukou status and the effect on internal migration . . . 131
3.5.3 Reforms of the hukou system . . . 132
3.5.6 Impact of the hukou system on the process of urbanization and
rural-urban differences . . . 139
3.6 Conclusion . . . 144
4 The Case of Sichuan and Chongqing, 2000-2010 147 4.1 Introduction . . . 147
4.2 Background . . . 150
4.2.1 Sichuan: Some historical background . . . 150
4.2.2 Development of Chongqing Shi and Chengdu Shi . . . 159
4.2.3 The promotion of Chongqing Shi in 1997 . . . 162
4.2.4 The formation of Chongqing Zhixiashi . . . 165
4.2.5 The administrative structures of Sichuan Sheng and Chongqing Zhixiashi 168 4.2.6 Social and economic structures of Chongqing Shi and Chengdu Shi . . . 179
4.3 Photos from a recent field trip to Sichuan . . . 184
4.4 Using e-Geopolis to estimate urban population statistics in China: Some practical issues . . . 192
4.4.1 The problems of Chinese official urban population statistics revisited . . 192
4.4.2 Challenges of using e-Geopolis in the Chinese context . . . 199
4.5 The urbanization of Sichuan and Chongqing, 2000-2010 . . . 202
4.5.1 Urban agglomerations in Sichuan Sheng . . . 202
4.5.2 Urban agglomerations in Chongqing Zhixiashi . . . 207
4.5.3 Comparing the Chengdu and Chongqing agglomerations . . . 212
4.5.4 Urbanization, economic development, and migration . . . 215
4.6 Conclusion . . . 224
5 Conclusion 227
According to the 2012 version of the China Statistics Yearbook published by the National Bureau of Statistics of China, the share of the Chinese population residing in urban areas has been increasing for the past several decades; for the first time in 2011, the urbanization rate of China exceeded 50%. Being a country with the largest population in the world and the second largest economy after the United States, China’s urbanization has attracted a lot of attention from researchers in different disciplines and international organizations. They are interested in a number of different issues about China’s urbanization, such as the underlying mechanisms of urbanization, the migration patterns, the institutions that facilitate or deter the realization of urbanization, the relationship between urbanization and economic development or the relationship between urbanization and the environment.
The problem of measuring urban population
To answer questions concerning the urbanization of a city or a country, we need to know how urbanized the city or the country studied is. Therefore it is important for us to have access to high-quality population data. At the international level, researchers often make use of the urban population statistics obtained from the World Urbanization Prospects, a report compiled by the Department of Economic and Social Affairs, Population Division of the United Nations. Strictly speaking, the World Urbanization Prospects is not an original data source; instead, it is just a recollection of the urban population statistics provided by the national statistical agencies of different countries. For example, the Chinese population statistics are provided by the National Bureau of Statistics and the French population statistics are provided by the Institut National de la Statistique et des Études Économiques.
Since different countries may use different definitions of “urban population” or the same country may revise the definition over time, it is difficult if not impossible to use the ur-ban population statistics in the World Urur-banization Prospects to compare the urur-banization trends across different countries and over time. Other similar international urban population databases also suffer from the same data problem. This data problem has raised the concern about the accuracy and the comparability of different urbanization studies. More importantly, the use of these data may lead to wrong conclusions and policy implications for government officials.
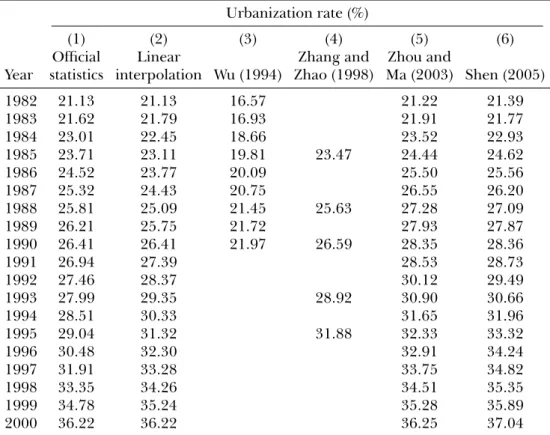
The above problem of measuring urban population also exists in China. In fact, com-pared with other countries, measuring urban population in China is even more complicated because of at least three additional issues. First, there are different definitions of populations, including household registration (hukou or huji) population (户籍人口), resident population (changzhurenkou, 常驻人口), and census populations (pucharenkou, 普查人口). In population censuses, the concept of “urban population” is properly defined according to different criteria. For non-census years, “urban population” is defined more informally. For instance, according to China Statistics Yearbook, “urban population” refers to the people residing in cities and towns while “rural population” refers to the population other than urban population. Apart from this simple description, there is no further explanation about how urban population is actually calculated. When “urban population” statistics cannot be found in official statistics yearbooks, some researchers take the non-agricultural population as an estimate of the de jure urban population. It is because the non-agricultural population counts the number of people who have the non-agricultural hukou status, and most of these hukou holders live in urban ar-eas. However, strictly speaking, “urban population” and “non-agricultural population” are not directly comparable.
Second, different definitions of “urban populations” are used in different population cen-suses. Consider the two most recent population censuses in 2000 and 2010. The definitions of “urban population” were similar in the sense that, in terms of spatial coverage, the basic unit for counting urban population was urban districts with population density over 1,500 persons per square kilometre; in areas with density below 1,500 persons per square kilometre, the basic units for counting urban population were townships (xiang, 乡), towns (zhen, 镇), and streets (jiedao,街道). Nevertheless, there was a slight difference between the definitions of “urban pop-ulation” used in the two censuses: The 2010 Population Census included all urban residents meeting the criterion for the 2000 Population Census, plus the residents living in villages or towns in outer urban and suburban areas that were directly connected to municipal infrastruc-ture and receive public services. Given the different definitions of urban population, we cannot directly compare the urban population statistics obtained from these two censuses.
Third, administrative boundaries of geographical units often change. One example, which will be examined in greater details later, is the promotion of Chongqing Shi from a prefecture-level city (dijishi,地级市) to a centrally-administered city (zhixiashi, 直辖市) in 1997. The change in administrative hierarchy was coupled with the inclusion of two cities and one district from Sichuan Sheng (namely, Wanxian Shi, Fuling Shi, and Qianjiang Qu). When these units were merged into the “Old” Chongqing Shi to form the “New” Chongqing Shi, there was a large
yet mechanical increase in total land area and population: Land area increased from 23,000 square kilometres to 82,000 square kilometres; total population increased from about 15 mil-lion to over 30 milmil-lion. In such a case, it would not be meaningful to compare the urbanization rate of Chongqing Shi in 1996 (i.e., the “Old” Chongqing Shi) and that of Chongqing Shi in 1997 (i.e., the “New” Chongqing Shi). It would also not be meaningful to compare the urbanization patterns of Chongqing Shi and another city, say Chengdu Shi, before and after Chongqing Shi’s promotion. Indeed, changes of administrative boundaries are also observed at a more microscopic level. For example, some county-level divisions (xianji xingzhengqu,县级 行政区) were converted from counties (xian, 县) to county-level cities (xianjishi, 县级市) with ad-ditional land areas. Therefore, strictly speaking these divisions before and after the conversion were different.
These three additional issues make the estimation of urban population and comparison of such statistics over time much more challenging. Nevertheless, some researchers have pro-posed various methods of revising the official urban population statistics so as to compute a set of comparable urbanization statistics over time. These methods are based on linear interpola-tion or assumpinterpola-tions about changes in urban and rural populainterpola-tions. However, the accuracy of these revised urban population statistics relies on the validity of the methods or assumptions used. Even if these assumptions are valid, the revised urban population statistics still may not be able to be compared with other international urban population statistics. Therefore, studies of China’s urbanization based on these official statistics (either “urban population” or “non-agricultural population”) or the revised versions of these statistics can be problematic, and we need to be cautious when we interpret the findings and policy suggestions of these studies.
Using e-Geopolis to estimate urban population
To overcome the problems of measuring and comparing urbanization data in different countries, François Moriconi-Ebrard created the Geopolis database in the 1990s, which is fur-ther updated and is now under a new name, e-Geopolis.1 It is by far the most comprehensive
urban population database among existing databases in terms of its historical scope, its geo-graphical scope, and its level of completeness.
The main idea of e-Geopolis is to use a harmonized definition of urban agglomerations in order to produce urban population statistics that are comparable across countries and over time. Human geographers consider an urban agglomeration as a dense contiguous set of 1Throughout this thesis, we will use the terms “Geopolis” and “e-Geopolis” interchangeably unless otherwise
built-up areas. Under e-Geopolis, contiguity is defined using a threshold of 200 metres between buildings, except for water bodies crossed by bridges, parks and major transport infrastructure (such as highway junctions, car parks, and airports, etc.). An agglomeration is considered as urban if the total population of the local units it covers exceeds 10,000 inhabitants. Therefore, an e-Geopolis urban agglomeration may be a rural area or an urban area according to the official definition of urban area used by the country where the agglomeration is located.
e-Geopolisrequires three kinds of data in order to estimate urban population: Population censuses, gazetteers or maps, and satellite images. The estimation of urban population com-prises three basic stages. First, data from population censuses are mapped with geographical coordinates from a database that contains the local units. The populations of these local units are estimated for harmonized dates based on census data. Second, the land surface is systemat-ically analyzed to identify all the agglomerations. Urban perimeters are digitized using recent satellite images (such as Google Earth) of the agglomerations. Third, the polygons so obtained are then superimposed on the database that contains the local units’ geographical coordinates with their names and population figures.
By applying the same method in different countries, we can estimate urban population statistics in a consistent way so that these statistics are comparable across countries and over time, irrespective of the actual definitions of “urban population” used by the countries studied.
Focus of this thesis
A large body of research on China’s urbanization has focused on the urbanization process of China at the national level. However, China is a large country with a land area over 9 million square kilometres and a population over 13 billion inhabitants. It is reasonable to expect that inequality exists across different parts of the country (such as between coastal and inland areas), in terms of social and economic development. Therefore, to the extent that urbanization of a region is related to its social and economic structure, one would expect that there are huge regional differences in urbanization, migration, and economic development. Unfortunately, national-level studies are unable to provide insights for us to understand these issues.
In the extant literature, few researchers have studied China’s urbanization at the sub-national level. One of the main reasons is the lack of high quality data on urban population statistics due to the changing definitions of urban population and urban administrative areas over time. Without high quality data, it would be difficult for researchers to draw conclusions about the relationship between urbanization and other related issues at the sub-national level.
Chongqing Zhixiashi and Sichuan Sheng, two shengji divisions located in the southwestern part of China. We will also compare the urban agglomerations of these two units, including their respective largest agglomerations, namely, the Chongqing agglomeration and the Chengdu agglomeration. This comparison serves the purpose of uncovering new trends of urbanization in these two units and illustrating how the novel way of measuring urban population statistics by e-Geopolis can be used in the context of China.
There are two main reasons why we focus on the agglomerations in Chongqing Zhixiashi and Sichuan Sheng. The first reason is about their complicated historical, economic, and po-litical backgrounds. Chongqing Shi and the provincial capital of Sichuan Sheng (i.e., Chengdu Shi) are the two largest cities in the southwestern part of China. These two cities had long histories and had been the political and economic centres of the region for a long period of time. The importance of Chongqing Shi was further emphasized after its promotion in 1997 to Chongqing Zhixiashi, with the equivalent status as a sheng in the administrative hierarchy of China. In the initial years since the economic reform era began in 1978, the central govern-ment put more emphasis on the developgovern-ment of such coastal areas as Guangdong Sheng and Zhejiang Sheng while the inland provinces received less attention. Since Chongqing Shi and Chengdu Shi were situated in the western part of China, they and other inland areas did not enjoy much from the early economic reforms in China. One impact was that a lot of the people from Sichuan Sheng and Chongqing Shi migrated to the coastal provinces to seek better job opportunities. Only after 2001 when the government introduced the so-called “Open Up the West” campaign did we see a reduced development inequality between the western part and other coastal areas. Chongqing Zhixiashi and Sichuan Sheng together had been one of the most populated areas in China. As of 2010, the combined population of Chongqing Zhixiashi and Sichuan Sheng was about 109.26 million, or about 8.16% of the total population in China. The income inequality between Chongqing Zhixiashi and Sichuan Sheng (at least before the “Open Up the West” campaign) and other coastal areas encouraged the workers there to mi-grate to other higher-income areas. Between 1995 and 2010, the total migrants moving out of Chongqing Zhixiashi and Sichuan Sheng were over 15 million. However, in the presence of the hukou system, people could not migrate freely across the country, especially from rural areas to urban areas. Therefore, the urbanization of Chongqing Zhixiashi and Sichuan Sheng is related to not only the industrialization of these two regions, but also the administrative hi-erarchy and the hukou system. Understanding the urbanization patterns of the agglomerations in Chongqing Zhixiashi and Sichuan Sheng against such a complex background by itself is an interesting research question.
The second reason is more of a practical issue. While e-Geopolis uses a standardized way to estimate urban population and in principle it can be used in different countries to obtain comparable urban population statistics, its application in the Chinese context is not straight-forward. Our estimation of e-Geopolis urban population statistics is based on the official pop-ulation statistics at the township-level divisions (xiangji xingzhengqu,乡级行政区) in the 2000 and 2010 Population Censuses. One great challenge for our estimation is that there were many changes in the number of xiangji division and the compositions of townships (xiang,乡), towns (zhen,镇), and streets (jiedao, 街道) over time. The changes in the xiangji divisions during this period can be classified into different types, involving cancellation, merging, or renaming of existing divisions or creation of new divisions. These changes complicate the estimation of ur-ban population in e-Geopolis because we have to check carefully these changes in order to link the 2000 and the 2010 xiangji divisions to generate consistent urban population statistics in these two census years. While many of these changes were promulgated through government documents which in general can be found in the internet, there are cases in which online gov-ernment documents cannot be located so that secondary sources have to be consulted. Given the complexity of the changes in xiangji divisions and the time required for a thorough manual check for the consistency of the official population data from the 2000 and 2010 Population Censuses, we will mainly focus on the larger agglomerations (with population above 200,000 inhabitants as of 2010) in Sichuan Sheng and Chongqing Zhixiashi. We will also do a more elaborated comparison of the Chongqing agglomeration and the Chengdu agglomeration to illustrate how the e-Geopolis method is used in the Chinese context.
Two important institutions that affect China’s urbanization
To understand the urbanization of Sichuan Sheng and Chongqing Zhixiashi requires some background knowledge about two important institutions, namely the administrative hierarchy (xingzhengquhua,行政区划) and the household registration (hukou, 户口) system.
The administrative hierarchy system has strong effects on the development of local ter-ritorial units in the country. Under the system, a terter-ritorial unit can only directly interact with those that are immediately above or below it in the administrative hierarchy, and a lower-ranked unit is a “subordinate” to the unit above it. As a result, a local county, for instance, can only interact with the central government by going through all the superior units. The rank of a place or a unit in the administrative hierarchy affects how it can carry out its social, economic, and political functions. Generally speaking, the higher a unit rises along the
admin-reform era, the local governments have strong incentives to upgrade themselves in order to enhance their economic growth. As urbanization is closely related to economic development, the administrative ranking of a city has a great influence on its urbanization process.
On the other hand, the hukou system of China is designed to restrict the mobility of people across the country, especially from rural areas to urban areas, in order to fulfill the different political and economic needs of the government. It is operated by requiring that all internal migrations be subject to approvals from the local authorities at the destinations. This sys-tem therefore greatly affects the urbanization process since after all, urbanization is realized through the migration of people from rural areas to urban areas.
These two systems are particularly relevant for our discussions of the urbanization of Sichuan Sheng and Chongqing Zhixiashi because before 1997, Chongqing Shi was part of Sichuan Sheng. Both of Chongqing Shi and Chengdu Shi (the provincial capital of Sichuan Sheng) were dijishi in the administrative hierarchy. After 1997, Chongqing Shi was separated from Sichuan Sheng and promoted as Chongqing Zhixiashi, with a status equivalent to a sheng in the administrative hierarchy. Such a change inevitably affected the division of administra-tive powers and economic developments of Sichuan Sheng and Chongqing Zhixiashi. On the other hand, Chongqing Zhixiashi and Sichuan Sheng were inland regions and did not enjoy the initial successes of the economic reform. A lot of the people from these regions migrated to coastal regions to seek better job opportunities. However, under the hukou system, the mobility of these migrants was affected, especially when they moved from rural areas to urban areas. Therefore, the urbanization of Sichuan Sheng and Chongqing Zhixiashi was related to not only their industrialization but also the administrative hierarchy and the hukou system, and thus it is necessary to understand some background information about these two special institutions.
Summary of the main results
Using the urban population statistics from e-Geopolis, we uncover new trends of urbaniza-tion in Chongqing and Sichuan. Specifically, we identify 10 urban agglomeraurbaniza-tions in Chongqing Zhixiashi and another 18 urban agglomerations in Sichuan Sheng, each of which had a pop-ulation over 200,000 inhabitants in 2010. Among them, the Chongqing agglomeration and the Chengdu agglomeration were the largest. We first compare the agglomeration population estimated by e-Geopolis and the official urban population statistics published by the National Bureau of Statistics in 2000 and 2010. We find that, except for Chengdu agglomeration in 2010, there were huge differences between the two sets of urban population statistics for the other agglomerations: There were cases of both over-estimation and under-estimation, and
in some cases the differences were quite substantial. Moreover, based on the e-Geopolis urban population statistics, we found that the primacy index at shengji is higher. This situation can be explained by the concentration of capital in a labor-intensive economy where economies of agglomerations can reduce the costs of production. However, we cannot see the same pat-terns when we use the urban population statistics provided by the official statistical agency, the National Bureau of Statistics. This comparison suggests that the official population statistics at the sub-national level can be misleading. Therefore the findings by the studies using these sub-national urban population statistics should be interpreted with cautions. In a broader perspective, the comparison of the official and e-Geopolis urban population statistics suggest that urbanization studies based on official urbanization data are limited by the administrative boundaries of cities, whereas using e-Geopolis data allows us to uncover new trends of urbaniza-tion of agglomeraurbaniza-tions (rather than “cities”).
Comparing the two major agglomerations in Chongqing Zhixiashi and Sichuan Sheng, the Chongqing agglomeration and the Chengdu agglomeration, we find some differences in the urbanization patterns between them as of 2010. First, the Chengdu agglomeration was larger, in terms of population and agglomeration area, than Chongqing agglomeration. In 2010, the Chengdu agglomeration had a population of about 9,730,000 inhabitants and occupied about 1,411 square kilometres; in contrast, the Chongqing agglomeration had a population of about 5,025,000 inhabitants and had a land area of about 539 square kilometres. While the “heights” of the two agglomerations were roughly the same, the “widths” of the Chengdu agglomeration was more than double that of the Chongqing agglomeration with signs of urban sprawl. (See Figure 1.) In terms of annualized growth rates between 2000 and 2010, the agglomeration population of Chengdu increased by about 3.30% per year while that of Chongqing increased by about 1.93% per year.
Second, within Chongqing Zhixiashi, there were a few other urban agglomerations in its city district (shixiaqu, 市辖区), including the agglomerations of Banan, Wanzhou, Yongchuan, Fuling, Hechuan, and Cheng Jiang (which was within Beibei Qu). On the other hand, within the administrative boundaries of the Chengdu Shi, there was only one other urban agglomera-tion in Chengdu Shi’s city district, which was Pengzhou. In other words, the urban populaagglomera-tion within the official administrative boundary of Chengdu Shi was more concentrated within two large agglomerations whereas the urban population within the official administrative boundary of Chongqing Zhixiashi was distributed among several large agglomerations.
Third, we also use the e-Geopolis urban population statistics to examine the relationship between urbanization, economic development, and migration. Our analysis suggested that
Figure 1: Chongqing and Chengdu agglomerations on a map with the same scale
Source: e-Geopolis.
the larger urban agglomerations did not necessarily have larger GDP or secondary sectors. Specifically, the Chongqing agglomeration, being smaller than the Chengdu agglomeration, had a larger GDP as well as a larger secondary sector. On the other hand, faster growing urban agglomerations seem to attract more external migrants.
Outline of this thesis
Chapter 1is a review of the related literature. In this chapter, we will first discuss some
theories of urbanization and international patterns of urbanization. We then discuss a few international urban population databases that are commonly used by researchers, including the World Urbanization Prospects and Global Rural-Urban Mapping Project. These databases are problematic in the sense that they are unable to provide reliable and consistent urban population statistics across countries and over time.
In Chapter 2, we will explain the background and the methodology of the e-Geopolis, an approach which can overcome the problems of measuring and comparing urban population statistics. We will use the urban population statistics estimated by e-Geopolis for our analysis in Chapter 4.
In Chapter 3, we will discuss a number of background issues and patterns related to the urbanization in China. Apart from discussing the problems of measuring urban population in the Chinese context, we will also discuss two institutional features of China that affect the
urbanization process, migration, and city growth, namely the administrative hierarchy and the household registration (hukou) system.
In Chapter 4, we will use the e-Geopolis urban population statistics to examine the urban-ization of Sichuan and Chongqing between 2000 and 2010. We will first discuss the history and geography of Sichuan and the social, economic, and administrative structures of Chongqing Shi and Chengdu Shi. We will then discuss some practical issues related to the application of
e-Geopolisin the Chinese context. Next, we will present results about the urban agglomerations in Sichuan Sheng and Chongqing Zhixiashi, and focus the attention on the two largest urban agglomerations, the agglomerations of Chengdu and Chongqing. We will also use the urban population statistics estimated by e-Geopolis to examine the relationship between urbanization, economic development, and migration for the urban agglomerations in Sichuan Sheng and Chongqing Zhixiashi.
Finally, Chapter 5 will summarize the results of this thesis. We will also discuss some limitations of our analysis and discuss some possible future extensions.
Literature Review
1.1. Introduction
Urbanization is the process in which there is an increasing number of people living in urban areas. This phenomenon is strongly linked to income growth and industrialization of the urban areas. In a standard urbanization model, the higher firm productivity and wages in urban areas are usually accompanied by an expansion of the urban populations because workers in rural areas usually get lower wages and they are attracted to the cities to work for more productive and better paid firms. The initial stages of industrialization often appear in larger cities rather than remote rural districts because the former usually have better infras-tructure or better access to the international market. However, at a later stage when the initially larger cities grow even larger, the industrial activities usually move to the nearby satellite cities where the firms can reduce the labor and land costs. In Chapter 1.2 we will review several theories of urbanization which have been used by geographers, sociologists, political scientists, and economists. These theories include the modernization theory, the dependency theory, the urban bias theory, and the dual-sector and rural-urban migration models. While these theories focus on different aspects and are based on different assumptions, one common implication is that as the urban areas become more developed, rural-urban differences will be created, attracting rural workers to migrate to the urban areas and resulting in increased urbanization. How do these theories of urbanization explain the actual urbanization patterns? In Chap-ter 1.3, we will present some inChap-ternational patChap-terns of urbanization, including the relationship between urbanization and economic development, the evolution of world urbanization, and changes in urban agglomerations. Based on the urbanization data extracted from the World Urbanization Prospects (The 2011 Revision) — a report compiled by the Department of Eco-nomic and Social Affairs, Population Division of the United Nations (2012), we do observe a positive relationship between urbanization and economic development (measured by GDP per capita). Besides, we observe an upward trend of urbanization between 1950 and 2010 in the world as regions of different levels of economic development. These trends are expected to persist in the next four decades.
The data contained in the World Urbanization Prospects are based on the population statistics provided by the national statistical agencies in different countries and therefore it is
not a data source by itself but is just a recollection of data.2 Other than the World
Urbaniza-tion Prospects, a number of internaUrbaniza-tional urban populaUrbaniza-tion databases have been constructed and used by researchers in different disciplines. In Chapter 1.4, we will briefly discuss these databases. First, we will review some urbanization databases mainly used by historians and geographers, including Davis (1969), Chandler and Fox (1974), De Vries (1984), and Bairoch, Batou, and Chèvre (1988). We will then discuss two other more recent international urban population databases: Apart from the World Urbanization Prospects, we also discuss the Global Rural-Urban Mapping Project (GRUMP) by the Center for International Earth Science Infor-mation of the Columbia University. Finally, we will discuss a few population databases created by French researchers.
Although different urban population databases are available for use by researchers, studies using these different databases are usually not comparable. There are several issues compli-cating the comparison of studies using urbanization data from these different sources. For example, what is the unit of analysis? Some researchers prefer to use the “city” as the basic unit while some others prefer “urban agglomerations” or “metropolitan area.” Another exam-ple is about the definition of “urban” and “rural” areas. The different definitions of the basic unit of analysis suggest that cross-country comparisons of urbanization data are difficult if not impossible. In Chapter 1.5, we will also discuss the problems of measuring and comparing urban population data in greater details.
1.2. Theories of urbanization
There is a large literature examining the causes and dynamics of urbanization. Here we review several types of theories used by geographers, sociologists, political scientists and economists, including the modernization theory, the dependency theory, the urban bias the-ory, and the dual-sector and rural-urban migration models. These theories are useful in un-derstanding the urbanization experience of developing countries such as China.3
1.2.1. Modernization theory
The modernization theory of urbanization emphasizes the evolutionary nature of cities. This theory is based on three main assumptions. First, the development and urbanization of any given society is closely related to the situation of the society at the beginning of the modernization process. Second, compared with the society’s social organization, technology is a more important determinant of urbanization. Third, cultural diffusion will lead to an eventual convergence in the urbanization patterns in the developed and developing countries, even though it may create uneven development.
While this theory allows for the constraints that were in place prior to the beginning of modernization or other social or cultural differences, it also takes the view that technology can possess a systematic logic that can override the original forms of social organization and set up a new institutional matrix (Kerr et al., 1960; Hawley, 1980).
According to this theory, urbanization is not possible without industrialization (Berliner, 1977). As the society becomes more modernized, there are systematic changes in different aspects of the society such as values and infrastructures. For the developing countries, due to the lack of resources at the initial stages of modernization, emphasis of the development can only be put in one or a few larger cities (Alonso, 1980). Therefore, there are relatively fewer opportunities in rural areas than in the larger cities targeted for development. As a result, rural-urban differences are created and attract people in rural areas to migrate to cities. Al-though the rural migrants may create a burden to the cities in terms of infrastructure, housing, employment, and social services, this theory treats such conditions as temporary; as modern-ization continues, there will be better integration among different regions which eventually will smooth the course of social changes.
1.2.2. Dependency theory
A limitation of the modernization theory is its failure to account for the conditions and consequences of urbanization, especially the underdevelopment problem (e.g., Frank, 1967; Wallerstein, 1974, 1980). An alternative theory, known as the dependency theory of urbaniza-tion, was proposed. This theory has three main assumptions. First, a unique capitalist develop-ment pattern exists. Second, capitalism requires a certain type of social structure characterized by unequal exchange, uneven development, individual inequality, core-periphery hierarchies, and dominance structures. Third, social organization, technology, and population dynam-ics are endogenous facts in development and urbanization and are constrained by exogenous forces (Timberlake, 1987).
According to this theory, the structures and the processes of capitalism are viewed as the prime causes of the social changes. This pattern can in general be observed in the developing countries. For example, over-urbanization in developing countries are due to such activities as capital-intensive manufacturing owned by foreign investors and enclosure of farm lands for the production of goods exclusive for exports. Therefore, the developed countries and the developing countries are connected through a network where the former countries take advantage of the latter countries. Besides, within the developing countries, the development is skewed in such a way that it can reinforce the highly unequal social structure demanded by the capitalist systems in developed countries (e.g., Cohen, 1981; Douglass, 1988). It will lead to job creation in the urban areas in the developing countries. As a result, rural workers are attracted to the urban areas to fill up these positions.
1.2.3. Urban bias theory
Another approach to understanding the urbanization process is the urban bias theory, pioneered by Lipton (1977). This theory focuses more on political considerations rather than economic considerations. It is based on three basic assumptions. First, the political institutions are more powerful than the economic and other institutions in determining the development of a country. Second, coalitions are organized to exert pressure on the government or to dominate its composition in order to influence the legal system which in turns help divert resources to the members of the coalitions. Third, such kind of coalition building can exist in any kind of economic regime.
According to Lipton (1977), the elites of the developing countries rely heavily on the ur-ban resources and they will prefer policy initiatives that favor the development of urur-ban areas at the expense of the rural areas. They achieve their goals through either political
represen-tatives lobbying the government officials or directly participating by becoming government officials themselves. Such urban bias policy initiatives can take many forms. For example, the government may reduce the price for food and other rural inputs so that the urban sectors are subsidized by the rural sectors. Or the government may invest capital on the provision of facilities located in urban areas, although a larger share of the population is in the rural areas. Given the difference in terms of standards of living between the rural and urban areas, people in rural areas tend to migrate to urban areas.
1.2.4. Dual-sector and rural-urban migration models
The dual-sector and rural-urban migration models are two urbanization models that are popular among economists. They focus on the impact of differential income between the rural and urban sectors, which give incentives for workers from the rural areas to migrate to the urban areas. Therefore, these models suggest that there is a close relationship between economic development and urbanization.
The dual-sector model, first proposed by Lewis (1954) and is further extended by Ranis and Fei (1961), is characterized by an under-developed economy consisting of two sectors: A rural agricultural sector and an urban industrial sector. The agricultural sector has a larger population and the wages and productivities are lower. In contrast, the industrial sector has a smaller population but firms have higher productivities and can offer higher wages to the workers. Since the wages of the urban industrial sector are higher than the wages of the rural agricultural sector, the industrial sector can attract workers from the agricultural sector.
Lewis (1954) assumes that there is a surplus of labor in the agricultural sector so that when workers leave the sector, there will be no effect on the output of the agricultural sector and the wages of the remaining workers. Lewis further assumes that firms in the urban industrial sector re-invest the profits into production capital. When the production scale is expanded, the urban industrial sector will require extra workers from the agricultural sector. Therefore, the rural-urban migration and the expansion of the rural-urban industrial sector continue until all the surplus workers in the rural agricultural sector have been absorbed by the urban industrial sector. This point is known as the “Lewis turning point.” After that, when additional rural workers move to the urban industrial sector, the output and the wages of the agricultural sector will be affected. While the Lewis dual-sector model is simple, it is still often used to examine the urban-ization experience in China and other developing countries because these countries usually have large rural sectors.4 The main limitation of the Lewis dual-sector model is that it cannot
explain the evidence in the past several decades that rural workers continue to migrate into urban areas even despite the increasing levels of unemployment and under-employment in the urban areas. To explain this phenomenon, another class of models, known as rural-urban migration model and proposed by Todaro (1969) and Harris and Todaro (1970), have been developed. In these models, workers in rural areas have the incentives to move to the urban areas in response to expected rural-urban income differences. They will consider different la-bor market opportunities available in the different sectors and choose one that maximizes the expected gains. These models can also incorporate non-financial costs and benefits of migra-tion into the workers’ decisions. For example, psychological consideramigra-tions may be relevant: When the rural workers migrate to the urban areas, they can enjoy the better amenities and infrastructure in the urban areas; yet at the same time there is a risk that they cannot adjust themselves fully into to urban society.
These models assume that the migration decisions of the workers are based on a cal-culation of long-term incomes. For example, a rural worker may not be able to find a job immediately after migrating to the urban area; but if she expects that she can get a job soon and her future incomes can rise over time, then she may still want to migrate because the total expected income after migration can still be higher than the total expected income she could otherwise get in the rural sector. These models suggest that the growth of the urban labor market can fall short of the growth of rural-urban migration because the decision to migrate depends on expected rather than actual rural-urban income differentials. In particular, these models can explain that rural-urban migration is possible even though there is unemployment or under-employment in the urban sector.
1.3. International patterns of urbanization
After discussing briefly some theories of urbanization, let us examine some international patterns of urbanization, including the relationship between urbanization and economic de-velopment, the evolution of urbanization in different regions of the world by their levels of development, and the changes in the number of urban agglomerations and the population living within these agglomerations over time.
Before we proceed, we would like to point out a caveat in the urbanization data we use in this section. A prerequisite for a meaningful analysis of urbanization patterns is the use of comparable urbanization data. For instance, if we want to examine the urbanization patterns of two countries at two different points in time, then the definitions of “urban population” need to be identical in these two countries across the two different time periods. Otherwise, comparing the urbanization rates between these two countries, or within the same country over time, will not be accurate.
Some of the discussions in this section are based on the urbanization data extracted from the World Urbanization Prospects (The 2011 Revision), compiled by the United Nations De-partment of Economic and Social Affairs/Population Division (DESA). The urbanization data in this report come from the most recently available census or official population estimate provided by the statistical office of each country. As recognized by DESA, the quality of the urbanization data depends on the accuracy of the official data as well as the definitions of ur-ban and rural areas. Since the definitions of urur-ban population can vary country by country, the urbanization data contained in the World Urbanization Prospects may not be reliable.5
There-fore, the trends and patterns of urbanization presented in this section that are based on these urbanization data have to be interpreted with caution.
As will be discussed in greater detail in Chapter 2, a better way of measuring urban pop-ulation is to use the e-Geopolis database developed by François Moriconi-Ebrard. Since the
e-Geopolis database uses a harmonized definition of urban agglomeration and urban popula-tion, we can estimate urban population in different countries in a consistent manner so that these data can be comparable across countries and over time, irrespective of the actual defi-nitions of “urban population” adopted by individual countries. We will present more results based on the urbanization data from e-Geopolis in Chapter 2.
5See the Methodology of the World Urbanization Prospects (The 2011 Revision), available at http://esa.un.org/
1.3.1. The relationship between urbanization and economic development
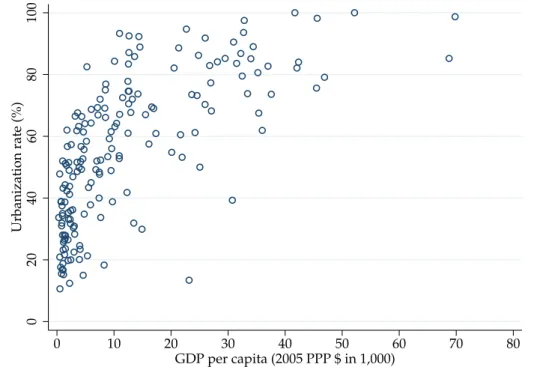
Standard theories of urbanization suggest a positive relationship between urbanization and economic development. Do we observe this relationship from the data? We present evi-dence along two different but related dimensions. A commonly used indicator for a country’s economic development and standard of living is GDP, which stands for Gross Domestic Prod-uct. It measures the monetary value of final goods and services produced in a country in a given period of time.6
In Figure 1.1 we show the urbanization rates and GDP per capita (in 2005 purchasing power parity dollars) for different countries around the world in 2010. The urbanization data come from the World Urbanization Prospects (The 2011 Revision) and the GDP data come from the World Development Indicators 2012 compiled by the World Bank. This figure shows a clear positive relationship between urbanization rate and GDP per capita. In countries with higher income per capita, the shares of urban population are also higher.
Figure 1.1: The relationship between urbanization rate and GDP per capita in 2010
0 20 40 60 80 100 Urbanization rate (%) 0 10 20 30 40 50 60 70 80 GDP per capita (2005 PPP $ in 1,000)
Source: GDP per capita (in constant 2005 purchasing power parity dollars): World Development Indicators 2012; Urbanization rate: World Urbanization Prospects, The 2011 Revision.
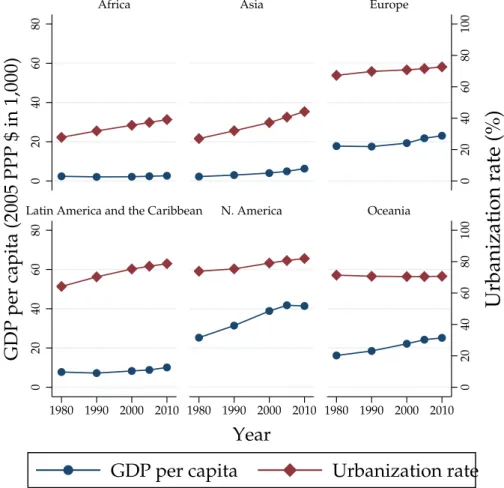
Figure 1.1 only shows the relationship between income per capita and urbanization rate in a single year. Does this relationship change over time? In Figure 1.2, we further exam-6There are different ways of counting GDP, including the production approach, the expenditure approach, and
ine the relationship between urbanization and GDP per capita along a different dimension. Specifically, we examine this relationship in different countries, over time (in several selected years between 1980 and 2010) and by regions (including Africa, Asia, Europe, Latin America and the Caribbean, North America, and Oceania). The urbanization and GDP data also come from the World Urbanization Prospects (The 2011 Revision) and the World Development In-dicators 2012 respectively. Among these regions, North America and Europe have the highest GDP per capita and they also have higher urbanization rates. In the other extreme, Africa and Asia have both low GDP per capita and urbanization rates. Interesting, in Latin America and the Caribbean, the GDP per capita is relatively low and is similar to the level of Asia but the urbanization rate is much higher than that of Asia.
Figure 1.2: The relationship between urbanization rate and GDP per capita by regions, 1980-2010 0 20 40 60 80 100 0 20 40 60 80 100 0 20 40 60 80 0 20 40 60 80 1980 1990 2000 2010 1980 1990 2000 2010 1980 1990 2000 2010
Africa Asia Europe
Latin America and the Caribbean N. America Oceania
GDP per capita
Urbanization rate
Urbanization rate (%)
GDP per capita (2005 PPP $ in 1,000)
Year
Source: GDP per capita (in constant 2005 purchasing power parity dollars): World Development Indicators 2012; Urbanization rate: World Urbanization Prospects, The 2011 Revision.
The trends in these two figures suggest that there is a strong positive link between eco-nomic development and urbanization over time and across different countries.
1.3.2. The evolution of world urbanization
Next, we examine the evolution of urbanization of the world and different regions by their levels of economic development between 1950 and 2050.
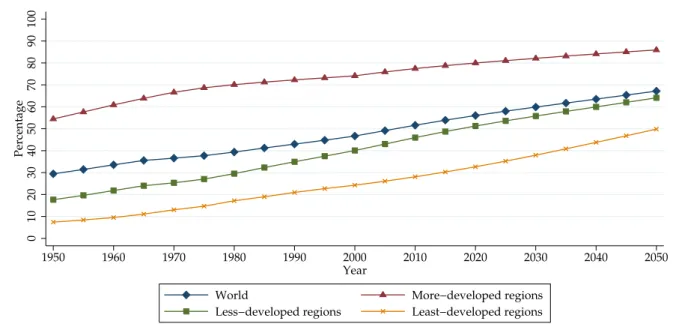
In Table 1.1 we report the urbanization rates of the world and different regions between 1950 and 2050, obtained from the World Urbanization Prospects (The 2011 Revision). The data between 1950 and 2010 are actual data provided by the national statistical offices of dif-ferent countries, and those data between 2010 and 2050 are the projections estimated by the United Nations. These data are also visualized in Figure 1.3.
Table 1.1: Urbanization rates of the world and by regions of different levels of economic development, 1950-2050
More Less Least
Developed Developed Developed
Year World Regions Regions Regions
1950 29.4 54.5 17.6 7.4 1955 31.4 57.7 19.6 8.4 1960 33.6 60.9 21.8 9.5 1965 35.5 63.9 24.0 11.1 1970 36.6 66.6 25.3 13.0 1975 37.7 68.7 27.0 14.7 1980 39.4 70.1 29.5 17.2 1985 41.2 71.3 32.3 19.0 1990 43.0 72.3 34.9 21.0 1995 44.8 73.2 37.5 22.7 2000 46.7 74.1 40.1 24.3 2005 49.1 75.9 43.0 26.1 2010 51.6 77.5 46.0 28.1 2015 53.9 78.8 48.7 30.3 2020 56.0 80.0 51.3 32.7 2025 58.0 81.1 53.6 35.2 2030 59.9 82.1 55.8 38.0 2035 61.7 83.1 57.9 40.8 2040 63.5 84.1 60.0 43.8 2045 65.3 85.0 62.0 46.8 2050 67.2 85.9 64.1 49.8
Source: World Urbanization Prospects, The 2011 Revision.
In the table and the figure, the more developed regions comprise Europe, Northern Amer-ica, Australia, New Zealand and Japan; the less developed regions comprise all regions of Africa, Asia (excluding Japan), Latin America and the Caribbean plus Melanesia, Micronesia and Polynesia; the least developed countries are 48 countries, 33 in Africa, 9 in Asia, 5 in Oceania plus one in Latin America and the Caribbean.7
7These least developed countries are defined by the United Nations General Assembly in its resolutions (59/209,
59/210, 60/33, 62/97, 64/L.55) and include Afghanistan, Angola, Bangladesh, Benin, Bhutan, Burkina Faso, Bu-rundi, Cambodia, Central African Republic, Chad, Comoros, Democratic Republic of the Congo, Djibouti,
Equato-Figure 1.3: Urbanization rates of the world and by regions of different levels of economic development, 1950-2050 0 10 20 30 40 50 60 70 80 90 100 Percentage 1950 1960 1970 1980 1990 2000 2010 2020 2030 2040 2050 Year
World More−developed regions
Less−developed regions Least−developed regions
Source: World Urbanization Prospects, The 2011 Revision.
We can observe a number of patterns from the table and the figure. In 1950, the world’s average urbanization rate was 29.4%. There was a huge difference between the urbanization rates of the more developed regions and the least developed regions: Over half of the popula-tion in the more developed regions lived in urban areas while only about 7% of the populapopula-tion in the least developed regions lived in urban areas. Between 1950 and 2010, the world became more and more urbanized. The average urbanization rate of the world increased to 51.6%. The difference between the urbanization rates of the more developed regions and the least developed regions persisted: The urbanization rate of the more developed regions increased to 77.5% whereas that of the least developed regions was 28.1%, which was below the world av-erage in 1950. In the next four decades, urbanization rates of the world and different regions are expected to grow. According to the forecasts by the World Urbanization Prospects, the increase in urbanization rate for the more developed regions is expected to diminish: It will only increase by about 8 percentage points between 2010 and 2050. On the other hand, the urbanization process of the least developed regions will become faster. By 2050, their expected urbanization rate will be 49.8% — an increase of over 20 percentage points from 2010, and close to the world’s average urbanization rate in 2005.
rial Guinea, Eritrea, Ethiopia, Gambia, Guinea, Guinea-Bissau, Haiti, Kiribati, Lao People’s Democratic Republic, Lesotho, Liberia, Madagascar, Malawi, Mali, Mauritania, Mozambique, Myanmar, Nepal, Niger, Rwanda, Samoa, São Tomé and Príncipe, Senegal, Sierra Leone, Solomon Islands, Somalia, South Sudan, Sudan, Timor-Leste, Togo, Tuvalu, Uganda, United Republic of Tanzania, Vanuatu, Yemen and Zambia. Note that these countries are also included in the less developed regions.
1.3.3. Urban agglomerations
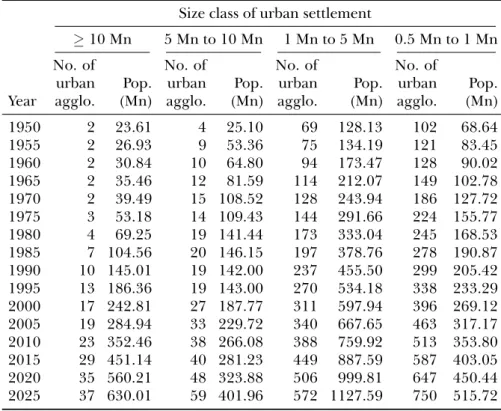
Finally, we examine the international patterns about urban agglomerations. In Table 1.2 we show the total number of urban agglomerations (with population of 0.5 million or above) and the total population living in these agglomerations between 1950 and 2025. These data are obtained from the World Urbanization Prospects (The 2011 Revision). These figures are grouped according to the size classes of the urban settlement.
Note that the definitions of “urban agglomerations” used in different countries may be different. In particular, these urban agglomerations are defined in a different way that those defined by e-Geopolis, and we will show in Chapter 2 the differences. Therefore, we should interpret the statistics in Table 1.2 with caution.
Table 1.2: The number of urban agglomerations and total population living in these agglomerations, 1950-2050
Size class of urban settlement
≥10 Mn 5 Mn to 10 Mn 1 Mn to 5 Mn 0.5 Mn to 1 Mn
No. of No. of No. of No. of
urban Pop. urban Pop. urban Pop. urban Pop.
Year agglo. (Mn) agglo. (Mn) agglo. (Mn) agglo. (Mn)
1950 2 23.61 4 25.10 69 128.13 102 68.64 1955 2 26.93 9 53.36 75 134.19 121 83.45 1960 2 30.84 10 64.80 94 173.47 128 90.02 1965 2 35.46 12 81.59 114 212.07 149 102.78 1970 2 39.49 15 108.52 128 243.94 186 127.72 1975 3 53.18 14 109.43 144 291.66 224 155.77 1980 4 69.25 19 141.44 173 333.04 245 168.53 1985 7 104.56 20 146.15 197 378.76 278 190.87 1990 10 145.01 19 142.00 237 455.50 299 205.42 1995 13 186.36 19 143.00 270 534.18 338 233.29 2000 17 242.81 27 187.77 311 597.94 396 269.12 2005 19 284.94 33 229.72 340 667.65 463 317.17 2010 23 352.46 38 266.08 388 759.92 513 353.80 2015 29 451.14 40 281.23 449 887.59 587 403.05 2020 35 560.21 48 323.88 506 999.81 647 450.44 2025 37 630.01 59 401.96 572 1127.59 750 515.72
Source: World Urbanization Prospects, The 2011 Revision.
Globally, the number of urban agglomerations and the population living in these agglom-erations have increased substantially over time especially in the past 20 years. The changes are summarized as follows. In 1950, there were 177 urban agglomerations. More than half of them were small agglomerations with population between 0.5 million to 1 million (102 or 57.6% of the total number of agglomerations). There were only 2 urban agglomerations with over 10 million population and 4 with populations between 5 million and 10 million.