Simulation Of New Simple Fuzzy Logic Maximum Power Point Tracker For Photovoltaic Array
11
0
0
Texte intégral
(2) H. Serhoud et al.. J Fundam Appl Sci. 2010, 2(1), 98-108. 99. In this paper, an intelligent control technique using fuzzy logic control is associated to an MPPT controller in order to improve energy conversion efficiency.. Principle of maximum power point tracking control The maximum power point tracking (MPPT) method is simple and it is based on the relationship that exist between the load voltage and the open-circuit voltage of PV panel Thus, when a direct connection is carried out between the source and the load, the output of the PV module is seldom maximum and the operating point is not optimal [1]. To overcome this problem, it is necessary to add an adaptation device, MPPT controller with a DC-DC converter, between the source and the load, (Fig. 1).. Load. E DC-DC T. PV D. I. fuzzy MPPT Control. P. V. Fig.1. Basic structure photovoltaic system Solar array mathematic model The equivalent circuit model of a solar cell consists of a current generator and a diode plus series and parallel resistance ,The mathematical equation expressing the output current of single cell is given as Eq. (1). V Rs.I V I .Rs I Icc I 0 e Vth 1 Rsh . (1). for modules or Rsh is assumed infinite, the equation reduces to:. V Rs. I I Icc I 0 e Vth 1 (Vop Rs.Iop Voc ) Vth Iop log(1 ) Icc. I 0 ( Icc Iop ) e. ,. (2) (Vop Rs.Iop 1 Vth .
(3) H. Serhoud et al.. J Fundam Appl Sci. 2010, 2(1), 98-108. 100. Rs Id Rsh. I V. Isc Fig.2. Equivalent circuit model of PV .cell. The adaptation of the Eq.1 to other levels of radiation and temperatures gives: I n I ref I Vn Vref V. Where. I (. E E ) T ( 1) Icc Eref Eref. V T RsI. With: is the coefficient of variation of the current with the temperature is the coefficient of variation of the voltage with the temperature. T T Tref. where: T is the temperature of the module Tref. is the reference temperature. The photovoltaic cell array The fundamental power conversion unit of a PV system is the ‘solar cell’. For practical use, they are usually assembled into modules. About 36 cells are typically interconnected in series in order to give a charging voltage for a 12V battery. For high power requirement, the modules are interconnected in series/parallel to form a DC power producing unit array known as generator, The main characteristics which characterise a PV generator are shown in Fig.3 and it is clearly seen that the I-V output characteristic of a PV module is highly non-linear. It behaves as current source for the low voltage zone and as a voltage source in the high voltage zone. The output power in these regions is far below the optimal values which could be generated if the solar array works around the knee of the I-V characteristic. The characterizing rated values of an array are the short circuit current, open circuit voltage and maximum power as a.
(4) H. Serhoud et al.. J Fundam Appl Sci. 2010, 2(1), 98-108. 101. function of temperature and irradiance. Typical characteristics are shown in Fig.3. for a two parallel-ten series PV module [7]. 800. 1000W/m2 800W/m2 600W/m2 400W/m2 200W/m2. 4.5 4. Current (A). 3.5 3 2.5 2. 700. 1000 W/m2. 600. 600 W/m2. 800 W/m2 400 W/m2. Power (W). 5. 1.5. 500. 200 W/m2. 400 300 200. 1. 100. 0.5 0. 0. 0. 50. 100. 150. 200. 250. 0. 50. 100. 200. 250. Voltage (V). Voltage (V). Fig.3. PV array voltage– current at 25° at different irradiance levels.. Fig.4. PV array voltage–power at 25° at different irradiance levels. 5.5. 600. 100°-1000w2. 75°-800w2. 4.5. 50°-600w2. 50°-600w2. 4. 25°-400w2. 400. 100°-1000w2. 5. 75°-800w2. 500. 25°-400w2. 3.5. 0°-200w2. Current (A). Power (w). 150. 300 200. 0°-200w2. 3 2.5 2 1.5 1. 100. 0.5 0. 0. 20. 40. 60. 80. 100. 120. 140. 160. 180. 200. 220. Voltage (V). Fig.5. PV array voltage– power at different irradiance and temperature levels. 0. 0. 20. 40. 60. 80. 100. 120. 140. 160. 180. 200. 220. Voltage (V). Fig.6. PV array voltage– current at different irradiance and temperature levels. Boost converter A boost converter is simply a particular type of power converter with an output DC. This type of circuit is used to ‘step-up’ a source voltage to a higher, regulated voltage, allowing one power supply to provide different driving voltages. The basic boost converter circuit consists of only a switch (typically a transistor), resistance, an inductor, and a capacitor [10]. The specific connections are shown in figure 9..
(5) H. Serhoud et al.. J Fundam Appl Sci. 2010, 2(1), 98-108. iL. RL. 102. L. V. S. C. Vc. R. Fig.9. Boost converter. Applying Kirchhoff’s rules around the loops, it can obtain the ideal mathematical model of this circuit:. diL V Vc(1 D) RLiL dt dVc Vc C iL (1 D) dt R L. (3). Where iL is the current across the inductor, Vc voltage in the capacitor Parameters. RL , L, and C are supposed to be known constants. D is the switch position and V is voltage supplied by PV photovoltaic array. The gain from the boost converter is directly proportional to the duty cycle (D), or the time the switch is ‘on’ each cycle. Vc 1 V 1 D. (4). Fuzzy logic MPPT controller Recently fuzzy logic controllers have been introduced in the tracking of the MPPT in PV systems [1,2,3,5] They have the advantage to be robust and relatively simple to design as they do not require the knowledge of the exact model. They do require in the other hand the complete knowledge of the operation of the PV system by the designer The proposed FL MPPT Controller, shown in Figure 10, has one input and one output. The FLC input variable is the error defined by: P ( k ) P ( k ) P ( k 1) , Where P is the instant power of the photovoltaic generator. P is change of error P at sampled times k .. The output is defined by: D ( k ) D ( k 1) D ( k ).
(6) H. Serhoud et al.. J Fundam Appl Sci. 2010, 2(1), 98-108. 1 P 1. -K-. -K-. K1. K2. 1 Unit Delay. Fuzzy Logic Controller. z Unit Delay1. 103. D. 1 z. Fig.10. fuzzy logic controller (FLC).. 2. FUZZIFICATION Shows the membership function of input and output variables in which membership functions of input variables P , The output variable is D , These variables are expressed in terms of linguistic variables (such as z (zero),p (positive), n (negative), pg (positive big), ng (negative big), using basic fuzzy subsets. In Fig. 11, the membership functions of the input variable P which is assigned four fuzzy sets.. The membership functions are denser at the center in order to provide more sensitivity against variation in the PV array terminal power.. Fig.11. The membership function of input. Fig.12. The membership function of output. Fig.12. shows the membership functions of the output variable D which is assigned four fuzzy sets. The Fuzzy Rule Algorithm The fuzzy rule algorithm includes 4 fuzzy control rules. These rules are used for the control of boost converter (tracker) such that maximum power is achieved at the output of the solar panel..
(7) H. Serhoud et al.. J Fundam Appl Sci. 2010, 2(1), 98-108. 104. Table 1. Rule base table for the fuzzy logic controller P. n. nz. pz. p. D. ng. N. P. pg. The incremental change in the controller output for a typical fuzzy controller is determined by the rules of the form: If P is... THEN D is … Defuzzification The fuzzy inference is carried out by using Madani’s method, (Table 1), and the defuzzification uses the centre of gravity to compute the output of this FLC which is the duty cycle: n. D. (D ) D j. j 1. j. n. (D ) j 1. j. The control rules are indicated in Table 1 with D and P as inputs and DC as the output. P&O controller The principle of this controller is to provoke perturbation by acting (decrease or increase) on the PWM duty cycle and observing the effect on the output PV power. when P(k-1)<P(k), the voltage is increased . when P(k-1)>P(k), the voltage is decreased. This is done through to simulate this P&O algorithm, a boost chopper, as a DC-DC converter which is described by the equations (3),is used [4]. The parameter D indicates the duty cycle of this chopper, which is the closing time of the switch over one period. The results of simulation for different tests obtained with the P&O algorithm are presented in section 8. Figure 13 shows the functional diagram of the simulated photovoltaic system. The DCDC converter is the boost chopper of figure 6. The previous MPPT controllers FLC were simulated under the following tests:.
(8) H. Serhoud et al.. J Fundam Appl Sci. 2010, 2(1), 98-108. 105. star Set Duty out Read V, I P=V.I No D(k)= D(k-1)-h P(k1)<P(k) Ye s D(k)= D(k-1)+h Fig.13. Flowchart of the Perturb and Observe method.. Simulation of the P&O and fuzzy logic Simulation has been performed when solar illumination changes from 1000 W/m2 to 200 W/m2 and temperature changes from 100 C° to 0 C° s can be seen in Fig. 14. Temperature (C°). 100. Solar illumination (W). 1000 800 600 400 200. 0. 0.2. 0.4. 0.6. Time (sec). 0.8. 1. 75 50 25 0. 0. 0.2. 0.4 0.6 Time (sec). 0.8. Fig.14. The change of solar illumination and temperature in simulation From Fig. 15, Fig .16The result of simulation obtained at of the system based on MPPT with fuzzy control and with P&O the irradiation and temperature used are variable and The load is considered constant (R=200 ). The average output power of the PV array, indicating values in the region of maximum power, according to the curves shown in Fig. 7.. 1.
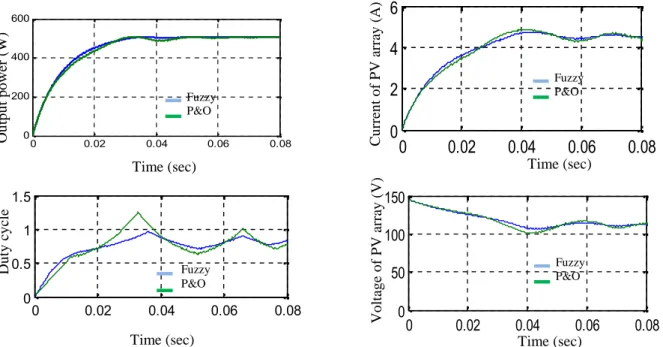
(9) H. Serhoud et al.. J Fundam Appl Sci. 2010, 2(1), 98-108. Output power (W). Output power (W) 600. 600. 400. 400. 200. 200. 0. 0. 0.2. 0.4. 0.6. 0.8. 1. Duty cycle. 0. 106. 0. 0.2. 0.4. 0.6. 0.8. 1. 0.8. 1. Duty cycle. 1.5. 1 1. 0.5. 0. 0.5. 0. 0.2. 0.4. 0.6. 0.8. 1. 0. 0. 0.2. Voltage of PV array (A) 200. 200. 100. 100. 50. 50 0. 0.2. 0.4. 0.6. 0.8. 1. Current of PV array (A). 0. 0. 0.2. 4. 4. 0 0. 0.2. 0.4. 0.6. 0.8. Fig.15. The output power, duty cycle, voltage and current of PV array based on MPPT with fuzzy control.. 1. 0.6. 0.8. 1. 0.8. 1. Output power (W). 2. 2. 0.4. Current of PV array (A). 6. 6. 0. 0.6. 150. 150. 0. 0.4. Voltage of PV array (A). 0. 0.2. 0.4. 0.6. Fig.16. The output power, duty cycle, voltage and current of PV array based on MPPT with P&O.. From Fig. 17, compare to variable P&O MPPT method, it can be known that fuzzy control MPPT algorithm can fast track MPP in voltage, current, and power sides. So the fuzzy control MPPT method is able to improve the dynamic and steady state performance of the PV system simultaneously. MPPT fuzzy logic controllers have been shown to perform well under varying atmospheric conditions both solar illumination and temperature..
(10) J Fundam Appl Sci. 2010, 2(1), 98-108. Output power (W). 600 400. 200. 0. Fuzzy P&O 0. 0.02. 0.04. 0.06. 0.08. 4 Fuzzy P&O. 2 0. 0. 0.02. 0.04. 0.06. Time (sec). 0.08. 150. 1.5. Duty cycle. Voltage of PV array (V). Time (sec). 1. 100. 0.5 0. 107. 6. Current of PV array (A). H. Serhoud et al.. Fuzzy P&O. 0. 0.02. 0.04. 0.06. 0.08. Fuzzy P&O. 50 0. Time (sec). 0. 0.02. 0.04. 0.06. 0.08. Time (sec). Fig.17. Zoom and compare ,The output power, duty cycle, voltage and current of PV array based on MPPT with fuzzy and P&O control when illumination changes from 0W/m2 to 1000 W/m2 and temperature from 0 C° to 100 C°.. 3. CONCLUSION This paper presents a novel method for maximum power point tracker using fuzzy control, and compare to P&O method. The input parameters of the fuzzy control is the change of output power and. the. output is the change of duty cycle for used to. generate the optimal MPPT under different operating conditions, The method resents very good results, the control algorithm gives fast convergence and robust performance. The array considered in this study is a 10 series and 2 parallel connected modules type AEG.40 the parameters of solar module are summarized in table 2. Table 2. Electrical characteristics of modules type AEG.40 Electrical Characteristics Open-circuit voltage. 22.4 V. Short-circuit current. 2.41 A. Series resistance. 0.45 . Temperature coefficient of Icc (% C°). 0.06. Temperature coefficient of voltage (% C°). 0.4. The simulation has been done with a ODE 3, fixed-step solver with a step size of 1x10⁻⁴ S..
(11) H. Serhoud et al.. J Fundam Appl Sci. 2010, 2(1), 98-108. 108. 4. REFERENCES [1] Jiyong Li., Honghua W. ‘’Maximum power point tracking of photovoltaic generation based on the fuzzy control method‘’ Sustainable Power Generation and Supply, 2009. SUPERGEN '09. International Conference on 6-7 April 2009. [2] Aït Cheikh M. S., Larbes C., Tchoketch Kebir G. F. and Zerguerras A. Revue des Energies Renouvelables. 2007, 10(3). [3] Won C Y., Kim D H., Kim S C., Kim W S. and Kim H S. Power lectronics Specialists Conference. PESC’94Record. 25thAnnualIEEE. 20-25June1994, 1, 396403. [4] Jiang J A., Huang T L., Hsiao Y T. and Chen C H. Tamkang Journal of Science and Engineering. 2005, 8(2), 147153. [5] Kottas T L., Boutalis Y S., Karlis A D. IEEE TRANSL ON Energy Conversion. Sept 2006,Volume 21, Issue 3. [6] Esram T. and Chapman P L. IEEE Transl .Energy Conversion. june2007, 22(2). [7] Dr Moussi A., Saadi A., Betka A., Asher G M. Larhyss Journal. 2003, 2, 127-150. [8] Esram T., Kimball J W., Krein P T., Chapman P. and Midya P. IEEE TRANSL. On Power Electronics. September 2006, 21(5). [9] Masoum M A S., Sarvi M. Iranian Journal of Science & Technology.2005. [10] Arteaga Orozco M I., Vázquez J R., Salmerón P., Litrán S P., Alcántara F J. “Maximum power point tracker of a photovoltaic system using sliding mode control” international Conference on Renewable Energies and Power Quality (ICREPQ’09) , Valencia (Spain), 15th to 17th April, 2009. [11] Meza C., Negroni J., Guinjoan F.“Boost-Buck Inverter Variable Structure Control for Grid-Connected Photovoltaic Systems with Sensorless MPPT”: Industrial Electronics, 2005. ISIE 2005. Proceedings of the IEEE International Symposium on. [12] Bingulac S P. “An investigation of new control method for MPPT in PV array using DC – DC buck – boost converter,” in Proc. 4th Annu. Allerton Conf. Circuits and Systems Theory, New York, 1994. How to cite this article Serhoud H, Benattous D, Labbi Y. Simulation of new simple fuzzy logic maximum power point tracker for photovoltaic array. J Fundam Appl Sci. 2010, 2(1), 98-108..
(12)
Figure
Documents relatifs
In addition, in this method the measurement of the SCC (I SC ) is frequently required which means shorting the module on each occasion. However, by using several loads this issue
The proposed technique uses the fuzzy logic control to specify the size of incremental current in the current command of MPPT.. As results indicated, the convergence
Abstract— The performance of a photovoltaic (PV) system is affected by ambient temperature, solar irradiation, shading, and connection of PV module (Series,
Moreover, given the variable nature of the power delivered by the photovoltaic panel, a tracking command of the maximum power point developing an optimal duty
This paper propose a new numerical analysis method based on multivariate polynomial interpolation applied to maximum power point tracking in energy storage
In this study, an improved maximum power point tracking (MPPT) method based of Particle swarm optimization algorithm for solar panel is proposed which has the ability to track
The appropriate choice of single output and input for the neural network (i.e the pumped water quantity and solar radiation quantity respectively), the execution of learning program
However, the characteristics output of photovoltaic systems are nonlinear and change with variations of temperature & irradiation, so we need a controller
