HAL Id: hal-01313033
https://hal.archives-ouvertes.fr/hal-01313033
Submitted on 12 May 2017HAL is a multi-disciplinary open access archive for the deposit and dissemination of sci-entific research documents, whether they are pub-lished or not. The documents may come from teaching and research institutions in France or abroad, or from public or private research centers.
L’archive ouverte pluridisciplinaire HAL, est destinée au dépôt et à la diffusion de documents scientifiques de niveau recherche, publiés ou non, émanant des établissements d’enseignement et de recherche français ou étrangers, des laboratoires publics ou privés.
under conditions of ripple effect
Dmitry Ivanov, Boris Sokolov, Inna Solovyeva, Alexandre Dolgui, Ferry Jie
To cite this version:
Dmitry Ivanov, Boris Sokolov, Inna Solovyeva, Alexandre Dolgui, Ferry Jie. Dynamic recovery policies for time-critical supply chains under conditions of ripple effect. International Journal of Production Research, Taylor & Francis, 2016, 54 (23), pp.7245 - 7258. �10.1080/00207543.2016.1161253�. �hal-01313033�
This is an Author’s Original Manuscript of an article published by Taylor & Francis in International Journal of Production Research on 13.03.2016, available online: http://www.tandfonline.com/
[http://dx.doi.org/10.1080/00207543.2016.1161253].”
Dynamic Recovery Policies for Time-Critical Supply Chains under Conditions
of Ripple Effect
Dmitry Ivanov1, Boris Sokolov2,6, Inna Solovyeva3, Alexandre Dolgui4, Ferry Jie5
1
Berlin School of Economics and Law, Department of Business Administration Chair of International Supply Chain Management, 10825 Berlin, Germany
Phone: +49 3085789155; E-Mail: [email protected] 2
St. Petersburg Institute for Informatics and Automation of the RAS (SPIIRAS) V.O. 14 line, 39 199178 St. Petersburg, Russia; E-Mail: [email protected]
3
2 Ecole Nationale Supérieure des Mines de Nantes IRCCYN, UMR CNRS 6597 La Chantrerie
4, rue Alfred Kastler - B.P. 20722, F-44307 NANTES Cedex 3, France E-mail: [email protected]
4
St.-Petersburg State University, Faculty of Applied Mathematics and Control Processes; E-Mail: [email protected]
5
School of Business IT and Logistics, RMIT University, Melbourne, Australia; E-Mail: [email protected]
6
University ITMO, 199101 Saint Petersburg, Russia
Abstract: We consider time critical supply chains in the Australia dairy industry and re-covery policies in the presence of the ripple effect. Ripple effect is the impact of a dis-ruption on supply chain economic performance and disdis-ruption-based scope of changes needed in the supply structures and parameters to preserve the resilience. First, we de-scribe the ripple effect in general and one example of the ripple effect in the dairy supply chain in Australia. Second, we present a model for reactive recovery policies in the dairy supply chain under conditions of the ripple effect and exemplify them on a simulation example. The results of this study can be used in future for comparing proactive and re-active approaches to tackling the ripple effect from resilience and flexibility views. Keywords: dairy supply chain; ripple effect; resilience; adaptation; program control; po-sitional optimization
This is an extended version of the conference paper
Dmitry Ivanov, Boris Sokolov, Inna Solovyeva, Alexandre Dolgui, Ferry Jie (2015). Ripple Effect in the Time-Critical Food Supply Chains and Recovery Policies, IFAC-PapersOnLine
Volume 48, Issue 3, 15th IFAC Symposium on Information Control Problems in Manufacturing IN-COM 2015, Edited by Alexandre Dolgui, Jurek Sasiadek and Marek Zaremba, pp. 1682-1687.
1. Introduction
Decision-making in the case of disruptions is one of the main challenges in the supply chain (SC) opera-tions and is closely related to designing robust and controllable networks (Schwartz et al. 2006, Ivanov et al. 2010, Wahdani et al. 2011, Peng et al. 2011, Garcia et al. 2012, Baghalian et al. 2013). In particular, this challenge is faced in the ripple effect.
Ripple effect is the impact of a disruption on SC performance and disruption-based scope of changes in the SC structures and parameters (Ivanov et al. 2014). Following a disruption, its effect ripples through the SC. The scope of the rippling and its impact on economic performance depends both on robustness reserves (e.g., redundancies like inventory or capacity buffers) and speed and scale of recovery measures (Hendricks and Singhal, 2005; Sheffi and Rice, 2005; Tomlin, 2006; Klibi et al. 2010, Bode et al., 2011; Ivanov and Sokolov, 2013; Kim and Tomlin, 2013).
Disruptions are hardly predictable. Therefore, their risk and SC resilience should be estimated at the de-sign and planning stages (Bakhsi and Kleindorfer, 2009; Blackhurst et al., 2011). At the control stage, contingency plans (e.g., alternative suppliers or shipping routes) must happen quickly to expedite stabili-zation and recovery in order to ensure continuity of supply and avoid long-term impact. In implementing such recovery policies, companies need a tool supported by collaboration and SC visibility solutions for assessing the impact of disruption on the SC as well as the effects from redirecting material flows (Kne-meyer et al. 2009, Hishamuddin et al., 2013).
Although a lot of research has been conducted in the area of SC resilience on the prediction stage, there is still a gap in research regarding the recovery policies. In addition, so called time-critical SCs, e.g., the SCs with highly perishable products have got only limited attention from the research community rather than electronics or automotive SCs. The analysis of the time-critical SCs requires application of dynamic methods and can be performed with the help of optimal control models.
In this study, we consider the ripple effect in the Australian dairy SC and recovery policies on the basis of dynamic control models. Due to high likelihood of different natural disruptions in Australia, many Aus-tralia dairy SCs can be considered as time-critical systems. This paper consists of two parts. The first part describes the ripple effect in general and one example of the ripple effect in the Australia dairy supply chain. The second part presents a model for reactive recovery policies in the dairy supply chain under conditions of the ripple effect and exemplifies them on a simulation example in the dairy SC under condi-tions of the ripple effect. The paper is concluded by managerial insights and identifying future research avenues.
2. Literature Review
Recovery policies may include different elements such as back-up suppliers and inventory re-placements (Ivanov et al. 2015, 2016). Since the focus of this study is on dynamic disruption and recovery analysis, we restrict ourselves to simulation and control approaches in this Section. Simulation approaches have been proved to be a suitable tool for analysis of SCD in terms of the ripple effect. Schmitt and Singh (2012) presented a quantitative estimation of the disruption risk at production and supply capacities in a multi-echelon SC using discrete-event simulation. They also consider dual sourcing as a contingency measure. The disruption risk is measured by “weeks of recovery” as the amplification of the disruption. Carvalho et al. (2012) analysed impacts of transportation disruptions on lead-time and overall costs in an automotive SC using ARENA-based simulation model.
Unnikrishnan and Figliozzi (2011) developed a scenario-based model with an adaptive routing policy. Vahdani et al. (2011) applied fuzzy program evaluation and review technique to calculate the completion time of SC operations in the case of a severe disruption. Xu et al. (2014) used AnyLogic software and modelled SC as an agent system to study the disruption at suppliers and recovery policies on the SC ser-vice level.
Ivanov et al. (2013) included transportation reconfiguration in the case of SC disruptions into the SCD in a multi-period model based on a combination of LP and optimal control. Ivanov et al. (2014b) developed a model for multi-period and multi-commodity SCD with structure dynamics considerations. The original idea of these studies is SC description as a non-stationary dynamic control system along with a linear programming model. In contrast to MIP formulation, they distribute static and dynamic parameters be-tween the LP and control models. Xu et al. (2014) developed an approach to predict SC resilience by in-cluding recovery measures that use the analogy to biological cells with the abilities to self-adaptation and self-recovery. Paul et al. (2014) analysed series of disruptions over time and presented an inventory con-trol-based model to develop optimal recovery policies for real time disruption management for a two-stage batch production–inventory system with reliability considerations. They consider multiple disrup-tions and cases where new disruption may or may not affect the recovery plan of earlier disrupdisrup-tions. It can be observed that reaction to disruptive events can be performed depending on the severity of dis-ruptions as
Parametrical adaptation or Structure adaptation
Parametrical adaptation represents the simplest case where stabilization and recovery are possible through tuning of some critical parameters like lead-time or inventory. Structure adaptation considers back-up supplier on contingency transportation plans. MIP formulations with facility fortification consider product
shift to back-up suppliers if primary suppliers are disrupted. Inventory control models also suggest poli-cies for recovery. Simulation techniques consider “what-if” scenarios which can be used by SC managers in the case of disruption occurrence to quickly estimate the recovery policies and impacts on operational and financial performance.
Summarizing, investment in SC protection can help to avoid many problems with disruptive events. However, it is impossible to avoid disruption completely. Simchi-Levi et al. (2014) underline that focus should be directed to the recovery policies regardless of what caused the disruption. Therefore, adaptation is needed to change SC plans, schedules or inventory policies in order to achieve the desired output per-formance. In this setting, SCs can be robust and stable only on the basis of decisions that are taken by people (unlike a pendulum, which returns to the stable state due to natural laws, without adaptation). In SCs, the adaptation (and more precisely, human-driven coordinated adaptation) is the precondition of stability and robustness (Ivanov and Sokolov, 2013).
Management science and operations research along with system dynamics and control theory contain a number of useful methods that can be used for analysis and for mitigating the ripple effect. Different methods are suited to different problems. No single technique is likely to prove a panacea in this field. While mathematical and stochastic optimization has its place at the SC design and planning stages with-out recovery considerations, they fail to throw much light on the dynamic behaviour of the SC. The im-plications of strategic SC design and tactical plans on SC performance at the execution and recovery stage can be enhanced by using models based on the dynamics of the execution processes.
3. CASE STUDY AND METHODOLOGY
3.1 Time-critical dairy supply chains in Australia
Dairy is the third largest agricultural industry in Australia, with a gross value of production of more than $4.6 billion. The Australian Dairy Industry is a large industry in need of sustained expansion of its inter-national markets. This industry generates exports of almost $3 billion per year. While the domestic mar-ket offers only limited potential for expansion, there exist several good prospects for international marmar-ket expansion. More than 60% of output is currently exported, mainly to Japan, Singapore, Malaysia, Indo-nesia and China. In terms of dairy production, the Australian dairy farmers produce around 9 billion litres of milk per year (36% is used for cheese production, 24% for skim milk, powder and butter; 24% for fresh milk; and 12% for whole milk powder (Department of Primary Industries 2010). While
Australia contributes just 2% of world milk production, it accounts for around 10% of world dairy trade, ranking third behind New Zealand and the European Union. Over 60% of annual milk production is ex-ported, mainly to Japan, Singapore, Malaysia, Indonesia and China.
There are more than 8,000 dairy farms in Australia, which employ 21,500 people directly on-farm and almost 40,000 people industry-wide. Dairy manufacturing is a significant contributor to regional econo-mies with annual sales valued at over $12 billion a year. To date, the dairy industry principle focus has been on technological innovation. Dairy is the most developed of the major agricultural industries in terms of the value added and therefore emphasizes the significance, challenges and opportunities of effec-tive and innovation practices in supply chain management. Dairy sector is undergoing rapid change be-cause of globalisation, emerging markets and the availability of new technologies and business practices, a highly competitive market (local and export), fluctuations in markets and productivity growth, the trend toward more outsourcing of activities, and the rapid development of IT. In addition, dairy farmers face challenges arising from declining productivity growth and increasing competition from overseas produc-ers. In particular, declining productivity growth, especially when compared with some international com-petitors, represents one of the most significant challenges for the dairy industry.
Dairy supply chain structure can be seen in Figure 1:
Figure 1. Dairy supply chain structure (Issar 2004)
Australian experiences a range of natural disasters including bushfires, floods, severe storms and cyclone Yasi. In October 2013, a series of bushfires occurred across the state of New South Wales. At the peak of the fires, on 18 October 2013, over 100 fires were burning across the state. The Queensland floods were followed by the 2011 Victorian floods which saw more than fifty communities in western and central Victoria also grapple with significant flooding. Severe Tropical Cyclone Yasi was a tropical cyclone that crossed the coast in northern Queensland, in the early hours of Thursday, 3 February 2011. Yasi origi-nated from a tropical low near Fiji, intensified to a Category 3 cyclone on 31 January 2011 before the cyclone intensified to a Category 5 system. The cyclone's impact had been severe in some dairy regions. The Australian dairy industry is working across the supply chain to mitigate the effects of extreme natural disasters. Transportation and particularly road access is essential to ensure dairy products (milk, yoghurt, cheese etc) can be moved from farm to factory and then for the final products to be supplied to wholesal-ers or retailwholesal-ers and on to the final consumer.
Milk Production
Processing Marketing and Distribution
Retailing Final Consumer
3.2. Methodology
Two fundamental approaches to hedging time-critical dairy SC against the negative impacts of different disruptions – proactive and reactive can be proposed. Reactive approach aims at adjusting SC processes and structure in the presence of unexpected events. Proactive approach creates certain protection and takes into account possible perturbations while generating SC structures and execution plans.
The basis of the proposed methodology is control theoretic description of SCs as controllable dynamic systems with structure dynamics (Ivanov et al. 2010, Ivanov and Sokolov 2012a). This study is based on the scheduling SC model and algorithm in terms of optimal program control (OPC) (Ivanov and Sokolov 2012b). It is assumed in this study that a certain initial state x(T0) is known and a schedule u (t) has been calculated. The developed SC schedule execution problem can be formulated: this is necessary to find a feasible control u(t), (t ,l tf], that ensures the dynamic control model meets the constraint functions, and
guides the dynamic system (i.e., the SC) x (t,x,u) from the initial state to the specified final state
sub-ject to given end conditions. If there are several feasible controls (schedules), then the best one (optimal) should be selected in order to maximize (minimize) a general performance indicatorJGtaking into account
priority coefficients λ of key performance indicators J1...Jk (e.g., service level and costs):
K k k kJ J 1 G ; k0; 1 1 K k k . (1)In terms of OPC, the optimal program control of execution is at the same time the optimal SC schedule. Based on the above-mentioned model and after describing SC planning stage in control terms, it becomes possible to analyse robustness as time functions and elaborate adaptation strategies. This is the goal of this paper. Robustness has to ensure for any time-invariant bounded uncertainties, SC is able to realize the performance of production and transportation execution and reject the disturbances. In the latter case, adaptation strategies have to be applied to recover the SC behaviour.
For experimental part, software AnyLogistix has been used that is software for supply chain network design, analysis, and optimization. Simulation modeling methods allow us considering the details and specific traits of the SC elements. This allows not only visualizing network operations but also tracing every process inside. In addition, using simulation allows us to observe the impact of different disruptions and recovery policies in time and consider gradual capacity degradation and recovery.
4. REACTIVE RECOVERY WITH THE HELP OF OPTIMAL PROGRAM
CONTROL VS PROGRAM-POSITIONAL OPTIMIZATION
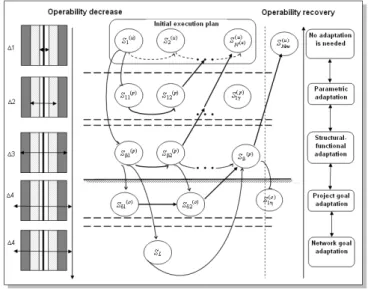
In accordance to different severity of disturbances, robustness and adaptation can be brought into corre-spondence to each other in order timely to derive necessary adaptation measures according to different deviations. Figure 1 depicts various variants of system behaviour changing in case of perturbation im-pacts to the system state S1(u) of the initial u(t).
The perturbation impacts cause various execution parameters’ deviations ∆pi and operability decrease in
relation to the SC goals J = {J1….., Jc}. To match the robustness analysis and recovering the SC
operabil-ity, we bring certain adaptation levels in correspondence to different deviations (Fig. 2).
Figure 2. Dynamics of the SC execution (Ivanov and Sokolov 2010)
Each recovery level characterizes a certain control loop in relation to deviations and corresponds to cer-tain management actions. We distinguish parametric adaptation (i.e., rush orders), structural-functional adaptation (i.e., supplier structure changing), project goals adaptation (i.e.., delivery delay), SC goals ad-aptation (i.e.., network profit changing) as well as SC strategy and models adad-aptation. Operative decision making about SC reconfiguration and adjustment is based both on the planning and execution information (selection of adaptation level in case of certain parameter deviations is related to the robustness analysis). In case of deviations (both in future – a preventive adaptation, and during a current operation running – a reactive adaptation), a decision maker can timely take necessary steps for the SC adjustment.
Two control principles can be used: OPC and positional control (with a closed feedback loop). The adap-tation by OPC has been considered in the study (Ivanov and Sokolov 2012a). Program control is simpler to compute and implement, while positional (feedback) control performs better in the presence of persis-tent disturbances. Additional possibility to address the adaptation issues is model predictive control (MPC) that has been recently applied to SC domain (Perea et al. 2000). MPC is out of scope of this study.
In hybrid strategies (Balashevich et al. 1994), at fixed instants the controller constructs feedback controls in response to the current system state, while in the intervals between these instants the controller uses programmed controls that correspond to the system state at the beginning of the interval. Such class of hybrid controls is quite natural for cases when the control law can be updated only at discrete time in-stants in the process of system operation, in particular where 1) the system state is measured continu-ously; 2) the state is measured only at discrete times. This is the case in SCs. That is why for further in-vestigations into SC plan corrections combined program-positional control approach will be applied. Let us assume that an optimal program for SC schedule execution control u(t) has been calculated (Ivanov and Sokolov 2012a). This scheduling model in terms of OPC may be represented in the following form (Eq. 3): 0 0 1 (1) (2) ( ) | ( , , ); ( ( )) 0, ( ( )) 0; ( , ) 0, ( , ) 0, f t t M t t u x f x u h x h x q x u q x u (4)
where h0,h1 are given functions of end conditions at time tt0,ttf and q(1),q(2) is the generalized
nota-tion of the linear and non-linear constraints respectively (Ivanov and Sokolov 2010). In order to deter-mine the optimal adaptation program, the positional optimization method can be used. It is to decide on the best adaptation programs regarding the attainability of key performance indicators from the set J. For example, it may be necessary to compare the immediate adaptation program (i.e., the immediate recovery and return on the planned execution) or smooth adaptation program (i.e., constructing an alternative exe-cution in anticipating new perturbations). Such analysis also involves adaptation costs which may vary in different strategies.
The following assumptions are made. Let us define planned execution program asupr( ),t xpr( )t . Perturba-tions (2) are assumed to be piecewise continuous funcPerturba-tions. Information about current state~ tx()of the sys-tem in the model (3) is available at time pointst[t0,tf)as the state vector xσ. The problem of plan
cor-rection consists of finding control uk( )t during the execution of control upr( ),t x within the interval pr( )t t [t t0, f) so that the perturbation impacts are compensated and the objective function (4) is minimized:
0 | ( ) ( ) | min f t pr t J
xt x t dt (5)Denote y(t) ~x(t) xpr(t)
as deviation vector and w(t) as correcting control vector that can be found from
( ) ( ) ( )
k t t t
u u w . The found control uk( )t can be now used in the model (1). The constraints have now the
form (1) (2)
{ ( ) | ( ), ( ), ( ) [ 1, 1]; ( , ) 0, ( , ) 0}
p w q y uk q y uk .
This transforms the model (1) to the new modelM. As proved in Ivanov and Sokolov (2012b), the model M, as the model M, is a linear finite-dimensional non-stationary dynamic system.
Consider the time horizon for which the scheduling problem has be solved [t0,tf), t0tf . Consider
discretization step h(tf t0) /L, where L is a large number. Define w t( ),t[t0, tf )as discrete control
0
( )t w t( lh)
w for t[t0lh t, 0(l1) )h , l0,L1. In this class of discrete control, the control w t will ( )
be searched for with the help of positional optimization.
Consider at time t the OPC problem for M. Denote w( | , ) z as optimal program control for
posi-tion ( , ) z ; this is also optimal control of the auxiliary problem. Denote Y ( ) as a set of all possible initial states of zy( ) for which the problem has a solution for fixed, zy( ), ( ) y Y( ), tT( ) [ ,tf) as
proved in the study by Gabasov et al. (2005).
Taking into account particular features of the problem M(non-stationarity, interval linear constraints on control w(t), simultaneous optimization of assignment and flow distribution control), the method of nu-merical optimization of time-dependent multidimensional systems under polyhedral constraints can be used (Gabasov et al. 2005). The choice of this method is based on the specific form of constraints and independency from the discretization step h.
End conditions and performance indicator in the auxiliary problem can be expressed as y( ) y, (y tf)0,
and ( ) min f| ( ) | t J z t dt
y . Determine ( )tw consecutively in solving at each point of time tthe auxiliary
problem with new initial conditions y( t)y.
From the technical point of view, the auxiliary problems belong to the OPC problem class with interval constraints. In the study (Gabasov et al. 2001) has been shown that they may be transformed in the case of discrete control to linear programming (LP) problems with the band structure matrix which can be solved with adaptive methods.
5. GENERALIZED ALGORITHM
At the first stage, the basic model (1) is applied to find the OPCupr( ),t xpr( )t . At the second stage, AS method is applied to analyse SC robustness. The result of this analysis is the upper and low bounds of the tolerance area (compare with Figure 1) for upr( ),t xpr( )t execution. In remaining within these bounds, SCs is guaranteed to execute performance and reject disturbances subject to the considered risk level. Finally, at the third stage SC execution has to be adapted in the case of disturbances.
Let us summarize the algorithm of program-positional SC control for the stage 3: Step 1. Transformation of the model M to the modelM.
Step 2. Generation of the deviation system, new constraint system, and goal function. Step 3. Formation of the auxiliary problem of OPC with initial conditions (tσ, xσ).
Step 4. Realisation of the synthesis procedure in the discrete control classw( )t w t(0lh) for
0 0
[ , ( 1) )
t t lh t l h , l0,L1 .
Step 5. Transformation of the auxiliary OPC problem to LP problem.
Step 6. Solution of the LP problem with the help of adaptive method on the set ( ), ( ) Y( ), tT( ) [ ,tf).
Step 7. Implementation of the correcting control within the interval prior to the next information update point (tσ+1, xσ+1).
Components of the multi-objective vector J = {J1….., Jc} for attainable sets can be selected according to
the results of analysis made in (Jie et al. 2012) as follows: J = {J1:costs; J2:service level; J3:quality;
J4:delivery time}. Fig. 2 can be used as a basis for the development of control programsupr( ),t xpr( )t and
recovery policiesw( )t w t(0lh). Experimental results are currently under development.
6. SIMULATION EXAMPLE
The simulation has been performed in AnyLogistix on a standard desktop computer. The simulation experiments have been done in regard to the following scenarios:
Operating the SC with no disruptions
Operating the SC without DCs in VIC and NSW
Operating the SC without DCs in VIC and NSW with the use of a back-up DC near Melbourne and Sydney ports and using multiple sourcing
Operating the SC without DCs in VIC and NSW using expensive emergency transportation means.
In each scenario, we are interested to compute: DCs’s revenues, costs and profits Revenue at customers
Inventory dynamics at DCs
The analysis of the revenues, costs, and profits along with the inventory dynamics analysis may help us to identify the performance impacts of disruptions in regard to different recovery (contingency) policies in order to support the decision-making on selection of recovery policies in the SC.
6.1 Operating the SC with no disruptions
Consider a fragment of a diary SC in Australia that comprises three suppliers, five distribution centers (DC) and 24 customers (Fig. 2).
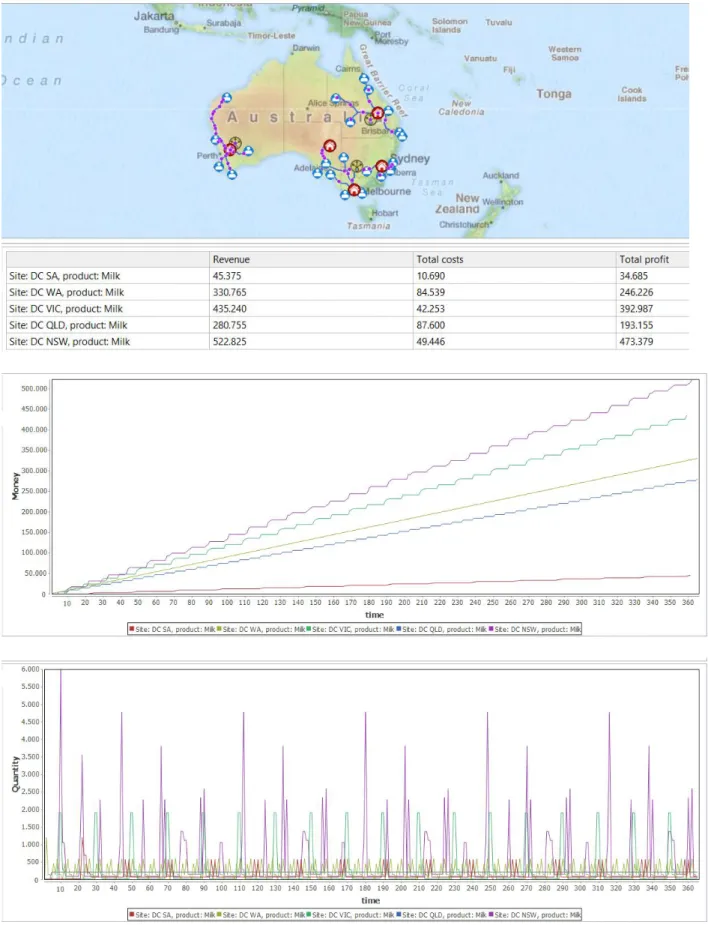
Fig. 3. Australian Diary Supply Chain
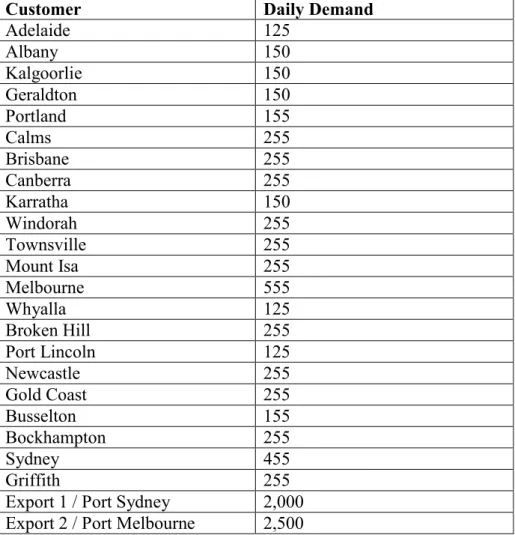
The SC employs the regional and single sourcing policy. Five DCs are located in Western Australia (WA), South Australia (SA), Victoria (VIC), Queensland (QLD), and New South Wales (NSW). The normally distributed demands with a mean q at customers are given at a daily basis t=1 as shown in Table 1.
Customer Daily Demand Adelaide 125 Albany 150 Kalgoorlie 150 Geraldton 150 Portland 155 Calms 255 Brisbane 255 Canberra 255 Karratha 150 Windorah 255 Townsville 255 Mount Isa 255 Melbourne 555 Whyalla 125 Broken Hill 255 Port Lincoln 125 Newcastle 255 Gold Coast 255 Busselton 155 Bockhampton 255 Sydney 455 Griffith 255
Export 1 / Port Sydney 2,000 Export 2 / Port Melbourne 2,500
It can be observed that along with 22 national customers, there are two international customers with very high demand that are defined as „Export 1“ and „Export 2“ and located close to the international ports in Melbourne (VIC) and Sydney (NSW). Since export of diary product is very important for Australia, demand satisfaction at these customers is of high importance.
Further we are given inventory control policies at DCs as shown in Table 2. Table 2. Inventory control policies at DCs
Facility s (re-order point) S (target inventory)
DC SA 800 1,200
DC WA 800 1,200
DC VIC 2,800 5,000
DC QLD 1,300 2,000
For experiments, we assume (s,S) inventory control policies without initial stock. Selling price is set at $3 per litre and costs is set of $1 per litre. Transportation costs equals $0.001 x distance x shipment quantity. Transportation capacity is considered to be sufficient and allows LTL shipments.
Table 3. Customer revenues when operating the SC without disruptions Customer Revenue, $ Adelaide 26,625 Albany 53,550 Kalgoorlie 54,000 Geraldton 80,100 Portland 33,480 Calms 44,370 Brisbane 44,370 Canberra 62,730 Karratha 76,050 Windorah 44,370 Townsville 45,135 Mount Isa 43,605 Melbourne 89,910 Whyalla 21,000 Broken Hill 68,085 Port Lincoln 21,375 Newcastle 70,380 Gold Coast 44,370 Busselton 55,335 Bockhampton 765 Sydney 128,310 Griffith 55,845
Export 1 / Port Sydney 216,000 Export 2 / Port Melbourne 195,000
It can be observed from Fig. 4 and Table 3 that operating the SC without disruptions allows achieving total revenue at customers of $2,077.373, total revenue at DCs of $1,614.960 and total profit at DCs of $1,340.432.
6.2 Operating the SC without DCs in VIC and NSW
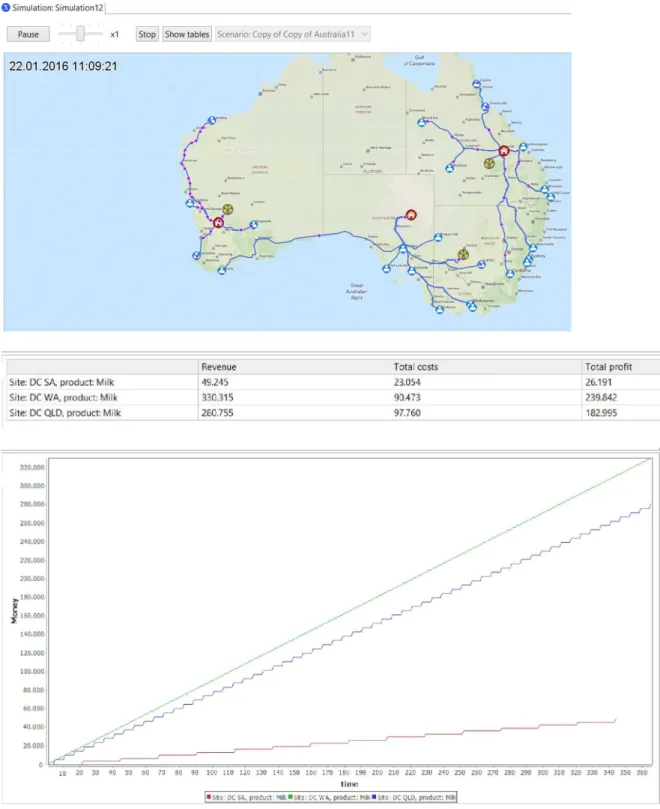
In this scenario, two DCs (VIC and NSW) are not available. The simulation results subject to the parame-ters from §6.1 are depicted in Fig. 5 and Table 4.
Fig. 5. DC performance when operating the SC without DCs in VIC and NSW Table 4. Customer revenues when operating the SC without DCs in VIC and NSW
Customer Disruption case, Revenue, $ Revenue, $, if no disruption
Adelaide 5,625 26,625
Albany 5,850 53,550
Kalgoorlie 54,000 54,000
Geraldton 107,100 80,100
Calms 44,370 44,370 Brisbane 44,370 44,370 Canberra 42,840 62,730 Karratha 101,700 76,050 Windorah 44,370 44,370 Townsville 45,135 45,135 Mount Isa 43,605 43,605 Melbourne 11,655 89,910 Whyalla 3,000 21,000 Broken Hill 6,120 68,085 Port Lincoln 3,000 21,375 Newcastle 765 70,380 Gold Coast 0 44,370 Busselton 55,335 55,335 Bockhampton 0 765 Sydney 0 128,310 Griffith 5,355 55,845
Export 1 / Port Sydney 0 216,000
Export 2 / Port Melbourne 0 195,000
It can be observed from Fig. 5 and Table 4 that the disruptions have significant performance impact. Op-erating the SC without DCs in VIC and NSW allows achieving total revenue at customers of $630,705 (instead of $2,077.373 without disruptions, i.e. a decrease in sales of 70%), total revenue at DCs of $660,315 (instead of $1,614.960, i.e. a decrease of 60%) and total profit at DCs of $449,028 (instead of $1,340.432, i.e. a decrease of 66%). It can be further observed that both export customers with the highest revenues and demand cannot be served at all. A possible solution can be establishment of a back-up DC near Melbourne and Sydney ports. This scenario will be investigated in § 6.3.
6.3 Operating the SC without DCs in VIC and NSW with the use of a back-up DC near Melbourne and Sydney ports and using multiple sourcing VIC, NSW, QLD and SA
This scenario implies a contingency plan in the form of a back-up DC (with the inventory policy s=1,200; S=6,000) near Melbourne and Sydney ports and using multiple sourcing VIC, NSW, QLD and SA. The simulation results are shown in Fig. 6.
Fig. 6. DC performance when operating the SC without DCs in VIC and NSW with the use of a back-up DC near Melbourne and Sydney ports and using multiple sourcing VIC, NSW, QLD and SA
Fig. 6 illustrate the simulation results when operating the SC without DCs in VIC and NSW with the use of a back-up DC near Melbourne and Sydney ports and using multiple sourcing VIC, NSW, QLD and SA. This recovery policy allows achieving total revenue at customers of $644,505 (instead of 630,705 without the back-up DC) and total revenue at DCs of $673,815 (instead of $660,315 without the back-up DC). It can be observed that only a small increase in revenues and sales can be achieved if using a back-up DC. This can be explained by the fact that not only the DCs but also the sback-uppliers (i.e., the farmers and processing plants) are disrupted in the case of natural catastrophes in some regions.
6.4 Operating the SC without DCs in VIC and NSW using expensive emergency transportation means In this setting, we consider the scenario similar to §2 but also include more severity in the disruption so that normal transportation routes cannot be used and expensive emergency transportation means with costs of $0.01 for km x weight are used (instead of normal costs o$0.01 for km x weight). In this case, total profit at all three DCs is decreased (SA= $-205,552, WA=$-614,624, QLD = $-743,356).
7. CONCLUSIONS
In this study, time critical SCs in the Australia dairy industry and recovery policies in the presence of the ripple effect have been considered. Ripple effect is the impact of a disruption on SC economic performance and disruption-based scope of changes needed in the supply structures and parameters to preserve the resilience. A dynamic model for reactive recovery policies in the dairy SC under conditions of the ripple effect and exemplifies them on a simulation example.
From a practical point of view, the results of the research in this domain are to provide operations and SC planners with new tools in order to support them in decisions on how to
estimate the impact of possible perturbations on economic performance at the SC design and inventory planning stage
quickly estimate the impact of real plan deviations on economic performance at the execution stage
suggest efficient and effective stabilization and recovery measures.
The results of this study can be used in future for comparing proactive and reactive approaches to tackling the ripple effect from resilience and flexibility views. We considered SC resilience as a dynamic property that emerges through controlled adaptability on the basis of feedback loops. The simulation experiments have been done in regard to the normal operation mode, operating with disruptions, and operating with
disruptions and using recovery policies (contingency plans). In each scenario, we analysed performance impact of disruptions and recovery policies in regard to revenues, costs and profits.
For the considered example, we found out the performance impact of using a back-up DC and alternative transportation means. Such an analysis of the revenues, costs, and profits along with the inventory dy-namics analysis may help the SC managers to identify the performance impacts of disruptions in regard to different recovery (contingency) policies in order to support the decision-making on employment of re-covery policies in the SC.
In regard to the extension of this study, it is to mention that a crucial practical problem is to determine where exactly changes are needed: in the schedule, in the master plan or in the business plan. Such an analysis should incorporate multiple control loops including corresponding business-process models, quantitative models, and IT for gathering and processing real-time data. Decentralized interests of SC enterprises also have to be included in such analyses.
First, different control strategies regarding construction of the optimal recovery programs can be ana-lysed. Here, basic cybernetic principles (critical events, final deviations, free trajectories and interim solu-tions) can be investigated. For example, an immediate adaptation program (i.e., immediate recovery and return on the planned execution) and smooth adaptation program (i.e., constructing an alternative execu-tion in anticipaexecu-tion of new perturbaexecu-tions) can be compared. Second, different control objectives may be considered (e.g., maintaining planned economic performance, extremizing this performance through con-trol, maintaining plan stability rather than recovering the planned economic performance, etc.).
Inventory and facility costs are not considered in this study since milk is a time critical product and DCs play the role of cross-docking points in the SC. In addition, costs of facility fortification need to be ad-dressed in future along with creation of more complex cases with multiple products, inclusion factory and supplier capacities, and investigating impact of different inventory control policies.
In future, the focus of this research may be directed to computational analysis and comparison of different recovery policies with regard to some empirical data sets the collection of each is currently under devel-opment. In addition, elements of recovery should be considered integrated with proactive models. Such integration requires simultaneous consideration of both the static structural properties of SCD and execu-tion dynamics subject to uncertainty and disrupexecu-tions. The efficient applicaexecu-tion of model-based support for any quantitative analysis implies clear description of control processes in the case of different deviations and disturbances. Such processes (i.e., control loops) should also include different control objectives and strategies (e.g., recovering planned execution, maintaining plan stability, minimizing future impacts, etc.).
In addition, impacts of control actions on economic performance and related costs of control have not so far found sufficient consideration in the literature.
Funding
The research described in this paper is partially supported by the Russian Foundation for Basic Research (grants 15-07-08391, 15-08-08459, 16-57-00172-Bel_а, 16-07-00779, 16-08-01068, 16-07-01277), by grant ITMO 074-U01 supported by Government of Russian Federation, Program “5-100-2020”, by Department of nanotechnologies and information technologies of the RAS (project 2.11), by Program NTS “Monitoring SG” (project 1.4.1–1), and by program 6.1.1 of St. Petersburg Polytechnical University.
REFERENCES
Baghalian, A., Rezapour, S., and Farahani, R.Z. 2013. “Robust supply chain network design with service level against disruptions and demand uncertainties: A real-life case.” European Journal of Operational Research 227 (1): 199-215.
Bakshi, N., and Kleindorfer, P.R. 2009. “Co-opetition and investment for supply-chain resilience.” Production and
Operations Management 18 (6): 583–603.
Balashevich, N. V., R. Gabasov, and F. M. Kirillova 1994. “Program-positional optimization of dynamic systems.”
Cybernetics and Systems Analysis 30 (1): 47-53.
Blackhurst, J., Dunn, K.S., and Craighead, C.W. 2011. “An empirically derived framework of global supply resil-iency.” Journal of Business Logistics 32 (4): 374–391.
Bode, C., Wagner, S.M., Petersen, K.J., and Ellram, L.M. 2011. “Understanding responses to supply chain disrup-tions: Insights from information processing and resource dependence perspectives.” Academy of Management
Journal 54 (4): 833–856.
Carvalho, H., Barroso, A.P., Machado, V.H., Azevedo, S., & Cruz-Machado, V. (2012). Supply chain redesign for resilience using simulation. Computers & Industrial Engineering, 62(1), 329–341.
Department of Primary Industries (2010). “DPI services to dairy farmers.” Department of Primary Industries Dis-cussion (1): 1-54.
Gabasov R., Dmitruk N.M., and Kirillova F.M. 2005. “Numerical Optimization of Time-Dependent Multidimen-sional Systems under Polyhedral Constraints.” Computational Mathematics and Mathematical Physics 45 (4): 593–612.
Gabasov R., Kirillova F.M., and Ruzhitskaya E.A. 2001. “Damping and Stabilization of a Pendulum with Large Initial Disturbance.” Journal of Computer and Systems Sciences international 40 (1): 24–33.
Garcia, C.A., Ibeas, A., Herrera, J. and Vilanova, R. 2012. “Inventory control for the supplychain: An adaptive control approach based on the identification of the lead-time Omega”, 40, 314-327 JOURNAL?
Hendricks, K. B., and Singhal, V. R. 2005. „Association between supply chain glitches and operating perform-ance.” Management Science 51 (5): 695–711.
Hishamuddin, H., Sarker, R.A., and Essam, D. 2013. “A recovery model for a two-echelon serial supply chain with consideration of transportation disruption.” Computers and Industrial Engineering 64 (2): 552-561.
Issar, G. 2004. Strategies and Relationships in the Dairy-food Supply Chain: Options for Milk Producers in South-east Queensland. Doctor of Philosophy, the University of Queensland.
Ivanov D., and Sokolov B. 2012a. “Structure dynamics control approach to supply chain planning and adaptation.”
International Journal of Production Research 50 (21): 6133-6149.
Ivanov D., and Sokolov B. 2013. “Control and system-theoretic identification of the supply chain dynamics domain for planning, analysis, and adaptation of performance under uncertainty.” European Journal of Operational
Re-search 224 (2): 313-323.
Ivanov D., Sokolov B., and Pavlov, A. 2013. “Dual problem formulation and its application to optimal re-design of an integrated production-distribution network with structure dynamics and ripple effect considerations.”
Inter-national Journal of Production Research 51 (18): 5386-5403.
Ivanov, D., and Sokolov, B. 2010. Adaptive Supply Chain Management. London: Springer
Ivanov, D., Sokolov, B., and Dolgui, A. 2014a. “The Ripple effect in supply chains: trade-off ‘efficiency-flexibility-resilience’ in disruption management.” International Journal of Production Research, 52 (7): 2154-2172.
Ivanov, D., Sokolov, B., and Kaeschel J. 2010. “A multi-structural framework for adaptive supply chain planning and operations with structure dynamics considerations.” European Journal of Operational Research 200: 409-420
Ivanov, D., Sokolov, B., and Pavlov, A. 2014b. “Optimal distribution (re)planning in a centralized multi-stage net-work under conditions of ripple effect and structure dynamics.” European Journal of Operational Research 237 (2): 758-770.
Ivanov D., Sokolov B., Pavlov A., Dolgui A., Pavlov D. (2016). Disruption-driven supply chain (re)-planning and performance impact assessment with consideration of pro-active and recovery policies. Transportation
Re-search: Part E, 10.1016/j.tre.2015.12.007.
Ivanov, D., Hartl, R., Dolgui, A., Pavlov, A., Sokolov, B. (2015) Integration of aggregate distribution and dynam-ic transportation planning in a supply chain with capacity disruption and the Ripple effect consideration,
Inter-national Journal of Production Research, 53:23, 6963-6979.
Jie, F. and Parton, K. 2009. “The need for improved skills in the Australian meat industry.” International Review of
Business Research Papers 5 (4): 257–269.
Jie, F., Parton, K.A. and Cox, R.J. 2012. “An agile supply chain analysis of Australian beef wholesalers and retail-ers.” International Journal of Agile Systems and Management 5 (4): 297–318.
Kim, S.H., and Tomlin, B. 2013. “Guilt by Association: Strategic Failure Prevention and Recovery Capacity In-vestments.” Management Science 59 (7): 1631-1649
Klibi, W., Martel, A., and Guitouni, A. 2010. “The design of robust value-creating supply chain networks: A criti-cal review.” European Journal of Operational Research 203 (2): 283–293.
Knemeyer, A.M., Zinn, W., and Eroglu, C. 2009. “Proactive planning for catastrophic events in supply chains.”
Journal of Operations Management 27 (2): 141-153.
Lee, E.B., and Markus, L. 1967. Foundations of optimal control theory. Wiley and Sons: New York.
Paul, S.K., Sarker, R., & Essam, D. (2014). Real time disruption management for a two-stage batch production– inventory system with reliability considerations. European Journal of Operational Research, 237, 113–128. Peng, P., Snyder, L. V., Lim, A., and Liu, Z. 2011. “Reliable logistics networks design with facility disruptions.”
Transportation Research Part B: Methodological 45 (8): 1190–1211.
Schmitt, A.J., & Singh, M. (2012). A quantitative analysis of disruption risk in a multi-echelon supply chain.
Inter-national Journal of Production Economics, 139 (1), 23-32.
Schwartz D, Wang W, and Rivera D. 2006. “Simulation-based optimization of process control policies for inven-tory management in supply chains.” Automatica 125 (2):1311–20.
Sheffi, Y., and Rice, J.B. 2005. “A supply chain view of the resilient enterprise.” MIT Sloan Management Review 47 (1): 41-48.
Simchi-Levi, D., Schmidt, W., & Wei, Y. (2014). From superstorms to factory fires: Managing unpredictable sup-ply chain disruptions. Havard Business Review, February.
Tomlin, B. 2006. “On the Value of Mitigation and Contingency Strategies for Managing Supply Chain Disruption Risks” Management Science 52: 639-657.
Unnikrishnan, A., & Figliozzi, M. (2011). Online freight network assignment model with transportation disruptions and recourse. Transportation research record. Journal of the Transportation Research Board, 2224(1), 17–25. Vahdani, B., Zandieh, M., &Roshanaei, V.(2011). A hybrid multi-stage predictive model for supply chain network
collapse recovery analysis: A practical framework for effective supply chain network continuity management.
International Journal of Production Research, 49(7), 2035–2060.
Vahdani, B., Zandieh, M., and Roshanaei, V. 2011. “A hybrid multi-stage predictive model for supply chain net-work collapse recovery analysis: A practical framenet-work for effective supply chain netnet-work continuity manage-ment.” International Journal of Production Research 49 (7), 2035–2060.
Xu, M., Wang, X., & Zhao, L. (2014). Predicted supply chain resilience based on structural evolution against ran-dom supply disruptions. International Journal of Systems Science: Operations & Logistics, 1(2), 105–117.