HAL Id: hal-02109750
https://hal-mines-albi.archives-ouvertes.fr/hal-02109750
Submitted on 25 Apr 2019
HAL is a multi-disciplinary open access
archive for the deposit and dissemination of
sci-entific research documents, whether they are
pub-lished or not. The documents may come from
teaching and research institutions in France or
abroad, or from public or private research centers.
L’archive ouverte pluridisciplinaire HAL, est
destinée au dépôt et à la diffusion de documents
scientifiques de niveau recherche, publiés ou non,
émanant des établissements d’enseignement et de
recherche français ou étrangers, des laboratoires
publics ou privés.
A combined experimental and numerical approach for
radiation heat transfer in semi-crystalline thermoplastics
Sinan Boztepe, Olivier de Almeida, Rémi Gilblas, Yannick Le Maoult, Fabrice
Schmidt, Christian Gerlach
To cite this version:
Sinan Boztepe, Olivier de Almeida, Rémi Gilblas, Yannick Le Maoult, Fabrice Schmidt, et al..
A combined experimental and numerical approach for radiation heat transfer in semi-crystalline
thermoplastics.
International Journal of Thermal Sciences, Elsevier, 2019, 142, pp.142-155.
A combined experimental and numerical approach for radiation heat
transfer in semi-crystalline thermoplastics
Sinan Boztepe
a,∗, Olivier de Almeida
a, Rémi Gilblas
a, Yannick Le Maoult
a, Fabrice Schmidt
a,
Christian Gerlach
baUniversité de Toulouse, IMT Mines Albi, ICA (Institut Clément Ader), Campus Jarlard, F-81013, Albi cedex 09, France bProcter & Gamble, Brussels Innovation Center (BIC), Temselaan 100, 1853, Strombeek Bever, Belgium
Keywords:
Radiation heat transfer modeling Temperature-dependent thermo-optical properties IR thermography Polyethylene Optical scattering A B S T R A C T
This paper proposes a novel experimental-numerical approach for radiation heat transfer in semi-crystalline thermoplastics. The proposed experimental and numerical approaches were analyzed here for the case of IR heating of linear polyethylene (PE). The challenges for radiation transport in semi-crystalline polymers may be categorized into the two main aspects: optical heterogeneity in polymer medium due to semi-crystalline nature and, semi-transparency in certain type of such polymers, like PE. In this study, we address the temperature dependence in the thermo-optical properties of semi-crystalline thermoplastics concerning its effect as a thermal radiation parameter for radiation heat transfer modeling of such type of polymers. The temperature dependence in the optical properties of PE, namely transmittance and reflectance characteristics, were experimentally analyzed under heating condition and, the temperature-dependent thermo-optical properties of PE was de-termined. The experimental analyses showed that the change in the thermo-optical properties under heating is related to change in the optical scattering behavior in PE medium since it is strongly affected by its crystalline structure. The radiation heat transfer model was built based on optically homogeneous medium assumption at which the change in the amount of radiative energy absorbed by the PE medium under heating was introduced without modeling how the light scatters inside of the medium. Thus, the effect of optical scattering on the absorption characteristics of PE under varying temperature was taken into account without modeling the spatial distribution of the scattered light intensity at microscopic level, which offers computationally cost-effective numerical solutions. The accuracy of the numerical model was analyzed performing IR heating experiments where IR thermography and thermocouples were employed for the surface temperature measurements. Due to the semi-transparent nature of PE, an experimental method was developed for IR thermography of PE and its accuracy was analyzed. The experimental-numerical comparisons showed that the temperature field on PE can be closely predicted using its temperature-dependent thermo-optical properties. Thanks to the adopted com-parative case study, it was demonstrated how the temperature field predictions may deviate from the experi-mental thermal measurements due to the ignorance of this temperature dependence. Considering any type of monochromatic or polychromatic radiation source, the combined experimental-numerical approach proposed here may be adopted for temperature field predictions and non-invasive surface temperature measurements on the radiatively heated semi-crystalline
thermoplastics.-1. Introduction
IR heating is widely used for thermoforming process of semi-crys-talline thermoplastics. Thermoforming window - which is the tem-perature range required for a successful forming process - of semi-crystalline thermoplastics is much narrower than amorphous thermo-plastics, as the latter one is driven into rubber-like state above their glass transition temperature (Tg) that provides relatively large
processing window [1]. Conversely, semi-crystalline thermoplastics can be softened enough around their melting range which causes a narrow thermoforming window. Above Tgof such a polymer, its
semi-crystal-line phase still stands that keeps the material in tough-elastic state until crystals melt down in melting range [1,2]. As a consequence, the final temperature state at the end of the heating stage plays a major role for achieving a successful forming process with respect to the quality of a thermoformed part. Therefore, predictive model for accurate
∗Corresponding author.
E-mail address:sboztepe@mines-albi.fr(S. Boztepe).
temperature distributions is crucially important whereas it is known that the crystalline structure of polymers introduces an optically het-erogeneous medium which causes optical scattering phenomenon [3–7].
In terms of modeling the radiation heat transfer in optically het-erogeneous media, numerous examples of modeling approaches exist in literature that adopt well-known optical scattering theories, such as Rayleigh-Debye-Gans [8] or Mie [9,10] theory which allows to predict the spatial distribution of the scattered light intensity accurately. However, such radiation heat transfer models that handle complex ra-diation physics may be computationally costly, especially if spectral or geometrical complexity in a heated component is involved [11]. In contrast to laser heating applications, the radiation emitted by an IR source and transferred through a polymer medium is not monochro-matic, but in a range, which introduces such a complexity in terms of modeling of optical scattering, as the scattering behavior may change under varying wavelength in the spectral range of emitted radiation. Such a wavelength-dependent scattering behavior in semi-crystalline polymers was discussed in Refs. [4,5,12]. The common point that was stressed out in those studies is that the scattering behavior becomes weaker considering an increase in the wavelengths roughly between 0.5μm and 2 μm, which lies in the visible (VIS) and near-infrared (NIR) ranges.
Apart from the computational cost due to spectral complexity of IR radiation, the strong coupling between the crystalline structure of un-filled semi-crystalline thermoplastics and their optical scattering be-havior may also increase the complexity of a numerical approach, and thus computational cost. It is known that optical scattering in semi-crystalline polymers are strongly related to their semi-crystalline structure where the optical scattering behavior may evolve under heating, due to a potential change in their crystalline phase at the temperatures close to their melting ranges. It may therefore be useful to adopt a numerical model that considers this temperature-dependent optical behavior. Generally speaking, the studies that focus on the radiation heat transfer modeling for unfilled semi-crystalline thermoplastics rely on their thermo-optical properties analyzed at room temperature which results in a lack of modeling predictions in terms of temperature dependence in their absorption characteristics. One of the first efforts was given by Keller et al. [13] to explain temperature dependence in the absorption characteristics of various semi-crystalline polymers which was even-tually used as numerical input for laser processing modeling. In their study, it was experimentally proven that the optical penetration depth of nylon 11 (PA 11), which physically represents how strong radiation energy attenuates into the medium, increases once the temperature increases while an inverse trend was observed for polyethylene ter-ephthalate (PET). Becker et al. [14] proposed temperature-dependent optical properties for semi-crystalline polypropylene (PP), named as “effective absorption constant“. However, the temperature dependency in absorption characteristics of PP was modeled based on the change in the density of the polymer in the corresponding temperature range, eluding the physical background of scattering phenomena. Similarly, temperature-dependent absorption properties were introduced as a numerical input for laser transmission welding (LTW) process simula-tions of short glass fiber filled and unfilled PP and PA6 in Ref. [15]. The behavior about the absorption characteristics of the unfilled semi-crystalline polymers under varying temperature was however not highlighted. In addition, in the most of those studies, the temperature dependence in the thermo-optical properties of semi-crystalline ther-moplastics was analyzed at single wavelength, as laser assisted heating is performed at monochromatic wavelength. However, in case of IR heating of semi-crystalline polymers, the temperature dependence in their optical properties required to be characterized in a large spectral range. Because, the radiation emitted from an IR lamp is not at a monochromatic wavelength but in a spectral range, unlike to the laser heating.
In this paper, a novel experimental and numerical approach for
radiation heat transfer in semi-crystalline thermoplastics is proposed. The experimental and numerical approaches were analyzed for the case of IR heating of PE polymer. For the study, the temperature-dependent transmittance and reflectance characteristics of semi-crystalline PE was experimentally analyzed considering different temperatures between 25 °C and 128 °C. Under heating condition, the variation in the optical scattering behavior inside of PE medium and its crystalline phase evolutions were analyzed considering two different transmittance measurements, namely directional-directional (Tλ i,r (T)) and
direc-tional-hemispherical transmittance (Tλi,∩(T)). The effect of both the
measurements on the determination of the absorption characteristics of PE was highlighted. The analyses were extended characterizing the directional-hemispherical reflectance (Rλi,∩ (T)) of PE. Assuming an
optically homogeneous medium, the measured Tλi,∩(T) and Rλi,∩(T)
were used to calculate an equivalent temperature-dependent extinction coefficient (βλ(T)). The calculatedβλ(T) were then used as numerical
input so that the temperature dependence of absorbed radiative energy by the PE medium was taken into account in the model. Thus, the effect of optical scattering on the absorption characteristics of PE under varying temperature was considered without modeling the spatial dis-tribution of the scattered light intensity, which offers computationally cost-effective numerical solutions. The computational study was carried out using an in-house developed radiation heat transfer algorithm -RAYHEAT- and the commercial software -COMSOL Multiphysics®-, where iterative closed-loop computations were performed establishing a connection between them via MATLAB LiveLink. In order to assess the accuracy of the model, IR heating experiments were performed using PE plates and, surface temperature measurements were obtained via IR thermography and contact thermocouples. Since the spectroscopic analyses showed that PE has three narrow bands where the polymer is close to be opaque, an experimental methodology was developed for obtaining the most accurate surface temperature measurements on PE via IR thermography. The accuracy of IR thermography of PE was analyzed performing successive IR thermography tests.
2. Characterization of temperature-dependent optical properties 2.1. Materials and sample preparations
Highly crystalline linear PE was used in this study. The averaged peak crystalline melting temperature and the weight-average molecular weight (Mw) of the studied PE resin is around 132 °C and 150000
Daltons, respectively. The PE polymer in the form of pellets was in-jection molded and square PE plates with dimensions of 78 × 78 × 2.2 mm were fabricated. In order to analyze the tempera-ture-dependent optical characteristics of PE, the injected plates were then cut into small pieces and compressed in a heating chamber at 180 °C in order to obtain thin samples with controlled thickness. All the compressed samples were quenched into liquid nitrogen (LN2)
im-mediately after opening the heating chamber. The main reason for quenching the compressed PE samples is to achieve the closest crys-talline structure possible in comparison to the cryscrys-talline structure of the industrial PE precursors used for actual thermoforming processes of PE. In the actual thermoforming process of PE in industry, the PE precursors are fabricated under rapid cooling conditions prior to the IR heating and forming steps, where their crystalline phase is greatly af-fected by cooling speed. The samples were prepared under the identical preparation conditions in three different thicknesses (0.25, 0.50 and 0.75 mm). The thickness measurements of the compressed samples showed that the thickness variation in each sample is around ± 20μm. In addition, the surface roughness of the compressed PE samples was analyzed regarding the surface characteristics of the metal compression plates of the heating chamber. Due to the semi-transparency of PE polymer, its surface roughness could not be obtained appropriately using a non-contact profilometer. Instead, the tests were conducted using the compression plates, where its surface roughness was assumed
identical to the PE samples. The arithmetic mean (Ra) and
root-mean-square roughness (Rq) of the compression plates were found around
0.37 and 0.46μm, respectively. The further details related to the sample preparation can be found in Ref. [5].
Apart from the small samples used for the temperature-dependent optical properties measurements, several numbers of the fabricated PE plates were kept for the IR heating experiments to perform preliminary IR thermography analyses and the numerical-experimental comparisons that are presented in Section4.
2.2. Test methodology for temperature-dependent spectroscopic measurements
The temperature dependency in the optical properties of PE was analyzed performing Tλ i,r (T), Tλ i,∩ (T) and Rλ i,∩ (T) tests. The
overview of the test setups used for Tλi,r(T), Tλi,∩(T) and Rλi,∩(T)
measurements are schematically displayed inFig. 1(a), (b) and (c), respectively. The Tλi,r(T) tests were done using a Fourier Transform
Infrared (FT-IR) spectrometer (Bruker Vertex 70) and, the Tλi,∩(T) tests
were performed employing another FT-IR spectrometer (PerkinElmer 950) combined with an integrating sphere. For both the Tλi,∩(T) and
Tλi,r(T) tests, a heating stage (Bruker A599) was used so that the PE
samples, which has a diameter (D) of 13 mm, were mounted into the heating stage and, heated by conduction during the measurements. The heating stage was positioned at the entrance port of the integrating sphere for the Tλi,∩(T) tests whereas no integrating sphere was used in
the Tλi,r(T) tests. Considering an optically heterogeneous medium, the
incident light flux (ϕλi) may be either directly transmitted or scattered.
Hence, as shown inFig. 1(b), transmittance tests performed with in-tegrating sphere enable to detect both the forward-scattered (ϕλs) and
directly transmitted (ϕλt) light fluxes which travel through such a
heterogeneous medium. The identical temperature steps were adopted for both types of the transmittance test. Between the two consecutive
measurement steps of both the Tλi,∩(T) and Tλi,r(T) tests, the samples
were heated up in a monotonically increasing manner and waited for 2 min to reach a steady-state temperature.
The Rλ i,∩ (T) tests were done employing SOC-100 model
Hemispherical Directional Reflectometer (HDR) built by Surface Optics Corporation. The average waiting time for the Rλ i,∩ (T) tests was
around 5 min where the samples were also heated by conduction using the heating unit of the SOC-100 HDR (Fig. 1(c)). Since two different heating units were used for heating the samples in the temperature-dependent transmittance and reflectance tests, the waiting time for reaching steady-state temperature at each consecutive temperature step was different. In addition, for the Rλi,∩(T) tests, a thin piece of black
metal plate was mounted between the heating unit and the PE sample as our previous studies showed that PE is highly semi-transparent [5,16]. Thanks to this step, the amount of radiation flux that is trans-mitted through the sample medium would not reflect back and received by the detector, which may avoid having an erroneous reflectance measurement.
The Tλi,∩(T) and Rλi,∩(T) tests were done using the 0.25, 0.50 and
0.75 mm thick PE samples whereas the Tλi,r(T) tests were carried out
using 0.75 mm thick samples. It should be mentioned here that the crystalline morphology of PE may be altered under varying tempera-ture, in particular the crystalline substructures, namely the lamellae [17,18]. Hence, several numbers of samples were prepared in identical condition and each sample was used for each individual Tλi,r(T), Tλi,∩
(T) and Rλi,∩(T) test. The reason behind this is to eliminate potential
change in the optical characteristics of PE that may be induced by the difference in the crystalline phase of an already-tested sample. How-ever, the waiting time at the each temperature step of all the Tλi,r(T),
Tλi,∩(T) and Rλi,∩(T) tests may allow melting-reorganization in the
crystalline phase of linear PE [19], especially at the temperatures close to its melting range. Nevertheless, it was assumed that the potential effect of the reorganization in the crystalline phase of PE to the optical
characteristics is negligible. In total, the transmittance and reflectance measurements were performed at 15 and 11 different temperature steps, respectively. The ambient temperature during the spectroscopic measurements was 25 °C. Overview of all the Tλi,r(T), Tλi,∩(T) and Rλ i,∩(T) tests are presented inTable 1. In the table, the temperature steps
represent the actual temperature (Tactual) on the sample surface where
the measurements were done. It was observed that the set temperature (Tset) on both the heating devices and, the Tactualon the measurement
zone were different. Thus, preliminary tests were done for determining the Tactualof each adopted measurement step prior to the Tλi,r(T), Tλi,∩
(T) and Rλi,∩(T) tests.
It should be noted that the degree of crystallinity (Xc(%)) of all the
PE samples was determined via calorimetric analyses, prior to the temperature-dependent spectroscopic measurements. It was found that Xcof all the quenched PE samples was around 67%, whereas, under
heating, this value was reduced to around 62%, 57% and 34% at 100 °C, 115 °C and 128 °C, respectively. Apart from determining the Tactualfor
all the tests, the temperature variations alongside the polymer surface was investigated for the heating case applied in both the Tλi,r(T) and
Tλi,∩(T) tests. The heating stage used in these tests heats the material
from its edge, and therefore the middle of the sample -where trans-mittance measurements are performed-has a lower temperature which may be critical in terms of accuracy in the measurements. The pre-liminary tests dedicated for analyzing these points were carried out using poly (ethylene terephthalate) (PET) samples. For each tempera-ture step, the temperatempera-ture profile on the PET surface was recorded using an IR camera (FLIR SC325). PET was chosen as a reference ma-terial for these analyses as, it is opaque in the operating range of a typical IR camera in contrast to PE polymer [20]. Hence, a reliable surface temperature on PET could be obtained via IR thermographic measurements [21]. It was then assumed that the temperature recorded from PET surface is identical to the PE samples considering that con-duction and convection heat transfer are identical for both the poly-mers. Obtaining the temperature profile from the edge through the middle of the sample enables to adjust the size of the incident light that is transmitted through the sample, which represents transmittance measurement zone. Because the temperature variations are desired to be negligibly small in the transmittance measurement zone so that a reliable correlation between the actual measured temperature and the transmittance can be obtained at each measurement step. Thus, the beam width of the incident light that is sourced from the spectrometer was set to 1.5 mm since the temperature variation inside of this zone was lower than 0.3 °C. For the Rλi,∩(T) tests, the preliminary tests were
done using 0.5 mm thick PE samples and the Tactualof each
measure-ment step was determined using the thermocouple (TC) of the heating unit in SOC-100 HDR. As shown inFig. 1(c), the TC is attached on the top surface of the sample where also the reflectance measurements are performed. Since the sample is heated from below in these tests, the temperature variation through its thickness is likely to happen. How-ever, it may be relatively small considering the thicknesses of the tested samples, which are between 0.25 and 0.75 mm. Hence, it was assumed that the effect of thickness on the top surface temperature of all the tested samples is negligibly small. Therefore, Tactualof each
measure-ment step obtained using 0.5 mm thick samples was also adopted for 0.25 mm and 0.75 mm thick samples. In addition, thermal coupling agent was used between the heating unit and the sample to secure good thermal contact in each Rλi,∩(T) test.
2.3. Temperature-dependent thermo-optical properties of PE
As aforementioned, the crystalline structure of semi-crystalline polymers introduces an optically heterogeneous medium which induces optical scattering and complex radiation transport inside of polymer medium. Potential evolution in their crystalline structure under varying temperature may therefore causes to change the optical scattering be-havior. The question arises here about the accuracy of the temperature-dependent absorption characteristics of PE medium, parametrized asβλ
(T) in this study. βλ of a semi-transparent medium is theoretically
calculated using the medium's reflectance and transmittance char-acteristics [22,23]. Hence, it is of prime importance to understand which type of optical measurement may provide the most accurate calculation on the temperature-dependent absorption behavior in the optically heterogeneous and semi-transparent PE medium. In order to investigate this point; a critical analysis was carried out considering the temperature-dependent Tλ i,r (T) and Tλ i,∩ measurements on the
0.75 mm thick identically prepared PE samples. InFig. 2, the Tλi,r(T)
of a PE sample was compared to its Tλi,∩values that were measured at
25 °C. In the figure, the Tλi,r(T) measurements are labeled regarding
the temperature at which they were obtained. As displayed in the figure, there is a significant difference between the measured Tλi,rand
Tλi,∩of the identical PE sample. The dashed line displayed in the figure
show that the Tλi,∩of the sample is around 72% at 1μm, whereas its Tλ i,rmeasured at 25 °C is around 4%. It is a clear evidence that significant
part of the transmitted light flux is actually forward-scattered as the Tλ i,rmeasurements lack in detecting all the transmitted light flux through
the optically heterogeneous medium. It should also be noted that some amount of the light flux may also be back-scattered inside of the polymer medium and may not enter the integrating sphere [24]. This point is discussed further in Ref. [5] based on the comparison between the Tλi,rand Tλi,∩of PE samples prepared in different thicknesses and
analyzed at room temperature. It was observed that the amount of back-scattered light flux may be negligible in comparison to ϕλsconsidering
the same spectral range, presented inFig. 2.
At higher temperatures, the Tλi,r(T) values increases and surpasses
the Tλi,∩that was obtained at 25 °C, which can be attributed to the
weaker optical scattering under heating condition. Once the
Table 1
The PE samples and the testing characteristics of the Tλi,r(T), Tλi,∩(T) and Rλi,∩(T) tests.
Type of measurement Sample thickness (mm) Temperature steps (Tactual(oC)) of the measurements Spectral range of the measurements
Tλi,r(T) 0.75 25, 48, 71, 84, 97, 110, 114, 116, 118, 120, 121, 122, 123, 126, 128 0.8–2.5μm
Tλi,∩(T) 0.25, 0.50 and 0.75 0.25–2.5μm
Rλi,∩(T) 0.25, 0.50 and 0.75 25, 71, 97, 103, 107,110, 114, 118, 120, 124, 128 2–25μm
Fig. 2. Comparison between the Tλi,r(25 °C) and Tλi,∩(25 °C) of the 0.75 mm
temperature is above 114 °C a dramatic increase in the Tλi,r(T) is seen.
It reaches its maximum values above 120 °C which is around 90% transmittance at 1μm. The changes in the color of the polymer under heating can also be seen clearly in the successively taken photos during the test (Fig. 2). The PE polymer has a milky color at lower tempera-tures and becomes totally transparent after 120 °C. The reason behind these changes is obviously related to crystalline structure evolutions since the optical scattering becomes weaker at higher temperatures, especially closer to the melting range of PE [5]. In addition, the com-parisons between the Tλi,r(T) and Tλi,∩of an identical PE sample
indicates that the amount of scattered and transmitted light may not be negligible for optically heterogeneous semi-crystalline PE medium, otherwise its temperature-dependent absorption characteristics may be overestimated, due to underestimation of transmittance levels. Conse-quently, in this study, the temperature-dependent absorption char-acteristics in semi-crystalline PE was determined characterizing its Tλ i,∩(T) and R
λi,∩(T).
InFig. 3(a) and (b), the typical trend obtained in each Tλi,∩(T) and
Rλi,∩(T) tests are presented, respectively. It is seen inFig. 3(a) that the
Tλi,∩of the 0.75 mm thick sample in the range 0.4–1.7μm increases
under heating where the increase is more pronounced after 116 °C. This corresponds to temperatures close to the melting range of PE [5]. In addition, no significant change was observed in Tλi,∩of all the tested
PE samples for the wavelengths greater than 1.7μm. It was thus as-sumed that Tλi,∩remains unchanged under heating considering the
spectrum between 1.7 and 2.5μm. Furthermore, similar to the trend seen in the Tλi,r(T) measurements, the Tλi,∩at 1μm of the 0.75 mm
thick sample that is around 72% at 25 °C increases up to 90% at 128 °C. Hence, one can analyze that the Tλi,r(T) and Tλi,∩of the identically
prepared different PE samples show the same level of transmittance once the polymer becomes transparent above 120 °C. It is a clear evi-dence that PE medium becomes completely optically homogeneous above these temperature, since the Tλi,r(T) and Tλi,∩measurements
obtained from two different FT-IR spectrometer are very close. The variation between all the identically prepared and tested samples was found around 0.3–0.5% which can be attributed to small variations in the sample thicknesses.
In addition, the temperature dependent trend in the Tλi,∩values of
0.25 and 0.5 mm thick PE samples showed similar behavior to the one presented inFig. 3although, small variations were observed about the temperature at which their Tλi,∩greatly increases. This might be due to
the difference in their optical scattering characteristics that may result from some differences in their crystalline morphology. Indeed, although all the PE samples were quenched into LN2, the difference in sample
thicknesses may cause some variations in their cooling history and thus in morphology of the linear PE [25].
In contrast to the trend in Tλi,∩(T), an inverse relation between the
Rλi,∩of PE and temperature was observed. As shown inFig. 3(b), the
temperature change is less effective on the reflectance of PE in com-parison to its temperature-dependent transmittance. Similar to the findings in the Tλi,∩ (T) tests, consistency was observed in the
de-creasing trend in the Rλi,∩(T) of all the tested PE samples tests above
107 °C. For the sake of brevity inFig. 3(a) and (b), the temperature dependent trend in the Tλi,∩and Rλi,∩values are presented considering
only certain number of measurement steps.
In previous studies [5,26], it was found that the strong coupling between crystalline morphology and the transmittance characteristics of PE becomes negligible in MIR range (2–25μm). It was therefore as-sumed in this study that the transmittance characteristics of PE in MIR range are independent of temperature. Hence, Tλi,∩of the PE samples
measured at room temperature was adopted for this range. Conversely, no temperature-dependent Rλ i,∩(T) measurements were able to be
obtained for the wavelengths lower than 2μm, due to the limitations in the spectral response of the employed FT-IR devices. Therefore, tem-perature dependency in the reflectance characteristics of PE was as-sumed negligible for the wavelengths lower than 2μm. Although this is not a rigorous assumption, in the corresponding spectral range, the further Rλi,∩tests were done at 25 °C using PE samples prepared with
identical thicknesses, but with different crystalline structures where the samples were annealed under stepwise cooling. It was observed that the crystalline structure of PE has a slight effect on its Rλi,∩values. It was
thus assumed that a change in the crystalline structure under varying temperature has a negligible effect on the Rλi,∩of PE.
Based on the measured Tλi,∩(T), Rλi,∩(T) and the conservation of
radiative energy (Equation(1)), the fraction of absorbed energy, also called absorbance (Aλi,∩(T)) can be determined for each temperature
step. Assuming an optically homogeneous semi-transparent medium,βλ
of PE polymer can be calculated at each corresponding temperature step regarding the transmittance and the reflectance characteristics of its medium (Equation(2)) [22].
Aλi,∩(T)+ Tλi,∩(T)+ Rλi,∩(T)= 1 (1)
= ⎡ ⎣⎢ + − − ⎤⎦⎥ = −− = ∩ ∩ − R T ρ τ ρ τρ τ T T ρ τ ρ τ τ e ( ) 1 (11 ( ) ) and, ( ) (1 ) 1 ( ) where; λ λ λ λ λ λ λ λ λ λ λ λ λ β x i, 2 2 2 2 i, 2 2 λ. (2)
In Equation (2), x, τλandρλrepresent thickness, intrinsic
trans-mittivity and reflectivity of the PE, respectively [22]. The computation ofβλat each temperature step was carried out in MATLAB adopting an
inverse method based on SQP (Sequential Quadratic Programming) estimation algorithm. In the method, double objective function (J) was created considering the experimental and numerically computed re-flectance (Rnumerical (T)) and transmittance (Tnumerical (T)) values
Fig. 3. Typical trend obtained in the Tλi,∩(a) and R
(Equation(3)). Tnumericaland Rnumericalwas computed adopting
Equa-tion(2)and initial guessed values forρλand τλ. The iterative-based
computation was performed until the solver error condition is satisfied at which the value of J is smaller than the tolerance value (1e-6). At the end the iterative computation, theρλ, τλvalues, and eventuallyβλwas
determined. This computation was done for the each measured Tλi,∩
(T) and Rλi,∩(T) values at each corresponding temperature step. The
in-house developed estimation algorithm is explained further in Ref. [27]. = ∩ −∩ + ∩ −∩ J Tλ ( )TT T( )numericalT ( )T R ( )TR R( )T ( )T λ λ numerical λ i, i, i, i, (3)
InFig. 4 (a) and (b), the computed βλ (T) values are presented
considering the spectrum between 0.6 and 7μm. Again, for the sake of clarity, some of the computedβλ(T) values are not presented in the
figure. The temperature dependence inβλis illustrated inFig. 4(a),
including the spectrum between 0.6 and 1.6μm. It is clearly seen that the trend inβλ(T) is monotonically decreasing under heating. This may
be plausible, as the increase in the Tλi,∩(T) values is significant in this
spectrum, as presented inFig. 3(a). In terms of IR heating with an IR lamp, such an evolution in the thermo-optical properties of semi-crys-talline polymers may be crucial as considerable amount of radiation energy may be emitted in the corresponding spectrum. To illustrate this point, the spectral ranges of the black body emissive power (Eλb(W/
m2μm)) at 2000 and 2600 K were displayed together with the β λ(T) of
PE inFig. 4(b). Considering the fact that a halogen IR lamp used for injection stretch blow molding (ISBM) processes has a temperature around 2000–2600 K, maximum emission wavelength (λmax(μm)) of
the lamp should be theoretically around 1.1–1.4μm, regarding to Wien's displacement law [22,23]. In addition, nearly 95% of total en-ergy emitted by such an IR lamp lies betweenλmax/2 and 5λmaxwhich
reflects a spectral range roughly between 0.6 and 7μm [20,22,23]. It may therefore be concluded that the temperature dependence in the thermo-optical properties of semi-crystalline PE seen in NIR range may have a significant effect on the amount of absorbed energy, due to both high level of emitted radiation by IR lamp and the variation in its ab-sorption characteristics.
Based on the temperature-dependent behavior observed in the Tλi,∩
(T) tests, the Tλi,∩(T) measurements obtained between 25 °C and 97 °C
were ignored as the change in temperature did not cause any variation in the measured values. By the same token, Rλi,∩(T) measurements
between 25 °C and 107 °C were ignored. The main reason to neglect the measurements that shows no temperature dependency is to reduce computational cost. By reducing the number of numerical input, it will eventually reduce the number of iteration steps of the closed-loop computations, which is explained in detail in Section3.2. At the end,
theβλ(T) was computed at 12 different temperature steps between
25 °C and 128 °C. Each calculatedβλ(T) was used as input in the
nu-merical model for computing the radiative power absorbed by the polymer medium, namely radiative source term (∇.qr(W/m3)), for
each corresponding temperature step. Prior to the∇.qrcomputations,
theβλ(T) was integrated for the spectral range of 95% of the emitted
energy from an IR lamp that is betweenλmax/2 and 5λmax(Equation
(4)). This spectral range can be determined by knowing the temperature of IR emitter and adopting Wien's displacement law. It should also be noted that I°
λin the equation below represents the incident radiation
intensity emitted from an IR lamp.
∫
∫
= = = = = β T β T I dλ I dλ ( ) ( ) λ λ λ λ λ λo λ λ λ λ λo /2 5 /2 5 1 max 2 max 1 max 2 max (4)3. Background of the numerical model
3.1. Temperature-dependent thermophysical properties
The temperature dependence in the thermophysical properties of PE, namely thermal conductivity (k (W/mK)) and specific heat capacity (Cp(J/kgK)), were taken into account in the model. It is known that
temperature-dependence in k of semi-crystalline polymers is strongly affected by their crystalline structure [1,17]. The temperature-depen-dent k of PE used in the model was adopted from literature [1]. The temperature-dependent variation of the adopted k values was presented in our previous study [5]. Although, variations in Xcmay result in an
increase of the conductivity of semi-crystalline polymers [1,19,28], it was assumed here that k was independent of Xc. In addition, highly
ordered crystalline structures that form in certain directions may in-troduce anisotropy in the thermal conductivity of semi-crystalline polymers as stressed in Refs. [28,29]. Such a potential effect was ne-glected in the numerical model and isotropic conductivity was assumed for PE.
The apparent heat capacity (Cp,apparent(J/kgK)) of the PE, that
re-presents the total energy required for increasing the temperature of unit mass of polymer, was measured employing a power compensated dif-ferential scanning calorimeter (DSC). As shown inFig. 5, the Cp,apparent
of PE under heating conditions is not strictly monotonic but exhibits a phase transition related to the melting of the crystalline phase of PE. The temperature-dependent apparent heat capacity (Cp,apparent(T)) can
thus be described with Equation(5)considering the temperature-de-pendent specific heat capacity (Cp (T)) and the phase transition
Fig. 4. The significant variation inβλ(T) of PE polymer between room temperature and 128 °C (a) and theβλ(T) values in the spectral ranges of a black body at 2000
enthalpyΔHmelting(J/g) [17,30]. For the sake of simplicity, the melting
kinetic was however not modeled and the Cp,apparent(T) was directly
used as an input in the numerical model.
= +
Cpapparent( )T C Tp( ) ∆HdTmelting (5)
Under heating condition, the potential reduction in Xcdue to partial
melting of crystalline phase may also cause to change the density (ρ) of PE [17,19,31]. As a consequence, the specific volume (V¯) of the ma-terial -which is reciprocal ofρ-may change significantly under varying temperature [1,32] which physically addresses the thermal expansion of polymer medium. Considering isochoric simulations, such expansion in polymer geometry was not taken into account hence; the spatial expansion in the node coordinates of the modeled mesh elements is ignored under varying temperature. On the contrary, in terms of com-putational cost for radiation transport and the absorbed radiation en-ergy in the model, the consideration of this effect would introduce complexity as the ray tracing computations should be rerun at each computational step. Therefore, temperature-dependent ρ of PE was considered as negligible in the model. Nevertheless, the initial value of theρ was defined as a function of the Xcof PE samples in the model. The
two-phase model was adopted for defining the global density (ρglobal) of
PE regarding the fraction of crystalline and amorphous phases (Equa-tion(6)) [31,33]. Theρglobalin Equation(6)represents the macroscopic
density of simulated polymer geometry. = ⎛ ⎝ ⎞⎠+ ⎛⎝ ⎞⎠ − ρglobal X 1 ρ X ρ 1 crystalline crystalline crystalline amorphous (6)
In this study, Xcof PE was taken as 67% which corresponds to the
average value measured on the injected PE plates and obtained from the calorimetric analyses. The density of crystalline and amorphous phases of PE that are appeared in Equation(6)were adopted from literature [19,34], as 1000 and 855 kg/m3, respectively. Hence, ρ
global was
de-fined as 952 kg/m3in the model.
3.2. Radiation heat transfer modeling approach based on temperature-dependent thermo-optical properties of semi-crystalline thermoplastics
As aforementioned, absorbed radiation inside of PE polymer medium was computed using an in-house developed radiation heat transfer algorithm -RAYHEAT-. In the algorithm, thermal radiation computations are done based on Ray Tracing method so that the emitted radiation from an IR lamp is modeled as traveling in straight lines, called rays. In RAYHEAT, only the tungsten filament of an IR lamp is taken into account. Therefore, the length of each IR lamp is modeled considering the length of its tungsten filament. Each single filament is modeled by equivalent cylinders where its spiral form is
neglected. In this study, the diameter of a cylindrical filament is mod-eled as 2.15 mm, in accordance with the IR heating experiments pre-sented in Section4. The emitted energy from the filament of a halogen IR lamp is assumed Lambertian and the source is considered as a grey body. In addition, the discretization of the ray from the surface of modeled filament was performed adopting a stochastic approach [35,36]. Thanks to this, a numerous number of rays are released ran-domly from the cylindrical surface of filament. The total amount of the emitted energy is uniformly shared among all the rays. The further explanations about the released rays from the modeled filament and the schematical illustration of the released rays in RAYHEAT can be found in Ref. [35]. In the model, the emitted rays which do not touch the polymer geometry is considered lost. Once a ray intersects the polymer geometry, some of the carried energy is reflected and the remaining part of the energy is transmitted through the polymer medium, where the direction of each ray is changed at the air/polymer interface due to refraction. The change in the direction of each ray is computed based on Snell-Descartes law in RAYHEAT, as explained in Ref. [35]. The re-fractive indices of air and PE medium were adopted in this study as 1 and 1.54 [7], respectively. The current version of RAYHEAT is based on optically homogeneous medium assumption. Therefore, the absorption of radiative energy inside of PE medium is computed following the Beer-Lambert Law, according to Equation(7)[22].
= − = − +
dI
dzλ β z I zλ( ) ( )λ ( ( )κ zλ D z I zλ( )) ( )λ (7)
The radiative power absorbed by the polymer medium,∇.qr, at the
depth “z” is defined with Equation(8), at whichβλis the sum of both
absorption (κλ) and scattering coefficients (Dλ):
∫
∫
∇⋅q z( )= ∞ −β I(0)e− dλ= ∞−(κ +D I) (0)e− + dλ r λ λ β z λ λ λ κ D z 0 0 ( ) λ λ λ (8) The working algorithm of the model is displayed schematically in Fig. 6. As RAYHEAT is a MATLAB-based code, the iterative closed-loop between RAYHEAT and COMSOL Multiphysics®was established usingMATLAB LiveLink feature which allows to transfer the computed∇.qr
into COMSOL Multiphysics®as a numerical input at each time step.
More specifically, in RAYHEAT,∇.qrwas computed for each volumetric
mesh element of the modeled polymer. Based on ray tracing approach, knowing to the information on the direction and the position of each ray entering the mesh element, the traveled distance inside of the ele-ment, and thus the attenuated power of each ray was computed. The accumulation of the attenuated power of all the rays traveling through each volumetric mesh element resulted to obtain the ∇.qr (W/m3). The
absorbed power of each mesh element was transferred from RAYHEAT to COMSOL using the MATLAB Livelink, where also the identical mesh elements were transferred.
The algorithm closed-loop then consisted in solving the transient heat transfer equation (Equation(9)) to predict the temperature field and in calling back RAYHEAT for updating the∇.qrof polymer medium
regarding the computed temperature at the end of the corresponding iteration step. Therefore, the change in the amount of radiative energy absorbed by the PE medium during the time step - which is a function of the temperature and the spatial coordinates of the modeled mesh ele-ment-, is introduced in the model. As the calculatedβ T( ) corresponds to the specific temperature step adopted for the temperature-dependent optical properties measurements, the numerical model interpolates ∇.qr, regarding the∇.qrof the two most close temperature steps in case
that a computed temperature of a mesh element is somewhere between the adopted temperature steps. Otherwise, in a case that the tempera-ture of a mesh element is lower than 25 °C or higher 128 °C, the model assigns the ∇.qr computed at 25 °C or 128 °C, respectively. Such a
temperature dependency at mesh scale was not considered for the thermophysical properties of PE thus, temperature-dependent k and Cp
was assigned as a global parameter on the modeled PE medium. Hence
Fig. 5. Superposition of Cp(T) andΔHmelting of PE obtained from the DSC
the model computes the average temperature of the medium and up-dates these parameters at each computational time step.
∂
∂ = ∇⋅ ∇ − ∇⋅
ρ C Τ. p t (k Τ) q Τ x y zr[ , , , ] (9)
For thermal radiation computations based on ray tracing method, one of the important parameters is the number of modeled rays. In RAYHEAT, the effect of the number of ray on computational time and accuracy in the∇.qrwas analyzed in Ref. [35] considering a square PET
polymer plate heated by a single IR lamp. Their convergence studies suggested that the modeled rays greater than 1 million allows com-puting the absorbed radiation with an error less than 5% in RAYHEAT. Nevertheless, this suggestion may only be a reference for heating a simple geometry since an increase in the complexity of the geometry may also affect the accuracy of ray tracing computations. The accuracy may not be related to the ray tracing method as it is independent of geometric complexity but to the finite element meshing of the complex geometries and, its interaction to the intersected modeled rays [36].
In order to reduce the computation cost, the radiative energy that may be absorbed by each modeled 3D mesh element was computed and saved before starting the iterative closed-loop computations. Therefore, all the potential scenarios of the∇.qrvalues absorbed by each mesh
element were computed regarding to all the integratedβ T( ) values. As aforementioned, the temperature steps where no variation in both Tλi,∩
(T) and Rλi,∩(T) measurements seen was ignored for theβ T( )
calcu-lations. Thanks to this, the number of potential scenarios for the com-puted∇.qrwas reduced. In total, 12 different scenarios of∇.qrwere
created for 12 temperature steps. The boundary conditions and adopted
parameters for both the cases of numerical simulations are presented in Table 2.
4. IR heating of PE and model predictions 4.1. IR heating experiments and thermal measurements
The accuracy of the numerical model was analyzed performing numerical-experimental comparisons for the case of IR heating ex-periments with the injection molded PE plates. The surface tempera-tures of the plates were measured via IR thermography and conven-tional contact thermocouples. Due to the semi-transparent medium of PE, preliminary experiments were done and, an experimental metho-dology was developed to obtain an accurate surface temperature via IR thermography. Subsequent preliminary IR thermography tests were performed using PET and PE plates where both the plates were geo-metrically identical. For all the IR heating experiments, a single IR lamp with a power of 1 kW (Toshiba JHS 235 V) was used. The cylindrical tungsten filament of the used IR lamp is 300 mm long, with a diameter of 2.15 mm.
4.1.1. IR thermography in semi-transparent PE medium and preliminary experiments
Regarding the transmittance behavior of PE, it has several narrow bands in MIR range where it shows very low transmittance and there-fore it is close to be opaque [5,37,38]. Therethere-fore, accurate IR thermo-graphic measurements may be performed on PE surface only con-sidering these spectral bands. A typical long-wave (LW) IR camera has
Fig. 6. Working algorithm of the developed numerical model.
Table 2
The assumptions and input parameters adopted for the IR heating modeling of PE.
Input parameter Source of the parameter
Thermophysical properties of PE k (W/mK) Adopted from Ref. [1]
Cpapparent(J/kgK) DSC measurement (Fig. 5)
ρglobal(kg/m3) Equation(6)and DSC measurements
Thermo-optical properties and the temperature-dependent
absorption characteristics of PE β T( )
Calculated from the measured Tλi,∩(T) and Rλi,∩(T) at 12 temperature steps: 25, 97,
110, 114, 116, 118, 120, 121, 122, 123, 126, 128 °C ∇.qr(T) For T < 25C: ∇.qr(25 °C) for all mesh elements
For 25 < T < 128 °C: ∇.qr(T) interpolated between the two closest temperature steps
an operating spectral range between 7 and 14μm [20] that cover two of the narrow spectral bands - around 7.6 and 13.6μm, respectively-, at which PE has very low transmittance. However, as they are relatively narrow in comparison to the operating range of a typical IR camera, narrow bandpass (NBP) optical filters are necessary for quantitative IR thermographic measurements at these spectrums. At very first step, two different NBP optical filters (Northumbria Optical Coatings) close to 7.6 and 13.6μm with bandwidths of ± 0.10 μm and ± 0.21 μm respectively were employed for the IR thermography of PE polymer. Both the filters were externally mounted and tested on two different IR cameras, namely a cooled LW IR camera (AGEMA 880) and an uncooled mi-crobolometric IR camera (FLIR SC325). Thanks to this step, the sensi-tivity of both the employed IR cameras was analyzed at these preferably selected wavelengths. Initial analyses showed that the sensitivity of SC325 was too low for both the narrow bands, whereas enough sensi-tivity was recorded by the cooled LW IR camera only for the optical filter which has a spectrum between 7.5 and 7.7μm [16,39]. It should be mentioned here that the operating spectral range of the employed LW IR camera is between 8 and 12μm [21] indicating that spectral sensitivity of the IR detector is nominal in the corresponding range, whereas the detector is still sensitive at the wavelengths beyond, but close to, this range. Similarly, our sensitivity analyses showed that the LW IR camera is still sensitive enough in the spectral band around 7.6μm. Nevertheless, an extra step was required to be applied to adjust the sensitivity of the IR camera in terms of obtaining a correct tem-perature related to the energy captured by the IR detector of the camera. Therefore, the optical filter mounted IR camera was calibrated using a black body calibration source (Landcal P550P) so that corre-lation between the IR radiation captured by the camera and a measured temperature was established. The calibration was done choosing re-ference temperatures on the black body source between 60 and 120 °C. The isothermal unit (UI) detected by the IR camera was registered for each corresponding reference temperature. Thus, a calibration curve was developed which enables to convert the detected energy emitted from the surface of the polymer to a temperature value. This calibration step is explained further in Ref. [39].
The question arises here about the sensitivity of the optical filter mounted IR camera in case of receiving the emitted energy from a real body, unlike a black body. This point was analyzed performing IR thermography tests using PET polymer. As aforementioned, PET be-haves opaque in the operating spectral range of a typical IR camera. More specifically, it was reported in Ref. [21] that the optical pene-tration depth (Dp) of PET is around 30μm in the spectral range between
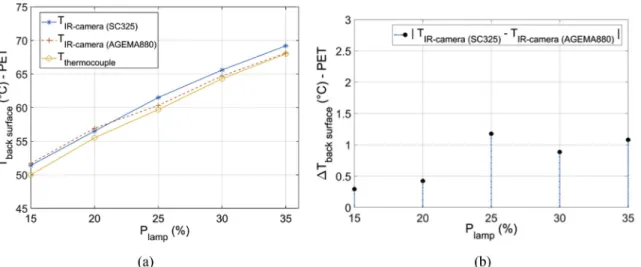
5 and 20μm. Hence, PET was used as a reference material for obtaining a reliable surface temperature via IR thermography and analyze the accuracy of the filter mounted LW IR camera. For the tests, a PET plate was heated using a single IR lamp and its back surface was monitored by the filter mounted LW IR camera (AGEMA880). The back surface temperature was also measured employing the other IR camera, FLIR SC 325. As no filer was mounted in this camera, and it operates between 7.5 and 13.5μm [20], its measurements were considered as a reference for analyzing the accuracy of the optical filter mounted IR camera. In addition, one TC attached in the middle zone of the back surface for the comparisons. During the experiments, power of the IR lamp (Plamp(%))
was changed between 15% and 35% of its nominal power and the temperature measurements were done once back surface temperature reached steady state. At the end, 5 different measurements were ob-tained between 50 and 70 °C. The surface temperature was read by the two IR cameras on the arbitrarily chosen zone which was next to the attached TC. All the recordings obtained by the IR cameras and the TC were compared at each steady-state temperature step (Fig. 7(a)). It was found that the maximum temperature difference (ΔT (°C)) between the values recorded by the two IR camera was around 1 °C (Fig. 7 (b)) verifying that the filtered energy captured by the optical filter mounted IR camera is sufficient to obtain accurate temperatures on a real body. Apart from the sensitivity of the IR camera, the accuracy of the
surface temperature measurements on PE was analyzed in terms of the Dpof PE in the spectral range where IR thermography was achieved. In
our previous study [39], the Dpof PE was calculated considering the
spectral band of the employed NBP optical filter, between 7.5 and 7.7μm. Unlike to PET, it was found that its Dpis around 350μm
in-dicating that the absorbed and therefore emitted radiation may not be considered on the surface of PE but, in a range close to surface. The relatively high Dpof PE raises another question related to the accuracy
of the surface temperature of PE obtained by IR thermography. In other words, the temperature read by the IR camera may correspond to the temperature of the 350μm thick layer beyond the surface. Hence, it was required to understand how much difference may occur between the actual surface temperature and the recorded temperature by the IR camera. This point was investigated performing another preliminary IR thermography test using a PE plate. Similar to the former preliminary tests done with PET, the plate was heated using the identical IR lamp and the back surface temperature of the PE plate was recorded by the optical filter mounted IR camera and two TCs, namely TC-1 and TC-2. Plamp was changed between 60% and 90% and four different
mea-surements were obtained at four steady state temperatures. InFig. 8(a) and (b), the test setup for IR heating of PE plate is presented. As it is shownFig. 8(b), the TC-1 and TC-2 were attached in the midpoint and 4 mm away from the lower edge, respectively. A wood-based panel made of medium-density fiberboard (MDF) was used as a barrier and positioned in front the IR lamp. A small frame (70 × 70 mm) was de-signed for positioning the PE plate. The reason for using a barrier was to perform an IR thermographic measurement on the back surface of the PE plate, without any disturbance of a direct emission from IR lamp to the IR camera. In addition, the front surface of the barrier was covered with metallic adhesive tape in order to limit heating on the barrier, as potential heat transfer from the barrier to the PE plate would cause an erroneous temperature measurement. Furthermore, a transparent ad-hesive tape was used to fix the position of the attached TCs, as also presented inFig. 8(b).
The comparison between the IR thermography and the TC mea-surements are displayed inFig. 9 (a) and (b). InFig. 9(a), the tem-perature values recorded by the IR camera and the two TCs at steady state condition are presented. The term -position- in Fig. 9 (a) re-presents the distance between the endpoints of the axis defined in the vertical direction, as shownFig. 8(b). The temperature values recorded by the IR camera were read alongside this axis which was positioned halfway between the right and left edges of the plate, like the TC-1 and TC-2. As it is seen inFig. 9(b) the general trend in theΔT between the TC recordings and the IR thermography was around 1–2 °C, except the two measurements which show difference around 3 °C. Apart from the relatively high Dp of PE, the potential uncertainties on the contact
quality between the TCs and the plate during the IR heating may in-crease the margin of error of measurement, and thusΔT. Nevertheless, it is assumed that the optical filter mounted IR camera provided surface temperature on PE with a small error, which is mostly less than 2 °C. Considering that the average measured temperature is around 70 °C, it may be stated that the error in the temperature read by IR camera is less than 3%.
The other limitation of the developed experimental methodology at this moment was that the surface temperature measurements could only be done at steady-state conditions. It was observed in all the preliminary IR thermography tests that the externally mounted optical filter causes a potential drift in the UI values registered by the IR de-tector where the UI values increased over time. Unlike the factory built-in filters that are mounted built-inside IR cameras, the externally mounted filter is not cooled which eventually may cause a potential self-heating on the filter over time and thus, may cause an additional radiation detected by the IR detector [40]. The two points related to the error in the surface temperature of PE and, the IR thermographic measurements obtained only at steady state temperatures are thus needed to be ana-lyzed further. Nevertheless, the developed experimental methodology
enables to obtain a surface temperature on semi-transparent PE medium that is close enough to the real surface temperature, which may not be obtained using a typical IR camera due to the relatively narrow low-transmittance bands of PE.
4.2. Experimental – numerical comparisons for IR heating of PE plate The comparisons between the predicted and experimentally mea-sured temperatures were done adopting the identical conditions for the case of IR heating of a PE plate. IR heating experiments were carried out
Fig. 7. Preliminary IR thermography tests using PET plate for the sensitivity analyses of the optical filter mounted IR camera (a) and, the measuredΔT between the two IR cameras (b).
Fig. 8. Test setup for IR heating of PE plate (a) and the positions of the mounted TCs on the back surface (b).
Fig. 9. The comparisons between the temperature fields obtained via IR thermography and the two attached TCs on the vertical direction to the PE plate (a) and, the obtainedΔT at each measurement step (b).
using an identical 2.2 mm thick PE plate tested in the preliminary IR thermography experiments. Similar to the preliminary experiments, the PE plate was heated with the halogen 1 kW IR lamp. Whereas, Plampwas
set to 100% of its nominal power, at which the temperature of the IR lamp filament was 2400 K. In order to cross verify the temperature fields obtained from IR thermography, three TCs were attached on the back surface of the PE plate, namely TC-1, TC-2 and TC-3. The TC-1 and TC-2 were positioned 9 mm and 4 mm away from the left and the lower edges of the plate, respectively. TC-3 was attached in the midpoint of the back surface. The IR heating and the TC recordings were started simultaneously so that the real-time temperature evolution of the plate was recorded in three different points for comparing it with the pre-dicted heating behavior obtained from the numerical studies. In addi-tion, it was observed that the back surface temperature reached steady-state after 600 s of heating and the IR thermographic measurements were thus obtained when the temperature of the plate was at steady-state.
The front surface of the PE plate was positioned 8 cm away from the IR lamp. This distance was chosen based on theβλ(T) behavior of PE
and the temperature profile observations obtained from the preliminary IR heating experiments of the PE plate. More specifically, it was aimed to reach a steady-state temperature on the PE plate which is below, but close to its melting range Since theβλ(T) of PE changes significantly at
temperatures close to its melting range (Fig. 4(a)), a condition at which the polymer is heated up to this range may help to highlight how the temperature dependency in βλ affects temperature field predictions.
Hence numerical-experimental comparisons presented here does not only aim to assess the prediction accuracy of the model includingβλ(T)
as numerical input, but also reveals the lack of prediction if a constant βλis taken into account in the model, especially for the cases where the
polymer is heated up to temperatures close to its melting range. To analyze both the points, a parametric case study was done where two different simulation cases were built (Table 3). In the simulation case-1 (C-1) the absorption characteristics of the PE medium was modeled as independent of temperature adopting only∇.qr(25 °C). In the
simula-tion case-2 (C-2), the computasimula-tion was done considering the tempera-ture dependent absorption characteristics (∇.qr(T)) computed using the
βλ (T) values (Table 3). For both the cases, all the other boundary
conditions were built in exact manner adopting the identical conditions as applied in the IR heating experiments. In the model, the plate geo-metry was meshed with 2800 linear hexagonal elements, and the temperature of each mesh element was computed as the average tem-perature of its nodes’ temtem-peratures. Based on the experimental time required for reaching the steady-state, heating of the plate was simu-lated up to 600 s. The emitted radiation from the IR lamp was modeled using 1.5 million rays. This number of ray was chosen regarding the convergence analyses reported by Cosson et al. [35], which run ray tracing computations using RAYHEAT. In terms of computational cost, the ray tracing and∇.qrcomputations took 10 min for C-1 and 65 min
for C-2 using an Intel Core i5 processor (with 2.40 GHz, 8.0 Gb of RAM). As aforementioned, the transient heat transfer problem combined with conduction and convection, beside of radiation phenomenon, was solved using COMSOL Multiphysics where the iterative closed-loop computations were performed establishing a connection between RAYHEAT and COMSOL Multiphysics® via MATLAB LiveLink.
Conduction between the barrier and the PE plate was taken into ac-count including thermal contact resistance (TCR) at the barrier/plate interface. The TCR value at the barrier/plate interface was chosen as
600 W/m2K from Ref. [41]. In addition, the thermophysical properties
of the barrier were adopted from literature. The thermophysical prop-erties of different types of MDF were experimentally analyzed in Refs. [42,43]. Since the MDF type of the barrier used in this study it is not known, the thermophysical properties of MDF found in Refs. [42,43] were averaged and adopted for the barrier. In the model, the Cp, k andρ
of the barrier were defined as 1000 J/kg/K, 0.10 W/m/K and 690 kg/ m3, respectively. It was also assumed that all these adopted parameters
are independent of temperature. In addition, potential heat losses due to convection and self-emission of the PE plate were taken into account in the model. The natural convection cooling on the PE plate was modeled using the relation proposed by Churchill and Chu [44] for vertical wall surfaces. In case of IR heating up to 600 s, the momentum of buoyancy-driven air flow over the vertical surfaces of the plate was also considered. At very first step, the regime of the buoyancy-driven heated air flow was estimated calculating the Grashof Number [45]. It was found that the laminar flow can be assumed, regarding the geo-metrical dimensions of the PE plate and, the maximum and minimum temperatures of the plate surface. Considering the identical case used in the IR heating experiments and assuming a laminar flow for air, the heat transfer coefficient (h (W/m2K)) was computed in COMSOL
con-sidering the front and back surfaces of the plate and, used as input in the iterative closed-loop computations. Due to varying convective ve-locity field of air alongside of the front and back surfaces of the plate, the computed h values on both the surfaces were found between 5 and 9 W/m2K.
The self-emission was also modeled on both front and back vertical surfaces of the PE plate. Using the Tλ i,∩(97 °C) and Rλi,∩ (97 °C)
measurements of the thinnest PE film used in this study (250μm thick samples), the emissivity of PE was calculated around 0.77. The mea-surements at this temperature step were chosen considering that the polymer was heated up to 130 °C for forming processes. It should be pointed out here that, in the finite element modeling (FEM) software, emissivity is modeled on the surface considering a case of opaque materials which is parametrized as surface emissivity (εsurface).
Therefore, it is assumed that all incident radiation is either absorbed or reflected on the surface of opaque medium, whereas no transmission of radiation through its medium is considered. However, this is not the case for PE polymer as it is semi-transparent [37,38,46], which is also shown in this study considering its spectroscopic measurements. Simply, the emissivity of semi-transparent materials is a global physical quantity which theoretically represent emission from medium but not from surface [20,47], due to volumetric absorption. In other words, the emitted energy, and thus the value of emissivity, of an opaque material does not change by a change in their thickness, conversely it is strongly affected by a change in the thickness of semi-transparent materials [48] which makes εsurfacefundamentally unsound. Nevertheless, it may be
assumed that the emissivity measurements in very thin PE samples may represent εsurface. For instance, the optical properties of 100μm thick
HDPE and LDPE films was experimentally characterized by Okada et al. [37] and the emissivity values for both type of PE polymer was found around 0.28. The transmittance spectra and absorption bands of both the studied PE polymers in Ref. [37] show close agreement with the spectroscopic analyses of PE samples studied here. Similarly, the re-flectance and transmittance characteristics of 100μm thick HDPE film was reported by Mastai et al. [46] which also show close agreements with [37]. In addition, following Equations(1) and (2), and knowing that Aλ= f (ρλ, τλ) and τλ= f (βλ, x), the determined values ofρλand
Table 3
Case studies adopted for numerical simulations.
Radiation absorption in polymer medium Simulation Case - 1 (C-1) Constant radiation absorption with∇.qr (25 °C)
βλfrom our spectroscopic measurements were used for calculating Aλ
of a 100μm thick PE medium. The comparison between the calculated Aλand the absorbance spectrum of HDPE and LDPE in Ref. [37] also
showed close agreement. Therefore, the emissivity value of 100μm thick PE proposed in Ref. [37] was assumed as εsurfacein the model,
instead of adopting emissivity value of the 250μm thick PE sample that was used in this study.
For the numerical - experimental comparisons; two profiles were defined in vertical and horizontal directions on the PE plate. The hor-izontal profile was defined alongside the IR lamp axis whereas the vertical profile was perpendicular to the IR lamps axis. In Fig. 10, identically-created profiles on both IR thermography of the plate (a) and, the numerical simulation (b) are presented. The scale bar on the IR thermography of the plate (Fig. 10(a)) represents the radiometric va-lues (UI).
InFig. 11, the comparisons between the temperature profiles ob-tained from the experimental and the numerical studies are presented on the vertical (a) and horizontal (b) profiles. As it is seen, C-2 predicts the back surface temperature of the PE plate closely, whereas C-1 overestimates the experimental results by around 10 °C. In terms of accuracy of the model built as C-2, two different points may be raised further. First of all, ΔT between the predicted and experimentally measured temperature is less than 3 °C throughout the vertical profile. Whereas, in terms of comparisons on the horizontal profile, this small difference is only seen on the middle zone of the plate (the position between 10 and 60 mm, which is defined in x axis). In addition to this, ΔT on the horizontal profile becomes somewhat significant considering the zones close to the edge of the plate which may be attributed to the underestimation of the potential conduction heat losses between the
barrier and PE plate. As aforementioned, the thermophysical properties of the wood-based barrier were adopted from literature, but not ex-perimentally characterized. Secondly, such difference does not exist on the vertical profile where also a non-balanced temperature distribution alongside the vertical direction of the plate is seen, as illustrated in Fig. 11(a). The non-balanced profile is induced by the heated air that moves upward along the heated vertical surface. The close prediction then shows that the computed h which considers the buoyancy-driven air flow in the vertical direction, was well defined. This may also be the dominating mode of heat transfer on the vertical direction, rather than conduction between the barrier and the plate, and thus results in better convergence between the predicted and experimental results on the vertical profile. Considering that the thermoforming window of semi-crystalline PE is around 4–5 °C, theΔT between the experimental results and both the predicted values of C-1 and C-2 clearly indicates that characterization of the temperature-dependent thermo-optical proper-ties of semi-crystalline polymers may be one of the key factors for the accuracy in temperature field predictions.
The real-time temperature evolution on the PE plate was also ana-lyzed comparing the TC recordings to the numerical results obtained from C-2. The numerical results were taken at the same location of the TC-3, which was attached at the midpoint of the back surface. In both the TC-1 and TC-2 measurements, the fluctuations were seen which was probably due to contact quality between the TC and the PE plate, in contrast to the TC-3 measurements. In this drawback, the contact quality is deteriorated not only due to securing a fixed position for the TC but also the softening behavior of the PE polymer, especially seen when it is close the melting range. Therefore, it may be stated that the non-invasive IR thermography may provide more reliable temperature
Fig. 10. Temperature field comparisons on the identically-created vertical and horizontal profiles on both the IR thermography (a) and numerical simulation (b) of the PE plate.