THE PHOTOABSORPTION AND PHOTOIONIZATION OF BROMINE REVISITED.
R. Locht1, B. Leyh1, H.W. Jochims2, H. Baumgärtel2.
1 Molecular Dynamics Laboratory, Department of Chemistry, Institute of Chemistry,
University of Liège, Sart-Tilman par B-4000 Liège 1, Belgium.
2Institut für Physikalische und Theoretische Chemie, Freie Universität Berlin,
Takustrasse 3, D-14195 Berlin, Germany.
During the last few years we proceeded with the investigation of the ionization and dissociation dynamics of bromine derivatives of ethylene [1]. Photoabsorption spectroscopy (PAS), photoionization mass spectrometry (PIMS) and photoelectron spectroscopy (PES and TPES) were applied. The disubstituted derivatives 1,1-C2H2Br2 and cis- and trans-1,2-C2H2Br2 are suspected to be more
sensitive to photodissociation than their corresponding difluorinated and dichlo-rinated compounds. Atomic Br or molecular Br2 could thus contaminate the spectra.
This has been observed, e.g., in the PAS of CH3Br [2].
To be able to ensure the purity of the spectra of the above mentioned brominated derivatives, the molecular Br2 has been reinvestigated by PAS and PIMS
in the 5-15 eV photon energy range.
The PAS of Br2 has been reported by Venkateswarlu [3] between 8.183eV and
10.538 eV using a 10m concave grating spectrograph. PIMS has been applied to Br2
by Dibeler et al. [4,5] between 10 eV and 13 eV photon energy. These authors studied the Br+ fragment ion formation between 10 eV and 12.5 eV. Only the ion-pair
formation Br+/Br- takes place in this range. More recently, Yencha et al. [6] published
a synchrotron radiation work on Br2. The ion-pair process is reported between 10.332
eV and 10.875 eV and discussed in detail. These authors also measured the TPES of Br2 at high resolution [7].
Fig. 1: Photoabsorption Spectrum of Br2 in the 5.0 eV
to 15.0 eV photon energy range.
We investigated the PAS and the PIMS of Br2 by using the
BESSY synchrotron ra-diation dispersed by a 3m-NIM monochro-mator. For recording the PAS, slits were set at 40µm whereas for the PIMS work, 200 µm slits were used. Fig.1 shows the PAS spec-trum as observed
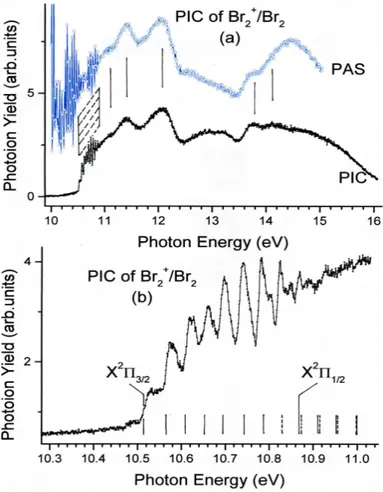
Fig. 2: Photoionization efficiency curve of Br2+/Br2.
has already been analyzed in great detail by Venkateswarlu [3].
At high energy (10.5-15.0 eV) several weak sharp as well as weak broad features are observed. Fig. 2(a) clearly shows the close correlation between the structures observed in the PAS and the photoionization (PIC) as indicated by vertical bars. The dashed region corresponds to the dense fine structure measured in the threshold region.
Fig. 2(b) shows the ionization threshold region of Br2 on an expanded energy
scale. Vertical bars are positioned at critical energies corresponding to the two adiabatic ionization energies X2Π3/2-2Π1/2 and to the vibrational progression observed in Br2+ determined by TPES [7]. Direct ionization as well as vibrational
autoionization is involved. The lowest adiabatic ionization energy has been measured at 10.517 eV in excellent agreement with ZEKE-PFI-measurements [8].
The efficiency of Br+ production from Br2 has been measured between 10eV
and 15 eV photon energy. At high photon energy, i.e., above 14.0 eV the Br+ ion
current steeply increases reaching a maximum near 14.8 eV. Critical energies are measured at 13.98 eV, 14.1 eV, 14.26 eV, 15.51 eV and 15.62 eV and should correspond to the dissociative ionization Br2 into Br+Br+.
in the 5-15 eV photon energy range.
At low photon energy two broad bands are spread from 5.8 eV to 6.4 eV and 7.0 eV to 8.0 eV. The former is weak and structureless whe-reas the latter shows one or more vibrational progress-sions. This region has been mea-sured carefully with 0.5 meV energy increments. A-bout 50 vibrational levels are observed. Their analysis is in progress.
The medium (8.0-10.8 eV) photon energy range is characterized by numerous very sharp and strong to weak peaks. These are analyzed in terms of Rydberg series. The 8.2-10.5 eV region
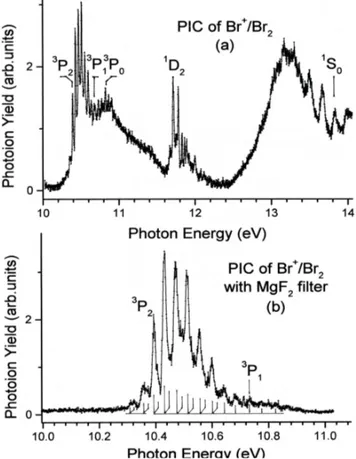
Below 14 eV the ionization efficiency shows fairly strong resonance shaped features corresponding to the production of an ion-pair Br+/Br- through the reaction
Br2 + hν → Br+ + Br- (1S0) (1)
where Br+ is produced in its ground configuration 4p4 giving rise to 3P2, 3P1, 3P0, 1D2
Acknowledgments.
The authors are indebted to the FNRS and the EU (Contract n°RII3-2004-506008) for financial support.
References.
[1]. R. Locht, B. Leyh, H.W. Jochims, H. Baumgärtel, BESSY Annual Report (2005) 56. [2]. R. Locht, B. Leyh, H.W. Jochims, H. Baumgärtel, Chem. Phys. 317 (2005) 73. [3]. P. Venkateswarlu, Can.J.Phys. 47 (1969) 2525.
[4]. J.D. Morrison, H. Hurzeler, M.G. Inghram, J.Chem.Phys. 33 (1960) 821.
[5]. V.H. Dibeler, J. Walker, K.E. McCulloh, H.M. Rosenstock, J.Chem.Phys. 53 (1970) 4715; ibid. Intern.J.Mass Spectrom.Ion.Phys. 7 (1971) 209.
[6]. A.J. Yencha, D.K. Kela, R.J. Donovan, A. Hopkirk, A. Kvaran, Chem.Phys.Letters 165 (1990) 283.
[7]. A.J. Yencha, A. Hopkirk, A. Hiraya, R.J. Donovan, J.G. Goode, R.R.J. Maier, G.C. King, A. Kvaran, J. Phys.Chem. 99 (1995) 7231.
[8]. T. Ridley, D.A. Beattie, M.C.R. Cockett, K.P. Lawley, R.J. Donovan, PCCP 4 (2002) 1398.
and 1S0 electronic states. The
corresponding thermochemical onsets of reactions (1) are dis-played in Fig. 3(a). Furthermore, a fairly extended fine structure is observed upwards from the suc-cessive thresholds. The first band is shown on an expanded energy scale in Fig. 3(b) as recor-ded with a MgF2 filter having a
cutoff at 10.8 eV. A vibrational progression is observed with a characteristic wavenumber of 322±24 cm-1 in very good
ag-reement with earlier observa-tions [6]. The resolution obtained in the present work allows us to highlight several “doublets” in this band corresponding to a second progression with the same wavenumber of 322 cm-1
but blue-shifted by 12 meV (96 cm-1). Further analysis and
as-signment are in progress. Fig. 3: The PIC of Br+/Br2 between 10-14 eV.