East African Journal of Science and Technology, Vol.5 issue 2, 2015 E. Musabanganjiet al. (P.179-200)
PRICE TRANSMISSION MECHANISM ANALYSIS:
AN APPLICATION TO SELECTED FOODSTUFFS ON THE MAIN
MARKETS OF THE SOUTHERN RWANDA
Edouard Musabanganji1*, Antoine Karangwa2 and Philippe Lebailly1
1 Economy and Rural Development Unit, Gembloux Agro-Bio Tech, University of Liège, Belgium
2
College of Agriculture, Animal Sciences and Veterinary Medicine, University of Rwanda, Rwanda
*
Corresponding author (E-mail: musabanganji@gmail.com)
Abstract
This study analysed the transmission of the prices of the major foodstuffs on local markets of the Southern Rwanda. It used time series data collected on Huye, Nyanza and Muhanga markets from January 1997 to June 2014. The cointegration analysis has been applied to analyse the data and the Error Correction Mechanism was used to integrate, around the long-run, the short-run fluctuations. The obtained results have confirmed the relationship between the variation of the price of bean, the seasonal calendar and the prices of maize flour and potato on the markets covered by this study. It is revealed that during the first quarter, the price of beans decreased on the three markets while the third quarter influenced the increase of the price of beans only on the market of Muhanga. A positive influence of white maize flour price on that of beans was noticed on Huye and Muhanga markets in the same period. The previous and the current monthly price of potato is likely to influence the increase of the current monthly price of beans respectively on Huye and Nyanza markets. In light of the findings, the following main recommendations emerge. Policy makers and local authorities should consider the price transmission mechanism and the relationship between foodstuffs' prices in the control of prices of major staple food; a study analysing the mutual influence between these main markets by assessing their level of integration for these important staple foods is suggested.
Key Words: Cointegration, Error Correction Model, Stationarity, Price transmission, Staple food prices
East African Journal of Science and Technology, Vol.5 issue 2, 2015 E. Musabanganjiet al. (P.179-200)
1. Introduction
In Africa, like in other parts of the world, beans, maize and irish potatoes in their various forms are among the foodstuffs mostly consumed by the majority of the population. This is also the case in Rwanda where beans occupy an important place in agriculture. As specified in the strategic plan for agricultural transformation, beans are one of the popular crops in Rwandan agriculture. Beans, locally named "the meet for the poor" and "the vegetarians’ meat for the rich" (Ugen et al., 2012), are cultivated in all the regions of Rwanda with 21,69% of the total cultivated area, and occupy the first place in the food crops before banana and maize (NISR, 2013).
Karanja et al. (2011) stated that the common bean is one of the most important crop in Rwanda and Larochelle and Alwang (2014) have shown that nearly all rural households in Rwanda cultivate beans and they are grown twice a year in many farming systems. They are intercropped with banana, cassava, maize, peas, and others, and grown in different agro-ecological conditions.
In their study, Kalyebara and Buruchara (2008) argue that Rwanda has one of the highest per capita bean consumption (0.919kg/capita) in the world. The same study
showed that households on average consume 197 kg of beans annually and considering an average household of 6 persons (two adults and four children), the average per capita consumption is 38 kg of beans per person per year from beans produced by the household (Kalyebara and Buruchara, 2008). This confirms that bean is a key crop for food security (Larochelle and Alwang, 2014). For example in terms of the total cultivated area, for the season A of 2013, according to the 2013 Seasonal Agricultural Survey (NISR, 2013), beans was the first main crop grown with 27.1% and the second crop in season B with 17.4%. The study by Asare-Marfo et al. (2011) contended that, in Rwanda, in season A, the main sources of beans were own production with 88% and market purchase with 19%, and similarly, in season B the main sources of beans consumed were own production with 79% and market purchase with 29% (Asare-Marfo et al., 2011). This foodstuff constitutes the main source of proteins, and Valdemiro and Whitaker (1982) argue that where daily bean consumption is high, it provides significant amount of proteins, calories and micronutrients to avoid the consequences of malnutrition and hunger. Irish potatoes (hereafter referred to as "potatoes" for simplicity) and maize flour
East African Journal of Science and Technology, Vol.5 issue 2, 2015 E. Musabanganjiet al. (P.179-200)
taken in the form of porridges (mostly in the morning for breakfast) and pasta (in most cases) also have an important place in the dietary habits of Rwandans. The role of potato as a staple food in Rwanda has to be mentioned. To USAID (2002), it has increased since the mid1960s. Annual per capita consumption rose from 8 kg in 1965 to 40 kg in 1985/86, and to 76 kg in 2000. In rural areas, the average per capita consumption amounts to 68 kg per annum, but ranges between 20 kg and 216 kg. Consumption variation reflects the distribution of production. Urban demand is 141 kg per year, which is unusually high compared to other urban centres in Sub-Sahara Africa (USAID, 2002). According to RIU (2014), quoting FAOSTAT, potatoes are a very important crop in Rwanda: it is estimated that, in 2007, close to one million tonnes of potatoes were produced in the country and average per capita consumption was 125 kg.
As for maize, RDB (2013) notes that along 5 years, the area under cultivation increased 2.2 – fold: 102,000 ha in 2007 to 223,414 ha in 2011 with an annual growth of 11.6%. In addition, maize production has reportedly increased from approximately 100,000 tonnes in 2007 to over 430,000 tonnes in 2010, an increase of more than 400% (MINAGRI, 2011). Though per capita consumption of
maize flour is not currently known, various reports show an increasing trend (MINAGRI, 2011) due the high demand in urban and rural households, and in communities such as schools, prisons (ROPARWA, 2007), refugee camps and settlements for prisoners community service. In 2010/2011, the estimated total quantity of maize needed in Rwanda, for various utilization, was 220,426.7 tonnes of which 128,900 tonnes were estimated for rural and urban consumption (USAID, 2013).
With the change of the food habits currently observed in rural areas as well as in urban zones of Rwanda, and due to resource constraints, beans are consumed together with cassava flour, white maize flour, and sometimes with other locally produced foodstuffs such as potatoes. Though potato is less affordable for both rural and urban population, the trend is that now most of the population have integrated this food product in their daily ration as it is mainly produced in Rwanda. Thus, it is conceivable that, currently, the prices of the food products on local markets, in particular beans, white maize flour and potato have a special behaviour to be studied with interest. Therefore, one can think that this is resulting from a certain relationship between the prices of the various food products of major importance. According to
East African Journal of Science and Technology, Vol.5 issue 2, 2015 E. Musabanganjiet al. (P.179-200)
that assumption, as soon as merchants, shopkeepers or stallholders, wholesalers, or retailers of the foodstuffs notice that the price of a given foodstuff often associated with beans in the food habit increases, they also increase the price of that precious foodstuff. They are led to do so because they know that although beans are the most important staple food for both rural and urban Rwandese they cannot be consumed alone as a meal. Thus, it is important to study the presence or lack of interdependence between the prices of the main food products.
The null hypothesis to be verified by this study is, therefore, formulated as follows: the price of beans does not increase or decrease on the market only because the production has been relatively low but also because there could have been an increase in the prices of other foodstuffs associated with beans.
Studies have been conducted using a cointegration analysis to study the link between prices of food commodities by focusing on only one commodity or the food prices at the production level (Ngirente, 2008 and Simioni, 2003). Musabanganji (2013) conducted a study which looked into the price relationship between beans, maize flour and cassava flour, on Huye market in the Southern Rwanda but didn't cover other main markets to learn about the prevailing situation. The
research didn't also consider in its analysis the potato considered nowadays as a very important commodity by rural and urban residents.
This article is focusing on the price relationship between beans, maize flour and potato at the retailer level. This paper is in line with the recommendations suggesting to conduct a study analysing the mutual influence between the main food prices changes on Huye market and the neighbouring main markets (Musabanganji, 2013) and takes into account the current trend of potato consumption and extends the analysis to each of the three main markets selected in the Southern province of Rwanda: Huye, Nyanza and Muhanga markets with up-to-date data. The paper is dedicated to the multivariate analysis of the behaviour of three variables presented as time series. These series represent prices of the following three food products: beans, white maize flour, and potato. The current analysis led to a formulation of an econometric model which explains the variation of the prices of beans by the variation of other foodstuff prices on the three markets. Other factors such as climatic conditions, government economic policies, social factors, etc. that could influence variation of food prices are here unheeded and
East African Journal of Science and Technology, Vol.5 issue 2, 2015 E. Musabanganjiet al. (P.179-200)
only a seasonal calendar was considered during this study.
The multivariate analysis has a major importance for suitable multivariate models formulation and the forecast. The cointegration analysis (taking into account the presence of other series) constitutes a powerful tool that allows giving clear answers on the existence of long-run linear relationship between different series. It helps also to integrate, around the long-run, the short-run fluctuations. The importance of this study relies in assessing the relationship between prices of selected food stuffs based on Rwandan consumers’ preference. It is establishing a policy framework that articulates the strategies for controlling prices on local markets. Such a policy framework will also be used to encompass the work and operations of all stakeholders and to incite agriculture sector policy-makers to set up appropriate policies while referring to certain recommendations which will come out of this research. Considering the above issues, the study formulated a multivariate model which specifies, on one hand, the interdependence relationship between the various prices and on the other hand, the impact of the seasonal calendar on the variation of the price of bean.
2. Formulation of the Theoretical Models In the search for factors influencing the variability of the beans prices on each of the three selected markets of the Southern province of Rwanda: Huye market, Nyanza market and Muhanga market, we adopted the following model with three series:
) , ( t t t f FMaize Potato Bean (1) whereBean is the variation of beans prices; t
t
FMaize represents prices of white maize flour; and Potatot represents prices of potato.
Therefore, an econometric model for each market with two explanatory variables is formulated as follows: t t t t FMaize Potato Bean 0 1 2 (2)
The coefficients i(i 0,1,2)of the model (2) are parameters associated to the commodity prices and are to be estimated.
The transformation of variables in their logarithms leads to scale reducing and allows to interpret the results in terms of elasticity. The equation (2) in log-linear format for different variables becomes:
t t t t LogFMaize LogPotato LogBean 01 2 (3)
The above mentioned analysis is articulated around the analysis of the possible existence of one or several cointegrating relations (long-run relationship) and the existence of possible short-run relation between the variables to be
East African Journal of Science and Technology, Vol.5 issue 2, 2015 E. Musabanganjiet al. (P.179-200)
studied through the mechanism of the Vector Error Correction Model.
3. Materials and Methods
This study used a cointegration analysis
methodological approach as detailed in Bourbonnais (2007). This methodology is
applied in three steps: analysis of the stationarity of the series under study to check for the presence of units roots in the series or their integration order; the cointegration test which has to reveal the number of cointegrating vectors for a long-run relationship; and lastly the estimation of the short-run relationship between the series which will allow to integrate the effect of the seasonal calendar or/and other factors playing on the price transmission mecanisms.
To achieve our objective, the stationnarity check used the Unit Root Test named Augmented Dickey-Fuller Test while the Johansen Cointegration Test was used to confirm the existence or not of the long-run relationships (Bourbonnais, 2007).
The following dynamic model relationship (short-term or error correction model):
t t kt k t t t X X X e u Y 1 1 2 2 ... 1 1 (4)
has been estimated following that of the long-run relationship: t kt k t t t a a X a X a X e Y ˆ0 ˆ1 1 ˆ2 2 ... ˆ (5)
using the Ordinary Least Squares (OLS) method and the calculation of the residuals:
kt k t t t t Y a a X a X a X e ˆ0 ˆ1 1 ˆ2 2 ... ˆ (6) The validity of the long-run relationship is subject to the stationarity of the residuals e t
and the coefficient 1of the dynamic model which constitutes strength of convergence towards the balance must be significantly negative. When this is not the case, it is advisable to reject the error correction model specification (Bourbonnais, 2007).
In this paper, average monthly data collected by the Agriculture Management Information System (AMIS) of the Ministry of Agriculture and Animal Resources (MINAGRI) were used. Data were gathered on almost regular daily basis on Huye market, Nyanza market and Muhanga market during a period of 210 months (from January 1997 to June 2014). Data are displayed as monthly time series converted based on those collected on the market day. The daily values collected for various products were the weighted average of the prices of a given product on a given day. The data were analyzed using gretl 1.9.92 an open-source econometrics software including a shared library, a command-line client program and a graphical user interface.
4. Results and Discussion
East African Journal of Science and Technology, Vol.5 issue 2, 2015 E. Musabanganjiet al. (P.179-200)
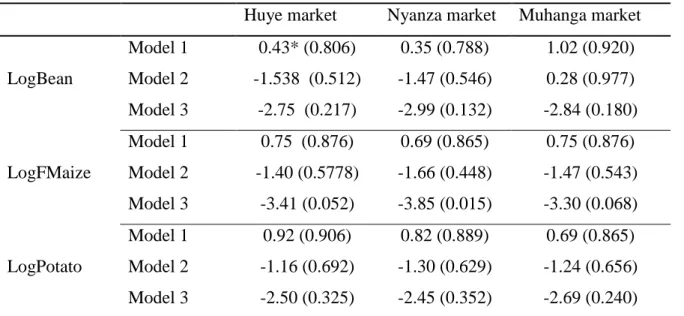
The lag selected for all the series in logarithm by the criteria BIC of Schwarz and HQC of Hannan-Quinn is equal to 1 for Huye, Nyanza and Muhanga markets. The statistics calculated for these series are compared with the critical values under the null hypothesis of the existence of a unit root or non-stationarity and refer to the p-values given by the test at a significance level of 5%. The results shown in the table 1 lead us to conclude that, for the beans' prices in logarithm, on the three markets, the H0 of the presence of a unit root at a significance level of 5% by considering various models (Model 1= without constant, Model 2 = with constant and Model 3 = with constant and trend) is not rejected. Therefore, the series are not stationary. The same applies
to the series of maize flour prices and potato prices in logarithm as the null hypothesis is not rejected for Huye, Nyanza and Muhanga markets. In addition, the coefficient associated to model 3 is not significantly different from 0 at 5%. Based on the above, it is concluded that, for different markets, each of the chronicles is a Differency Stationary process. Therefore, it is important to apply to these series the operator of difference of order 1, in order to make them stationary. We note that the stationarisation allows identifying the stochastic characteristics of the series. Otherwise, this trend should have as impact a strong correlation between the observations
t
X without expressing a real explanatory
character.
Table 1: Analysis of stationarity of the series
Huye market Nyanza market Muhanga market
LogBean Model 1 Model 2 Model 3 0.43* (0.806) -1.538 (0.512) -2.75 (0.217) 0.35 (0.788) -1.47 (0.546) -2.99 (0.132) 1.02 (0.920) 0.28 (0.977) -2.84 (0.180) LogFMaize Model 1 Model 2 Model 3 0.75 (0.876) -1.40 (0.5778) -3.41 (0.052) 0.69 (0.865) -1.66 (0.448) -3.85 (0.015) 0.75 (0.876) -1.47 (0.543) -3.30 (0.068) LogPotato Model 1 Model 2 Model 3 0.92 (0.906) -1.16 (0.692) -2.50 (0.325) 0.82 (0.889) -1.30 (0.629) -2.45 (0.352) 0.69 (0.865) -1.24 (0.656) -2.69 (0.240) * indicates the value of the test statistic and (.) is the associated p-value.
East African Journal of Science and Technology, Vol.5 issue 2, 2015 E. Musabanganji(P.179-178)
4.2 Results of the Johansen cointegration test
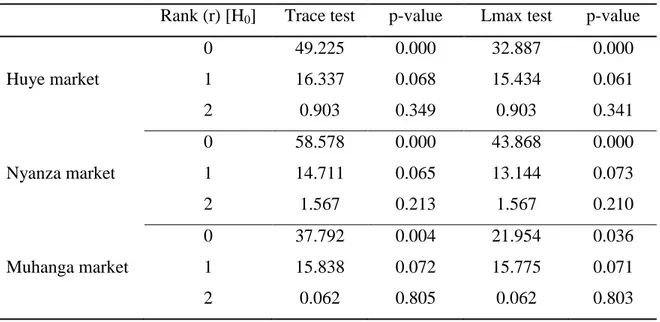
The Johansen (1998) cointegration test was used to assess the existence of one or several cointegrating relations between the series. This test was reported to be a powerful one as it allows detecting the number of cointegration relations what can not be done by Engle-Granger method (Bourbonais, 2007). The results related to the Johansen cointegration test are presented in the table 2. The results of the Johansen test (Table 2) shows that at 5% of the significance level, we reject the first null hypothesis (r=0 with p-value<0.05) and we do not reject it in the case of r=1 as the corresponding p-values, for all markets are greater than the level of significance of 5%. The above observation is also confirmed by
the Lmax Test because the H0 for r=1 in all cases is not rejected. Therefore, the results revealed a case of only one vector of cointegration for Huye, Nyanza and Muhanga markets and this is leading to conclude in the existence of a long-term relationship between three series under study.
As specified in section 4, it is advisable to check whether a short-run relationship which allows to integrate the effects of the seasonal factors does exist or not. This short-run relationship is estimated, for the three markets, by the Error Correction Model (ECM) instead of the Vector Error Correction Model because of the existence of one and only one cointegrating vector. The ECM estimation results are presented in details in pursuant section.
Table 2: Results of the Cointegration test of Johansen
Rank (r) [H0] Trace test p-value Lmax test p-value
Huye market 0 1 2 49.225 16.337 0.903 0.000 0.068 0.349 32.887 15.434 0.903 0.000 0.061 0.341 Nyanza market 0 1 2 58.578 14.711 1.567 0.000 0.065 0.213 43.868 13.144 1.567 0.000 0.073 0.210 Muhanga market 0 1 2 37.792 15.838 0.062 0.004 0.072 0.805 21.954 15.775 0.062 0.036 0.071 0.803 Source: Study findings
East African Journal of Science and Technology, Vol.5 issue 2, 2015 E. Musabanganji(P.179-178)
4.3 Empirical Estimation of the Error Correction Model
As specified in the methodology (section 4), the ECM empirical estimation is done in two stages. The first step is for the OLS estimation of the long-term relationship (Engle and Granger, 1991) by using the data. The second and last step consists of estimating the ECM using OLS. The detailed results are in the following sections.
4.3.1 Empirical Estimation of the cointegration relation
Based on the results obtained by OLS estimation method (Table 3), the following equations of the cointegrating relations for each market were formulated.
a) Cointegration relation for Huye market:
t t t
t t LogFMaize LogPotato e
LogBean 0.8680.00097 0.306 0.629 (7)
b) Cointegration relation for Nyanza market:
t t t
t t LogFMaize LogPotato e
LogBean 0.6850.00094 0.264 0.712 (8)
c) Cointegration relation for Muhanga market:
t t t
t t LogFMaize LogPotato e
LogBean 0.6040.0007 0.531 0.421 (9)
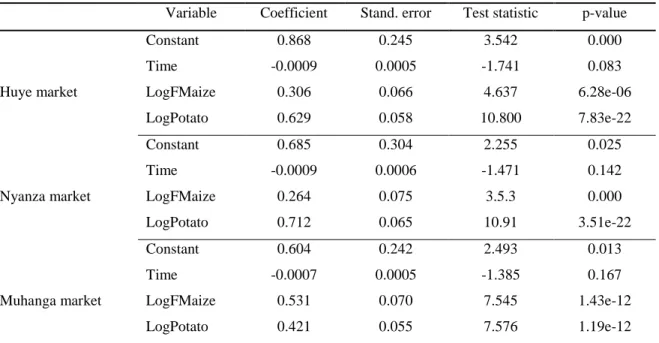
The results of the global test of the regression model (Table 3) show that the long-term relationship is well specified
Table 3: Estimation of the cointegrating relation coefficients
Variable Coefficient Stand. error Test statistic p-value
Huye market Constant Time LogFMaize LogPotato 0.868 -0.0009 0.306 0.629 0.245 0.0005 0.066 0.058 3.542 -1.741 4.637 10.800 0.000 0.083 6.28e-06 7.83e-22 Nyanza market Constant Time LogFMaize LogPotato 0.685 -0.0009 0.264 0.712 0.304 0.0006 0.075 0.065 2.255 -1.471 3.5.3 10.91 0.025 0.142 0.000 3.51e-22 Muhanga market Constant Time LogFMaize LogPotato 0.604 -0.0007 0.531 0.421 0.242 0.0005 0.070 0.055 2.493 -1.385 7.545 7.576 0.013 0.167 1.43e-12 1.19e-12 Source: Study findings
East African Journal of Science and Technology, Vol.5 issue 2, 2015 E. Musabanganji(P.179-178)
. Indeed, with the test statistic of Fisher equal to 344.8 with a p-value of 5.16e-80, a test statistics of Fisher of 234.1 with 4.29e-66 of p-value and a test statistic of Fisher of 347.4 with a corresponding p-value of 2.69e-80 for respectively Huye market, Nyanza market and Muhanga market. The corresponding values of R2 and adjusted R2 show that more than 77% of the variability of beans' prices in logarithm are explained by the models in various cases. The analysis of the stationarity of the residuals of the three models (Table 4) is also required because, to Bourbonnais (2007), once the residuals are stationary, the long-run relation model is valid and its coefficients can be interpreted. Note that the addition of the trend
to the equation is due to the fact that the series under study have a stochastic trend. The Augmented Dickey Fuller test on the three models' residuals show that they do not have a unit root because the null hypothesis is rejected at a significance level of 5% in all cases (the corresponding p-values are equal less than 0.001 in all three cases). We conclude that the risk that the regression is fallacious is dismissed and thus, we can interpret the coefficients of this long-term relationship.
Table 4: ADF test on Residuals of the cointegrating model Huye Market Nyanza
market Muhanga market Residuals (et) Model 1 Model 2 Model 3 -4.190* (0.000) -4.182 (0.000) -4.189 (0.000) -4.617 (0.000) -4.611 (0.000) -4.615 (0.000) -5.726 (0.000) -5.712 (0.000) -5.699 (0.000) * indicates the value of the test statistic and (.) is the associated p-value.
Source: Study findings
By analyzing the values of the coefficients estimated by OLS and the associated p-values, we conclude that the coefficients associated to the Constant, LogFMaize and LogPotato are statistically different from 0 at a level of significance of 5%. The equations (7), (8) and (9) are similar
to the equation (3). They can be expressed in logarithm and the interpretation can be performed in terms of elasticity.
Interpretation of the long-run relationship of the variation of the beans' prices
East African Journal of Science and Technology, Vol.5 issue 2, 2015 E. Musabanganji(P.179-178)
In economics, goods are said to be substitutes if they serve to the same purposes, if they are equivalent in functional terms, if they satisfy the same need(s), if they are considered inputs to different activities, potentially performed by the consumer, that can meet the same goal (Piana, 2005). By the substitution effect, a decreasing of a price causes both a substitution effect and an income effect. The substitution effect is the change in food consumption associated with changes in the price thereof, for a constant level of utility (Pindyck and Rubinfeld, 2009). Généreux (2007) adds that, for the utility of goods, the ordinal theory supposes that the consumer is capable of classifying the various goods according to their utility. This classification reflects the relative satisfaction of the consumer and thus dictates its preference.
In an economy containing several goods, some of them must be consumed together to cover a specific need. If A and B are in that case, they are said complementary: the consumption of A influences the consumption of B and mutually. Any variation of the consumption of A will thus cause an identical variation of the consumption of B in
given proportions (Haschke et Le Bris, 2014). Based on the above mentioned summarized
theory, it is clear that the various products under study in this paper reflect very well a
utility between them and are differently classified by the consumer.
In the case of this paper, the bean and the white maize flour or the bean and the potato are said to be complementary products whereas the white maize flour and the potato are considered as substitutable products because they have identical characteristics in relation to the bean allowing them to satisfy the same need.
It is important to recall in short the basic notions of the concept of elasticity to ease the understanding of the results. This concept has been widely used in economics and it can be defined as a measurement of how responsive an economic variable is to a change in another. It measures the sensitivity
of a variable to another (Pindyck and
Rubinfeld, 2009). When the causality between two variables is verified, elasticity can be quantified as the ratio of the percentage change in the dependent variable to the percentage change in the explanatory variable. In regards to the results (Table 3), it is noticed that, on the three markets under study: Huye market, Nyanza market and Muhanga market, the price of bean adapts itself perfectly to the price of potato and to the price of the white maize flour. Indeed, for Huye market, if the price of potato increases (or decreases) by 1%, the price of beans increases (or decreases)
East African Journal of Science and Technology, Vol.5 issue 2, 2015 E. Musabanganji(P.179-178)
by 0.63% and if the price of white maize flour increases (or decreases) by 1%, the price of beans increases (or decreases) by 0.31 %. For Nyanza market, the results revealed that if the price of potato increases (or decreases) by 1%, the price of beans increases (or decreases) by 0.71% and if the price of white maize flour increases (or decreases) by 1%, the price of beans increases (or decreases) by 0.26%. As for Muhanga market, the almost same trend is observed because if the price of potato increases (or decreases) by 1%, the price of beans increases (or decreases) by 0.42% and if the price of white maize flour increases (or decreases) by 1%, the price of bean increases (or decreases) by 0.53%. These results show that the cross-price elasticity level for the bean price vis-à-vis the price of potato and white maize flour changes from one market to another. This is explained, on one hand, by the variability of the demand in beans on these main markets and their connection to other nearby rural markets supplying beans (locally produced) differently influencing then the quantity available on the market and the price. On the other hand, this is due to the cost of one kilogram of potato or white maize flour which is directly dependent to the cost of transportation. Potato is mainly produced in the northern part of the country (more than 200 km away to Huye market, more than 130
km to Muhanga market and more than 170 km to Nyanza market) and white maize flour is predominately supplied by Maize processing plants of Kigali (about 125 km away to Huye, the farest market among those under study). 4.3.2 Empirical Estimation of the short-term relationship
The short-run relationship estimated by ECM is performed by using OLS method on the equation (10) of the general model for the three markets.
The ECM completed model is including all the variables in first differences (stationary series) with 3 lags which allow capturing a possible effect of what happened on the market during the past months.
Besides the error correction terms et1
obtained from the equations (7), (8) and (9) this model will also include three dummy variables (quarter 1-T1, quarter 2-T2 and quarter 3-T3) allowing to study the effect of the seasonal factors on the variation of the price of bean on the three markets under study. It is noted that the fourth quarter (quarter 4) has been automatically removed due to the presence of a strong multicolinearity. Thus, the general model is formulated as follows:
East African Journal of Science and Technology, Vol.5 issue 2, 2015 E. Musabanganji(P.179-178) t t i t i i i i t i t LogFMaize LogPotato T T T e u LogBean 1 1 2 2 3 3 1 1 0 1 0 (10)
The variables of the equation (10) are stationary. Consequently, the risk of ending in a false regression is eliminated and the coefficients of this equation are estimated by OLS (Thomas, 1997). From the table 5 above, it is clear that the sine qua non condition of the ECM specification is verified for both Huye market, Nyanza market and Muhanga market. Indeed, the coefficient of the termet1 is
significantly negative with a p-value lower
than 0.00001. The ECM representation is, therefore validated. It is also noted that residuals given by this model are stationary for the three markets. Afterwards, we begin to analyze completely the results of the global estimation of the short-term relationship model and to interpret the estimated coefficients of these variables.
Table 5: Estimated Coefficients of the full ECM
Huye market Nyanza market Muhanga market Variable Coefficient p-value Coefficient p-value Coefficient p-value Constant t LogFMaize LogFMaizet1 t LogPotato 1 LogPotatot TRIM 1 TRIM 2 TRIM 3 1 t e 0.036 0.193 0.015 0.241 0.160 -0.101 -0.032 -01012 -0.150 0.021 0.001 0.078 0.000 0.006 0.000 0.144 0.595 0.000 0.051 0.065 0.039 0.424 0.022 -0.139 -0.040 -0.017 -0.215 0.018 0.375 0.588 0.000 0.802 0.000 0.169 0.582 0.000 0.019 0.348 -0.078 0.049 0.064 -0.070 -0.019 0.020 -0.193 0.265 0.000 0.239 0.265 0.146 0.004 0.434 0.424 0.000 Source: Study findings
The results related to the global test of the complete ECM confirm that the model is well specified because the null hypothesis of the simultaneous nullity of the full model coefficients is rejected (p-values lower than 0.00001 corresponding to the test statistics of
Fisher for both Huye, Nyanza and Muhanga markets). It is important to add that the model (10) presented above deserves to be reduced in order to remain with the most explanatory regressors. To this end, the backward elimination method is used. It consists of
East African Journal of Science and Technology, Vol.5 issue 2, 2015 E. Musabanganji(P.179-178)
beginning with the complete model and trying to reduce it by eliminating one after the other, the variables which minimize the statistics of
Fisher. . ) var ( ) var ( * iables other X MSE iables other X MSR F k k k The
deletion of the variable in the model which contains other variables takes place if the p-value corresponding to the statistic *
k F is
bigger than the significant level to stop often fixed to 0.15 (Hafner, 2008). After the estimation of the coefficients of the reduced model, the results are presented in table 6 and the reduced equations for the three markets are given below.
From these results, the equation (7) for Huye market becomes: t t t t t t u e T LogPotato LogPotato LogFMaize LogBean 1 0.086 1 0.137 1 154 . 0 225 . 0 189 . 0 021 . 0 (11); the equation (8) for Nyanza market becomes:
t t t t LogPotato T e u LogBean 0.032 0.399 0.120 1 0.192 1 ; (12) the equation (9) for Muhanga market becomes:
t t t t LogFMaize T T e u LogBean 0.006 0.359 0.086 1 0.039 3 0.202 1 . (13)
All these equations are valid because the coefficient of convergence term et1 is
significantly negative. To this, Bourbonnais (2007) points out that in the opposite case, the ECM specification is rejected as the error correction mechanism which allows to move towards the long-run relationship would then go in the opposite direction and moves away from the long-term target. In addition, the ADF test made on residuals u of these models t
points out that the residuals of the reduced ECM are stationary as the null hypothesis of the presence of the unit root is rejected in all cases. The global test of the reduced model to verify its specification shows that it is well specified with p-values lower than 0.00001
corresponding to the test statistics of Fisher for the three markets. This leads us to reject the null hypothesis of simultaneous nullity of the reduced model coefficients.
In the next step, we are going to test if there is a structural stability of the coefficients over the period of the study and if all the parameters of variables deleted when reducing the model (equation 10) are statistically non significant. The answers to these two questions are obtained through the test of Chow of the structural stability and the analysis of the linear constraints imposed on the reduced ECM coefficients presented in the following sections.
East African Journal of Science and Technology, Vol.5 issue 2, 2015 E. Musabanganji(P.179-178)
Table 6: Estimated Coefficients of the reduced ECM
Huye market Nyanza market Muhanga market Variable Coefficient p-value Coefficient p-value Coefficient p-value Constant t LogFMaize t LogPotato 1 LogPotatot TRIM 1 TRIM 3 1 t e 0.021 0.189 0.225 0.154 -0.086 - -0.137 0.011 0.001 0.000 0.007 0.000 - 8.7e-07 0.032 - 0.399 - -0.120 - -0.192 0.003 - 0.000 - 0.000 - 1.7e-06 0.006 0.359 - - -0.054 0.039 -0.202 0.596 0.000 - - 0.007 0.053 3.8e-07 Source: Study findings
Test of Chow and analysis of the structural stability of the reduced ECM
The test of Chow allows testing the structural stability of the parameters of the reduced model over the period of the study. This led us to conclude that no structural break is observed. Indeed, for Huye market, based on the Fisher statistic of the test of Chow equal to 1.245 with a p-value of 0.284, the null hypothesis of absence of structural break at a level of significance of 5% is not rejected and the conclusion is that the parameters of the model are stable over the period of the study. The same conclusion applies to the other markets as the corresponding Fisher test statistics for both Nyanza and Muhanga
markets are respectively 1.44 with a p-value of 0.222 and 0.951 with a p-value of 0.448.
Analysis of the linear constraints imposed on reduced ECM coefficients
As presented by Bourbonnais (2007), some model specifications impose variables to be affected by identical coefficients. For our case, all the coefficients of the deleted variables should not be statistically different from 0. This analysis has the aim of verifying if the parameters of regression are not statistically significant for deleted variables to get the reduced ECM.
The results reveal that the F statistics equal to 0.827 with a p-value of 0.480 for Huye market, 0.683 with a p-value of 0.636 for Nyanza market and 0.979 with a
East African Journal of Science and Technology, Vol.5 issue 2, 2015 E. Musabanganji(P.179-178)
corresponding p-value of 0.419 for Muhanga markets lead to the acceptance of the null hypothesis of nullity of the parameters of the deleted variables at a level of significance of 5%. It is thus concluded that the obtained reduced model represents the short-term relationship of variations of the price of bean on the three selected markets.
Interpretation of the formulated Error Correction Model
Error Correction Models are a category of multiple time series models that directly estimate the speed at which a dependent variable returns to equilibrium after a change in an independent variable (Best, 2014).
From the coefficients of the model of Huye market, we notice that on average the price of white maize flour of the same month, the price of potato of the same month and that of the previous month are likely influencing positively the variation of the price of beans. Indeed, if the average price of white maize flour of the same month increases (or decreases) in 1%, the price of beans increases (or decreases) in 0.189%, if the average price of potato of the previous month increases (or decreases) of 1%, the average monthly price of beans increases (or decreases) in 0.154% and if the current average monthly price of potato increases (or decreases) of 1%, the average
monthly price of beans increases (or decreases) in 0.225%. In regards, to the Nyanza market, the trend seems to be different because on average, the monthly price of beans at Nyanza market is positively influenced by the current monthly average price of potato. That is, the increase (or decrease) of 1% in the monthly potato price tends to increase (or decrease) in 0.399% the beans' price of the same month. The Huye situation is also different to the one of Muhanga market because on that market, the maize flour is the only foodstuff that influences, in short-run, the variation of monthly price of beans in proportion such that the increase (or decrease) of 1% of the average price of white maize flour for a given month leads to the increase (or decrease) in 0.395% of the beans' price for that month.
As for the seasonal calendar influence on the beans' price on these markets, the results from the estimation of the reduced ECM revealed that the first quarter corresponding to the months of January, February and March have a negative influence on the variation of the price of beans on both Huye, Nyanza and Muhanga markets.
Based on the supply and demand theory and the Adam Smith chart of price gravitation as presented by Mone (2014), the information revealed by the results appears evident on the
East African Journal of Science and Technology, Vol.5 issue 2, 2015 E. Musabanganji(P.179-178)
agricultural plan and in Rwandan context. The first quarter corresponds to the rainy season during which the farmers are devoted to rural activities. January is generally dedicated to harvest for season A food crops (normally the season A food crops harvest starts from December till mid-February) whereas February and March represent the period of plantation of season B food crops (Fews Net, 2013). During this period, the prices of the food products and in particular that of beans fall hence there is a negative sign of the coefficient. In fact, during January, the population finds easily something to eat and to bring to the market. During this period, few are those who are resourced from the market and instead, most of the farmers usually face difficulties of storage and sell some of the harvest because they want to purchase other household items such as salt, sugar, clothes, etc., and the quantity of food products on the market becomes high influencing the fall of the commodity prices. In the course of February and March, the seed is taken out of storage facilities and the farmers do not need to go to the market because the period of plantation follows directly the harvest. Other quarters do not have significant influence on the variation of the beans' price on these markets except on Muhanga market where the beans' price is also positively influenced by the
third quarter. Concerning the third quarter revealed as an influencing factor on Muhanga market, which includes July, August and September, its two first months are the hottest months of the year. Besides the harvest of season B food crops in June, this month and July are devoted to agricultural activities for season C in marshlands and farmers need seed for this season. Although this is a period following directly the season B harvest, the quantity of food required is high during this period. Indeed, in the town of Muhanga, the presence of at least five boarding schools is noted. This leads to an increase in demand for beans. In addition, the market of Muhanga which is nearly 65 km from Kigali city, contributes significantly in beans' supply to the national market of Kigali. This situation seems to be different on the other two markets because there when the quantity of beans tends to decrease, the Nyanza market is supplied by the rural markets of Busoro and Ntyazo and other nearby rural markets whereas the Huye market is supplied by the rural markets of Nyaruteja, Kizi, Karambi and Musha. Furthermore, at the end of this quarter, the population consumes the last stored quantities and replenishes their barns by purchasing small quantity from the market.
Some researchers who studied the reasons of price variability especially in developing
East African Journal of Science and Technology, Vol.5 issue 2, 2015 E. Musabanganji(P.179-178)
countries, argued in line of these results. Brown, Higgins and Hintermann (2009) point out the reasons for price variability. To them, quoting Dembele and Staatz (1999), one of the reasons for this variability is the widespread lack of storage facilities because producers cannot store grains for an entire year, small farmers sell more than their surplus on the market after harvest and buy some grain back later in the year, often at higher prices. To Galtier (2009), three reasons of food prices instability are to be mentioned. The first one is the natural instability explained by the fact that price fluctuations are linked to variations in domestic supply resulting from natural hazards affecting production (rains, locusts etc.). The second cause is perceived as imported instability where the variability of international prices, exchange rates and transport costs give rise to price instability on the domestic market. The third and last cause is the endogenous instability where price variability is caused by the functioning of the market itself. In the same way, Nkurunziza (2007) added that the cost prices during the harvest are too low, all the more low as the harvest is good. The farmers, due to the lack of the other sources of monetary income, sell their harvests at cheap prices.
As for the coefficient of the convergence term of the reduced model ECM, its absolute value
of this coefficient decides on the speed with which the equilibrium is established in case one of the prices deviated for a moment from the equilibrium. Therefore, we conclude that the speed of disequilibrium adjustment coefficient of the price of beans is about 13.7% for Huye market, 19.2% for Nyanza market and 20.2% for Muhanga market a month, what corresponds to a return in the equilibrium after 7.3, 5.2 and 4.9 months respectively for Huye, Nyanza and Muhanga markets.
5. Conclusion and recommendations
The aim of this study was to assess the relationship between prices of selected food stuffs based on Rwandan consumers’ preference. In line with this objective, we formulated a multivariate model which specifies, on one hand, the interdependence relationship between the beans, potato and white maize flour prices and on the other hand, the impact of the seasonal calendar on the variation of the price of beans, basic food of the Rwandan population.
The analysis carried out in this study, through the Error Correction Model estimation allowed us to study clearly the relationship between the various prices of the food products taken into account in this study. It has been statistically verified that during the first quarter corresponding to January, February,
East African Journal of Science and Technology, Vol.5 issue 2, 2015 E. Musabanganji(P.179-178)
and March the price of beans decreased on Huye, Nyanza and Muhanga markets while the third quarter influenced the increase of the price of beans only on the market of Muhanga. Through the same analysis, we notice that, the average price of white maize flour of a given month tends to increase the price of beans on Huye and Muhanga markets in that month. The analysis of the obtained results revealed also that the variation of the price of beans for a given month is influenced by the price of potato of the previous month at Huye market. On Nyanza market, only the price of potato has a significant influence on the variation of the price of bean on the market in short-run. In light of the findings of the present study the following recommendations are suggested: - The policy makers and local authorities
should consider the price transmission mechanism and the relationship between foodstuffs' prices in the control of prices of major staple food such as beans, white maize flour, and potato.
- From the central town of Huye, the market of Nyanza is situated nearly on the way to Muhanga town and to Kigali city. The distance between Huye market and Nyanza market is of about 37 km, and the market of Muhanga is at about 40 km from Nyanza town. Based on this information and on the fact that these three markets are in the same
province and are all on the main road Huye-Kigali, it would be interesting to conduct a study analysing the mutual influence between these main markets by assessing their level of integration for these important staple foods.
- The multivariate approach applied here showed its power in this kind of analysis by revealing features which could not be captured by the univariate analysis. Therefore, it is advised to use the multivariate model as it helps highlighting the influence of the other series.
6. Acknowledgements
The authors would like to thank the office of the Rwanda Agriculture Management Information System (AMIS-Rwanda) of the Ministry of Agriculture and Animal Resources of Rwanda for providing the raw data in July 2014.
7. References
Asare-Marfo, D., E. Birol, L. Katsvairo, J. d. A. Manirere, F. Maniriho, and D. Roy (2011).
Farmer Choice of Bean Varieties in Rwanda: Lessons learnt for HarvestPlus Delivery and Marketing Strategies. Harvest Plus. Kigali.
East African Journal of Science and Technology, Vol.5 issue 2, 2015 E. Musabanganji(P.179-178)
Best, R. (2008). An introduction to Error Correction Models. A presentation retrieved on October 27, 2014 on http://springschool.politics.ox.ac.uk/spring_sc hool/OxfordECM.pdf
Bourbonnais, R. (2007) Econométrie, 6ème édition, Dunod, Paris.
Brown, M., Higgins, N. and Hintermann, B. (2009). A Model of West African Millet Prices
in Rural Markets. CEPE Working Paper No.
69, Zurich.
Dembele, N. N. and Staatz, J., (1999). The
response of Cereal Traders to Agricultural Market Reform in Mali. Michigan State
University, East Lansing, MI 18.
Engle, R F., and Granger, C.W.J. (1987)
Co-integration and Error Correction: Representation, Estimation and Testing,
Econometrica 55:251-76.
Fews Net (2013). Rwanda Food Security Outlook. A first semester bulletin of Fews Net Rwanda, Kigali.
Galtier, F. (2009). The need for public
intervention to stabilise prices. Working Paper
MOISA No 2. November 2009, 4 pp.
Généreux, J. (Ed.). (2007). Economie politique
Volume 2-Microéconomie, Paris: Hachette.
Hafner, C. M. (2008). Modèles linéaires. Syllabus du cours, UCL, Louvain-la-Neuve, inédit.
Haschke et Le Bris. (2014). Fiche technique: Biens substituables et Biens complémentaires. Retrieved on October 27, 2014 from http://blbmail.free.fr/Biens.htm
Johansen, S. (1988) Statistical analysis of
cointegration vectors in Journal of Economic
Dynamics and Control, Volume 12, Issues 2-3: 231-254.
Kalyebara, R., and Buruchara, R. (2008).
Farm level impacts of improved bean varieties and agronomic technologies in Rwanda.
CIAT.
Karanja, D., Endire, S., Ruraduma, C., Kimani, M. P., Kweka,S. O., Butare, L. (2011)
Value Added Bean Technologies for Enhancing Food Security, Nutrition, Income and Resilience to cope with Climate Change and Variability Challenges in Eastern Africa.
East African Journal of Science and Technology, Vol.5 issue 2, 2015 E. Musabanganji(P.179-178)
Larochelle, C., Alwang, J. (2014). Impacts of
Improved Bean Varieties on Food Security in Rwanda. Selected Paper prepared for
presentation at the Agricultural & Applied Economics Association's 2014 AAEA Annual Meeting, Minneapolis, MN, July 27-29, 2014.
MINAGRI (2011). National Post-Harvest
Staple Crop Strategy, Kigali.
Mone, V. (2014, 10, 24). Gravitation des prix. Retrieved from
http://commons.wikimedia.org/wiki/File:
Gravitation_des_prix.png.
Musabanganji, E. (2013). Analysis of the
behavior of the main food product on local markets in Rwanda. A Methodological approach using Equilibrium model in Journal
of Emerging Issues in Economics, Finance and Banking (JEIEFB), Volume: 1 No.3 March 2013: 163-183.
Ngirente, E. (2008) Les marchés agricoles
intérieurs et les mutations agro-économiques en milieu rural rwandais, application à la filière de la pomme de terre, Thèse de
doctorat, UCL.
NISR (2013). 2013 Seasonal Agricultural
Survey, Kigali.
Nkurunziza, J. (2007). Déterminants de
l'inflation au Rwanda, Mémoire-Master, UCL.
Piana, V. (2014). Substitute goods. Retrieved
on October 26, 2014
fromhttp://www.economicswebinstitute.org/gl ossary/substitute.htm#subneeds
Pindyck, R. and Rubinfeld, D. (Ed.). (2009).
Microeconomics, 8th Edition, Prentice Hall,
Upper Saddle River.
RDB (2013). Rwanda Maize Facts, Kigali
RIU (2014, 10, 22). Potato innovation platform. Retrieved from
http://www.researchintouse.com/programmes/ riu-rwanda/riu-rw42innovplat-potato.html
ROPARWA (2007). Diagnostic et Elaboration
du plan de développement national de la filière maïs, Kigali.
Simioni, M. (2003) Etude sur les liens entre
les prix agricoles à la production et prix alimentaires, INRA.
Thomas, R.L. (Ed.). (1997) Modern Econometrics, An introduction. Harlow: Addison Wesley Longman.
Ugen, M., Musoni A., Cheminingwa, G., Kimani, P, Mucharo, M. and Katafire, M.
East African Journal of Science and Technology, Vol.5 issue 2, 2015 E. Musabanganji(P.179-178)
(2012). Utilization of common bean for
improved health and nutrition in Eastern and Central Africa, ASARECA Research Paper,
Entebbe.
USAID (2002). Potato Marketing in Rwanda. Agricultural Policy Development Project. Research Report N° 12, Kigali.
USAID (2013). Rwanda Cross-Border Agricultural Trade Analysis. A report produced by the USAID/Enabling Agricultural Trade (EAT) project, implemented by Fintrac Inc., Kigali.
Valdemiro, C. S. and Whitaker J. R. (1982).
Pysical, chemical and nutritional properties of common bean (Phaseolus vulgaris). In:
Advances in Food Research. Academic Press Inc., New York.