HAL Id: hal-01427218
https://hal.inria.fr/hal-01427218
Submitted on 5 Jan 2017
HAL is a multi-disciplinary open access
archive for the deposit and dissemination of
sci-entific research documents, whether they are
pub-lished or not. The documents may come from
L’archive ouverte pluridisciplinaire HAL, est
destinée au dépôt et à la diffusion de documents
scientifiques de niveau recherche, publiés ou non,
émanant des établissements d’enseignement et de
Automated Extraction of Product Comparison Matrices
From Informal Product Descriptions
Sana Ben Nasr, Guillaume Bécan, Mathieu Acher, João Ferreira Filho Bosco,
Nicolas Sannier, Benoit Baudry, Jean-Marc Davril
To cite this version:
Sana Ben Nasr, Guillaume Bécan, Mathieu Acher, João Ferreira Filho Bosco, Nicolas Sannier, et al..
Automated Extraction of Product Comparison Matrices From Informal Product Descriptions. Journal
of Systems and Software, Elsevier, 2017, 124, pp.82 - 103. �10.1016/j.jss.2016.11.018�. �hal-01427218�
Automated Extraction of Product Comparison Matrices
From Informal Product Descriptions
Sana Ben Nasra, Guillaume Bécana, Mathieu Achera, João Bosco Ferreira
Filhob, Nicolas Sannierc, Benoit Baudrya, Jean-Marc Davrild
aInria / IRISA, University of Rennes 1, France
bDepartment of Computer Science of the Federal University of Ceara, Brazil cSNT Center for Security, Reliability and Trust, University of Luxembourg, Luxembourg
dUniversity of Namur, FUNDP, Faculty of Computer Science, Belgium
Abstract
Domain analysts, product managers, or customers aim to capture the impor-tant features and differences among a set of related products. A case-by-case reviewing of each product description is a laborious and time-consuming task that fails to deliver a condense view of a family of product.
In this article, we investigate the use of automated techniques for synthe-sizing a product comparison matrix (PCM) from a set of product descriptions written in natural language. We describe a tool-supported process, based on term recognition, information extraction, clustering, and similarities, capable of identifying and organizing features and values in a PCM – despite the informal-ity and absence of structure in the textual descriptions of products.
We evaluate our proposal against numerous categories of products mined from BestBuy. Our empirical results show that the synthesized PCMs exhibit numerous quantitative, comparable information that can potentially comple-ment or even refine technical descriptions of products. The user study shows that our automatic approach is capable of extracting a significant portion of correct features and correct values. This approach has been implemented in
MatrixMiner a web environment with an interactive support for automatically
synthesizing PCMs from informal product descriptions. MatrixMiner also main-tains traceability with the original descriptions and the technical specifications for further refinement or maintenance by users.
1. Introduction
Domain analysis is a crucial activity that aims to identify and organize fea-tures that are common or vary within a domain [1, 2, 3]. A feature can be roughly defined as a prominent or distinctive user-visible aspect, quality or characteristic of a product [4]. At their respective level, domain experts, prod-uct managers, or even customers on their daily life activities need to capture and understand the important features and differences among a set of related prod-ucts [5]. For instance, the motivation for a customer is to choose the product that will exhibit adequate characteristics and support features of interest; when several product candidates are identified, she or he will compare and eventually select the "best" product. In an organization, the identification of important fea-tures may help to determine business competitive advantage of some products as they hold specific features.
Manually analyzing a set of related products is notoriously hard [6, 7, 3].
As the information is scattered all along textual descriptions, written in infor-mal natural language, and represent a significant amount of data to collect, review, compare and formalize; a case-by-case review of each product descrip-tion is labour-intensive, time-consuming, and quickly becomes impractical as the number of considered products grows.
Given a set of textual product descriptions, we propose in this article an approach to automatically synthesize product comparison matrices (PCMs). PCMs are tabular data describing products along different features [8]. Our approach extracts and organizes information despite the lack of consistent and systematic structure for product descriptions and the absence of constraints in the writing of these descriptions, expressed in natural language.
Numerous organisations (e.g., Wikipedia), companies, or individuals rely on tabular representation to present some discriminant features of a product com-pared to another [8,9]. With the extraction of PCMs, organizations or individu-als can obtain a synthetic, structured, and reusable model for the understanding
and the comparison of products. Instead of reading and confronting the infor-mation product by product, PCMs offer a product line view to practitioners. It is then immediate to identify recurrent features of a domain, to understand the specific characteristics of a given product, or to locate the features supported and unsupported by some products. PCMs are also an interesting potential step stone for further analysis such as: (1) formalization and generation of other domain models (e.g., feature models [10,7, 11,12,13]), (2) feature recommen-dation [6], (3) automatic reasoning (e.g., multi-objective optimizations) [14], (4) derivation of automatic comparators and/or configurators [9].
Numerous techniques have been developed to mine variability [10, 15, 16] and support domain analysis [17, 18, 19, 20, 7, 6, 3, 21, 22, 23], but none of them address the problem of structuring the information in a PCM.
Our automated approach relies on Natural Language Processing (NLP) and mining techniques to extract PCMs from text. We adopt an contrastive analysis technology to identify domain-specific terms (single and multi-word) from the textual descriptions. The proposed method takes the descriptions of the differ-ent products as input, and iddiffer-entifies the linguistic expressions in the documdiffer-ents that can be considered as terms. In this context, a term is defined as a concep-tually independent expression. Then, the method automatically identifies which terms are actually domain-specific. We also rely on information extraction to detect numerical information, defined as domain relevant multi-word phrases containing numerical values. The task of building the PCM involves computing terms (resp., information) similarity, terms (resp., information) clustering, and finally features and cell values extraction.
This approach has been implemented in a tool, MatrixMiner: It is a web environment with an interactive support for automatically synthesizing PCMs from informal product descriptions [24]. MatrixMiner also maintains trace-ability with the original descriptions and the technical specifications for further refinement or maintenance by users. This article is a significant extension of our ESEC/FSE tool demonstration, 4-pages paper [24]. We provide an in-depth de-scription of the automated extraction process as well as substantial empirical
results, including a user study with MatrixMiner. We rely on previous work in which we have defined a rich and expressive format capable of formally encoding PCMs [8].
We evaluate our tool against numerous categories of products mined from BestBuy [25], a popular American company that sells hundreds of consumer electronics. Overall, our empirical study shows that, given a supervised and necessary scoping (selection of products), the synthesized PCMs exhibit nu-merous quantitative and comparable information: 12.5% of quantified features, 15.6% of descriptive features, and only 13.0% of empty cells. The user study shows that our automatic approach retrieve 43% of correct features and 68% of correct cell values in one step and without any user intervention. We also show that we have as much or more information in the synthesized PCMs than in the technical specifications for a significant portion of features (56%) and cell values (71%).
The remainder of the article is structured as follows. In Section2, we provide additional background on PCMs and elaborate on the PCM synthesis challenge. Section 3 gives a general overview of our approach. Sections4 and5 describe the main steps of our approach, namely terms and information extraction, and subsequent construction of the PCM. In Section 6, we describe and illustrate the integration of the synthesis techniques into the MatrixMiner environment. Sections 7 to 9 successively present our case study and analyse the results of an empirical evaluation and a user study. In Section10, we discuss threats to internal and external validity while in Section 11 we point out the differences and synergies between existing works and our proposal. Section 12 concludes the article and presents future research directions.
2. Background and Motivation
Organizations describe the products they sell on their website using different categories of text forms. It goes from plain text in a single paragraph, formatted text with bullets, to matrices with product specifications. There is a spectrum
of product descriptions ranging from structured data (matrices) to informal de-scriptions written in natural languages. Both have strengths, weaknesses, and have the potential to comprehensively describe a set of products. BestBuy pro-vides descriptions for hundreds of thousands of products, including: (1) products
overviews, texts describing features of products using natural language (see
Fig-ure1); (2) technical specifications, which describe the technical characteristics of products through feature lists (see Figure2).
Figure1 illustrates the common scenario in which a customer needs to buy a laptop on BestBuy website and has to decide among a diversity of products. He/she has to go through many textual descriptions (product overviews) and reasons over the different features of the product. A typical question is to figure out if a particular feature is supported by existing products (if any) and what are the alternatives. In domain analysis, the biggest challenge is related to the number of products and the number of features an analyst has to gather and organize. The more assets and products, the harder the analysis. Our goal is to automate the manual task of analyzing each product with respect to its textual description and clustering information over several products, and provides a reader with an accurate and synthetic product comparison matrix (PCM), as shown in Figure1.
The manual elaboration of a PCM from textual overviews can be done as follows. First, it requires the ability to detect from the text the potentially relevant domain concepts expressed as single or multi words including domain specific terms and numerical information, such as those that are highlighted in the text of Figure 1. Once detected, multiwords have to be split between the feature name and its value. We observed different value types for features in a previous work [26]. Each of these value types imply a different interpretation for the feature. For instance, the feature "Touch Screen" means the availability of the feature, which has to be interpreted as as a YES/NO value (see the PCM of Figure1). Feature values can also mix letters and numbers, for instance the following snippet: "5th Gen Intel Core i7-5500U". Consequently, determining features and their related values is not a trivial problem.
Figure 1: Automatic synthesis of a PCM from 4 textual product descriptions. Portions of texts in yellow have been identified and exploited to synthesize features’ names and cell values. High-quality images and voice recognition (in red) are features not described in the technical specifications of the same 4 products (see Figure2).
Figure 2: Basic aggregation of 4 technical specifications into a PCM. Height, width, and depth (red) are features not described in the textual descriptions of the 4 products; the other features overlap and are also contained in synthesized PCM
2.1. Toward Automatic Extraction of PCMs
Our objective is to automate the identification of features, their values, and collect information from each product to create a complete PCM. This comes with a set of challenges, mostly due to the informal and unstructured nature of textual overviews.
First, the representation aims to provide a structured view of all available products and all available features. From a parsing and natural language pro-cessing perspective, plain text and PCMs have different organizations schemes. On the one hand, text is grammatically organized but may not been organized in terms of feature definitions nor description. As being part of open initia-tives such as consumer associations, mainstream initiainitia-tives like Wikipedia, or e-commerce websites, one cannot rely on the quality of the textual descriptions, in terms of both wording and organization. For instance, textual descriptions may present features in different orders as to put emphasis on a particular one, or may have different authors that do not share the same writing patterns. On the other hand, a PCM is clearly organized as a set of products, features, and associated values. If a product description provides for free the product’s name, it is not trivial to determine its features and their values, which have to be mined from the description, as stated previously.
Second, it is not only a matter of parsing products features and their respec-tive values. It is also a matter of making the most synthetic and relevant PCM to enable comparison. The number of features depends on both (1) the textual description length, precision, and quality, and (2) the capability to cluster fea-tures as they share the same meaning but different names. Finding the right name for a feature can have an impact on the number of features. Being generic (for instance, "processor") increases the possibility to have different values for this feature whereas a series of too specific features ("5th Gen Intel... processor") will only have a YES/NO value with a high risk of feature explosion. Ideally we would rather like to extract a feature (e.g. processor) together with a value (e.g. 5th Gen Intel...) out of an informal text.
2.2. Complementarity between Product Overviews and Technical Specifications
Another interesting observation is the nature of relationship that can exist between product overviews and product specifications. Again, with the same ex-ample, but now considering technical specifications, we automatically compute the output PCM (see Figure2).
Figure 3: Complementarity between synthesized PCMs (textual overviews, left-hand side) and technical specifications (right-hand side)
With our automated extraction from overviews, there is also a potential to complement or even refine technical specifications of products (see the two PCMs in Figure1 and Figure 2). Considering the verbosity aspect of natural language, the overview can contain information that refines the information of the specification. If we compare the cell values of the same feature or two equivalent features in the overview and the specification, we observed that the cell value in the overview PCM can refine the cell value in specification PCM.
For example, "Media Reader" exists in both overview PCM and specification PCM of laptops. In the first case, it has "Digital", "Multiformat", "5–in–1" as possible values, while in the second case, it is simply a boolean feature. "Web-cam"is also boolean in specification PCM and non boolean in overview PCM ("Front–facing TrueVision..." and "Built–in high–definition"). In the specification PCM, "Memory" has "12 GB" as a possible value, while in the overview PCM, the value contains also the type of memory: "12GB DDR3L SDRAM". At the
same time, "Operating System" has "Windows 8.1" as a possible value in the specification PCM, however it includes also the architecture in the overview PCM ("Microsoft Windows 8.1 64-bit").
Furthermore, in an overview PCM, we can obtain additional features that could refine features existing in specification PCM. For instance, "High–quality images"and "Voice Recognition Software" are two features in the overview PCM. However, they do not exist in the specification PCM. Hence, overviews can also complement the information of technical specifications.
Similarly, the specification PCM can contain information that refine those in the overview PCM. For instance, the following features "height", "width” and "depth” in the specification PCM refine "size" in the overview PCM. The mapping of features can be one-to-one or arbitrarily complex. Overall the user can get a complete view through the PCM and the aggregation of information coming from both overviews and specifications.
3. Overview of the Automatic Extraction
Figure 4: Approach Overview
Our approach is summarized in Figure4and consists of two primary phases. In the first phase, domain specific terms and numerical information are ex-tracted from a set of informal product descriptions (steps Ê to Í), while in the second phase the PCM is constructed (steps Î to Ð). For step Ê, the raw product descriptions are extracted along different categories of products. We
provide means to either (1) manually select the products to be included in the comparison; or (2) group together closest products within a category.
We outline in the following the rest of the procedure.
Mining Domain Specific Terms. Steps Ë and Ì are based on a
natu-ral language processing approach, named contrastive analysis [27], for mining
domain specific termsfrom textual documents. In this context, a term is a
con-ceptually independent expression (either single or multi-word). A multi-word is conceptually independent if it occurs in different context (i.e. it is normally accompanied with different words). For instance, "Multiformat Media Reader" is a term, while "Reader" is not a term, since in the textual product descriptions considered in our study it often appears coupled with the same word (i.e. "Me-dia"). Combining single and compound words is essential to detect features and their values.
The purpose of the contrastive analysis method is to find out the terms which are specific for the domain of the document under study [27, 28]. Basically, contrastive analysis confronts the terms mined from domain-specific documents (here: informal product descriptions) and those retrieved from domain–generic documents (e.g., newspapers). If a term from the domain-specific document is not frequent in the domain-generic documents, it is a domain-specific term. Otherwise, it is a domain-generic term.
Information Extraction. Step Í aims at mining numerical information
since they are capable to describe precisely the technical characteristics of a product. These information are domain relevant multi-word phrases which con-tain measures (e.g. "1920 x 1080 Resolution") including intervals (e.g. "Turbo Boost up to 3.1 GHz").
Inspired by the "termhood" concept used earlier, the extracted multi-words should be conceptually independent from the context in which they appear. For instance, suppose we have in the text this phrase "the processor has 3 MB cache and 2.0 GHz processor speed". Here, "2.0 GHz Processor Speed" is conceptually independent whereas "2.0 GHz Processor" is not. We use statistical filters in-spired by the "termhood" metric applied in step Ë, to extract these numerical
domain relevant multi-words from text.
Building the PCM. Once the top list for the terms and respectively for
numerical information are identified for each product, we start the construction of the PCM. This process requires creating some intermediate structures. The key idea is to perform separately terms clustering from information clustering. A terms cluster gives the possible descriptor values (e.g. "Multiformat") while an information cluster provides the potential quantifier values (e.g. "1920 x 1080") for the retrieved feature. In step Î we compute similarity between terms and correspondingly between information to generate two weighted similarity relationship graphs: a Terms Relationship Graph (TRG) and an Information Relationship Graph (IRG). To identify coherent clusters, we first determine the similarity of each pair of elements by using syntactical heuristics. In step Ï we apply clustering in each graph to identify terms clusters and information clusters. Finally, step Ð extracts features and cell values to build the PCM. Elements which are not clustered will be considered as boolean features. We distinguish different types of features (see Figure1): boolean which have Yes/No values, quantified when their values contain measures (e.g. "Resolution", "Hard Drive", etc.), descriptive if their values contain only noun and adjectival phrases (e.g. "Media Reader"). The resulting PCM can be visualized and refined af-terwards. In the following sections, we elaborate these three main tasks. We address mining terms and information in Section4 and the construction of the PCM in Section5.
4. Terms & Information Extraction
In this section, we describe the first half of our approach which handle the terms and information extraction from textual descriptions. Several successful tools have been developed to automatically extract (simple or complex) terms [29,27]. The reason why we develop our own terms extractor is that we propose later an extraction of numerical information inspired by the termhood concept. This section includes mining domain specific terms (steps Ê to Ì) in Sections
4.1. Terms Mining
Terms mining consists in the first two steps of Figure4. Firstly, raw feature descriptors are mined from each product overview via the BestBuy API. The product overview tend to include a general product description followed by a list of feature descriptors. Therefore, given n products of the same category, we have D1...Dn documents (products overviews). From each one of these
documents we identify a ranked list of terms. In this section, we discuss the candidate extraction process, that makes use of: i) linguistic filters; ii) stoplist; iii) statistical filters (C-NC Value).
4.1.1. Linguistic filters.
The linguistic filters operate on the automatic Part–of–speech (POS) tagged and lemmatized text, making use of various types of linguistic feature. POS tagging is the assignment of a grammatical tag (e.g. noun, adjective, verb, preposition, determiner, etc.) to each word in the corpus. It is required by the linguistic filter which will only allow specific expressions for extraction. Table1
contains lines of the corpus before the tagging and after the tagging. After POS tagging, we select all expressions (multi-words) which follow a set of specific POS patterns, that we esteem relevant in our context. Without any linguistic information, undesirable expressions such as of the, is a, etc., would also be mined.
Since most terms are made up of nouns and adjectives, [30], and sometimes prepositions, [31], we adopt linguistic filters that accept these kinds of expres-sions (see F1, F2 and F3). They extract terms like "operating system", "digital media reader", "wide array of streaming media", etc. The choice of linguistic filters has an influence on the precision and the recall of the output list, e.g a restric-tive filter will have a posirestric-tive influence on precision and a negarestric-tive influence on recall [32]. We are not strict about the choice of a specific linguistic filter, because different applications need different filters.
Table 1: Sample of the corpus before and after POS tagging
BEFORETagging
Enjoy stunning images with this HP ENVY m7-k211dx laptop’s 17.3 high-definition touch screen and NVIDIA GeForce 840M graphics, with 2GB ded-icated video memory, which display games, movies and streaming media in brilliant clarity and detail.
5th Gen Intel Core i7-5500U processor.
Features a 4MB L3 cache and 2.4 GHz processor speed. 17.3 WLED-backlit high-definition touch-screen display.
AFTERTagging
Enjoy/VB stunning/JJ images/NNS with/IN this/DT HP/NNP ENVY/NNP m7-k211dx/JJ laptop/NN ’s/POS 17.3/CD high-definition/JJ touch/NN screen/NN and/CC NVIDIA/NNP
GeForce/NNP 840M/CD graphics/NNS ,/, with/IN 2GB/CD ded-icated/JJ video/NN memory/NN ,/, which/WDT display/VBP games/NNS ,/, movies/NNS and/CC streaming/VBG media/NNS in/IN brilliant/JJ clarity/NN and/CC detail/NN ./.
5th/JJ Gen/NNP Intel/NNP Core/NNP i7-5500U/JJ processor/NN ./. Features/VBZ a/DT 4MB/NNP L3/NNP cache/NN and/CC 2.4/CD GHz/NNP processor/NN speed/NN ./.
17.3/CD WLED-backlit/JJ high-definition/JJ touch-screen/JJ display/NN ./.
We will present our approach combined with each of these three filters:
F1: Noun+ Noun
F2: (Adj|Noun)+ Noun
F3: (Noun Prep | Adj)*Noun+
In our approach, we use a filter which also constrains the maximum number of words. This measure is to be considered as domain-dependent, being related to the linguistic peculiarities of the specialized language we are dealing with. In arts for example, terms tend to be shorter than in science and technology. The length also depends on the type of terms we accept. Terms that only consist of nouns for example, very rarely contain more than 5 or 6 words.
The process of finding this maximum length is as follows: we attempt to identify expressions of a specific length. If we do not obtain any expressions of this length, we decrease the number by 1 and make a new attempt. We carry on in this way until we find a length for which expressions exist. At this point,
mining candidate expressions can take place.
4.1.2. Stoplist.
A stop-list is a list of words which are very common words. These words are not included in standard representations of documents because they are common to all the documents and cannot be good discriminators. Removing the stop words allows us to focus on the sole important words in the representations.
4.1.3. Statistical filters based on C-NC Value.
Terms are finally extracted and ranked by computing C-NC value [27]. This metric determines how much an expression is likely to be conceptually indepen-dent from its context. An expression is conceptually depenindepen-dent if it requires additional words to be meaningful in its context while an expression is concep-tually independent if it appears in different context. Some examples are: "touch screen", "high quality images", "plenty of storage capacity" or "Media Reader". In our study, "Media Reader" is considered as a whole since "Reader" often appears coupled with the same word "Media".
We eventually obtain for each Di a ranked list of expressions together with
their ranking according to the C-NC metric, and their frequency in the docu-ment. We choose from the list the k terms having the higher ranking. The value of k has been empirically selected: a higher value ensures more domain-specific terms but at the same time it could introduce noisy expressions. For further details, we provide in Appendix A an explanation of the computation of the C-NC value metric as well as an algorithm describing the steps to construct a list of candidate terms from a corpus [27,33].
4.2. Contrastive Analysis
The contrastive ranking technique aims at refining extracted terms by fil-tering noise due to common words. We can re-rank terms according to their domain-specificity [27]. We consider terms extracted from both domain-specific document Di and domain generic documents (the contrastive corpora) using
the same method described in Section4.1. Specifically, we have chosen as do-main generic documents the Penn Treebank corpus which collects articles from
the Wall Street Journal. Ferrari et al. [23] have employed a similar approach and corpus. The new rank Ri(t) for a term t extracted from a document Di is
computed as follows: Ri(t) = arctan(log(fi(t)) · ( fi(t) Fc(t) Nc )
where fi(t) is the frequency of the term t extracted from Di, Fc(t) is the
sum of the frequencies of t in the contrastive corpora, and Nc is the sum of
the frequencies of all the terms extracted from Di in the contrastive corpora.
The rationale behind this ranking is as follows: If a term is less frequent in the domain-generic documents, it is considered as a domain-specific term and is consequently ranked higher. We obtain for each Di a list of terms, together
with their ranking according the function R, and their frequency in Di. Finally,
we empirically select the l terms having the higher ranking from each list. Our empirical selection is guided by the following observation: Higher values of l might introduce terms that are not domain-specific, while lower values could eliminate relevant terms.
4.3. Information Extraction
Besides domain-specific terms, we also consider numerical information de-fined as domain relevant multi-word phrases containing numerical values, since they are capable to describe precisely the technical characteristics of a product. We use filters that extract multi-words including numbers (Integer, Double, pourcentage, degree, etc): "3.0 GHz Processor Speed", "Microsoft Windows 8.1 64-bit Operating System"; multiplication of numbers: "1920 x 1080 Resolution"; and intervals: "Turbo Boost up to 3.6GHz", "Memory expandable to 16GB". Our method is combined with each of these three filters:
F4: Nb-Exp(Adj|Noun)* Noun F5: (Adj|Noun)*Noun Nb-Exp
F6: (Adj|Noun)*Noun Nb-Exp (Adj|Noun)*Noun
– Number (Integer, Double, pourcentage, degree, etc.): Nb, Nb%, Nb◦.
– Multiplication of numbers: Nb × Nb.
– Interval: Nb − Nb, up to Nb, down to Nb, expandable to Nb, ≤ Nb, ≥ Nb, etc.
Inspired by the "termhood" concept used earlier, the extracted multi-words should be conceptually independent from the context in which they appears. For instance, "3.0 GHz Processor Speed" is conceptually independent whereas "3.0 GHz Processor" is not. Similarly, we identify a ranked list of domain relevant multi-words from each document Di by applying first linguistic filters (F4, F5,
F6) using POS tagging and second statistical filters inspired by C-NC Value. When combining the C-Value score with the context information (see Ap-pendix A), the algorithm extracts the context words (obviously not numbers) of the top list of candidates and then calculates the N-Value on the entire list of candidate multi-words. A word is considered a context word if it appears with the extracted candidate multi-words.
When computing the weight of a context word w, weight(w) = t(w) n , t(w)
is not only the number of candidate multi-words w appears with, but also the number of domain-specific terms containing w and n is the total number of considered candidate multi-words and domain-specific terms.
Hence, for each Di, we have a ranked list of multi-words that can be
con-sidered domain relevant, together with their ranking according to the C-NC metric. The more a multi-word is likely to be a domain relevant, the higher the ranking. From the list we select the k multi-words that received the higher ranking. The value of k shall be empirically selected.
5. Building the PCM
Now that we have for each product a list of domain specific terms ranked according to the C-NC metric and their frequency in the corresponding product descriptions and also a list of numerical information ranked according to the C-NC Value, the whole challenge consists in building a sound and meaningful
PCM. This process requires to find out the final features and compute the cell value for each couple product-feature.
To extract features and cell values, a first natural strategy is to perform clustering based on the similarity of the elements (terms or information) to compute groups of elements. The intuitive idea is that clusters of syntactically similar elements can be exploited to identify the common concern, witch can be organized as variability concept, and its possible values, since elements in a cluster are likely to share a common feature but with different quantification (in the case of information clusters) or description (in the case of terms clusters). Cell values can be (see the PCM of Figure1):
• Boolean: can take a value of True or False, to represent whether the feature is present or not.
• Descriptors: noun phrases and adjectival phrases given according to this pattern: (Adj | Noun)+: "Digital" and "Multiformat" are two descriptor values of "Media Reader"; and "Front-facing TrueVision high-definition" and "Built-in high-definition" represent two potential values of "Webcam". • Quantifiers: measures that can be Integer, Double, Partial, etc; in com-pliance with Nb-Exp ((Adj | Noun)* Noun)* pattern. For instance, "1366 x 768" as "Resolution", "12GB DDR3L SDRAM" as "Memory"; "up to 3.1 GHz" as "Turbo Boost"; and "Microsoft Windows 8.1 64-bit" as "Operating System".
5.1. Terms and Information Similarity
The goal here (step Î in Figure 4) is to determine a weighted similarity relationship graph among terms and respectively among numerical information. Two graphs were constructed: Terms Relationship Graph (TRG) and
Infor-mation Relationship Graph (IRG) in which nodes represent respectively terms
and information. Assume there are n terms, they and their relationships are modeled as an undirected graph T RG = (V, E), in which:
E= {Eij| Eij is the relationship between terms Ti and Tj,1 ≤ i, j ≤ n}.
Similarly, assume there are m numerical information, IRG is an undirected graph and is defined as IRG = (V0, E0), in which:
V0= {Ii| Ii is an individual information, 1 ≤ i ≤ m},
E0= {E0ij| E0ij is the relationship between information Ii and Ij,1 ≤ i, j ≤ m}.
The key point is to determine the weight of each edge to express the strength of the relationships between terms and respectively between numerical informa-tion. We define the weight function W (e) for each edge, where e ∈ E ∪ E0. To
identify coherent clusters, we determined the similarity of each pair of elements through computing syntactical heuristics.
Syntactical heuristicsuse edit distance and other metrics based on words’
morphology to determine the similarity of two elements. We used the so-called Levenshtein edit distance [34] that computes the minimal edit operations (re-naming, deleting or inserting a symbol) required to transform the first string into the second one. For example, the Levenshtein distance between "kitten" and "sitting" is 3, since the following three edits change one into the other, and there is no way to do it with fewer than three edits (substitution of "s" for "k", substitution of "i" for "e", and insertion of "g" at the end).
In this work, we do not employ semantic similarity metrics. We favour a syntactical strategy since a substantial amount of features and values are made of specific technical terms and numerical values.
5.2. Terms and Information Clustering
After building the two relationship graphs, we apply terms clustering in TRG and information clustering in IRG to identify respectively terms clusters and information clusters (step Ï in Figure4). The underlying idea [35] is that a cluster of tight-related elements with different granularities can be generated by changing the clustering threshold value t. The algorithm for terms and information clustering, inspired by [35], is described in Algorithm1.
Algorithm 1:Terms and Information clustering
Input : undirected graph G representing a terms/information
relationship graph (TRG or IRG); t as the threshold for clustering
Output: list of clusters C
1 for each edge e in G do 2 if W(e) ≥ t then
3 e.validT ype= true;
4 else
5 e.validT ype= false;
6 end
7 end
8 C = connectedComponentsByValidEdges(G);
In this algorithm, the attribute validT ype of each edge indicates whether this edge is valid for computing the connected components. We use the func-tion connectedComponentsByV alidEdges(G) to decompose the graph G into connected components. Here, G corresponds to terms relationship graph or in-formation relationship graph. In the same connected component, vertices are reachable from each other through the edges whose validT ype attribute is true. This function returns a set of connected components, and each of them forms a cluster composed by a set of tight-related elements.
To identify clusters, a threshold value t is fixed. If an edge exists between two elements and its weight is greater than or equal to t, they will belong to the same cluster; otherwise, they will not. Thus, the edges whose weights are above or equal to the threshold value are set to be valid; otherwise, the edges are invalid. Then connected components are computed by the valid edges. Each connected component is a cluster of tight-related elements sharing the same concern which represents the feature. As we decrease the threshold value, more edges are set to be valid, and we get clusters with coarser granularities.
5.3. Extracting Features and Cell Values
Finally to construct the PCM, we need to extract the features and the cell values from terms clusters and information clusters (step Ð in Figure 4). To retrieve the feature name from a cluster, we developed a process that involved
selecting the most frequently occurring phrase from among all elements (terms or information) in the cluster. This approach is similar to the method presented in [36] for summarizing customer reviews. To identify the most frequently occur-ring phrase we reuse the POS tags identified earlier (see Section4.1). The ele-ments are then pruned to retain only Noun+for terms clusters and (Adj|Noun)* Noun for information clusters, as the other expressions were found not to add
useful information for describing a feature.
Frequent itemsets are then determined for each of the clusters. In this con-text, frequent itemsets represent sets of expressions which frequently co-occur together in the elements attributed to the same cluster. Formally, the support of an itemset I is the number of elements in the cluster that contain all the expressions in I. Given a pre-determined itemset support threshold, s, I is con-sidered frequent if its support is equal or larger than s1. Different algorithms
are proposed for mining frequent itemsets including the Apriori [37] and Eclat algorithms. We chose to adopt Apriori as it is shown to be memory-efficient and hence suitable for the size of our data set. To select a feature name, the frequent itemset of maximum size, F ISmaxis selected. Finally, to extract cell values, we
substitute F ISmaxfrom each element within the cluster. For example, "Digital
Media Reader" and "Multiformat Media Reader" form a terms cluster. "Media Reader" is the feature name, while "Digital" and "Multiformat" are two possible values. At the same time, "1920 x 1080 Resolution", "1366 x 768 Resolution" and "2560 x 1600 Resolution" represent information cluster that gives "Resolution" as a features name and three potential values: "1920 x 1080", "1366 x 768" and "2560 x 1600". Elements which are not clustered will be considered as boolean features. Each cluster adds one column in the PCM containing the feature and the corresponding cell value for each product in the family.
1We set this threshold to 1 since we want to find out itemsets that occur in all elements in the cluster.
Figure 5: Extraction of Features and Cell Values
6. Tool Support
MatrixMiner offers an interactive mode where the user can import a set of
product descriptions, synthesize a complete PCM, and exploit the result [24]. We also have pre-computed a series of PCMs coming from different categories of BestBuy (Printers, Cell phones, Digital SLR Cameras, Dishwashers, Laptops, Ranges, Refrigerators, TVs, Washing Machines). Our tool also provides the ability to visualize the resulting PCM in the context of the original textual product descriptions and also the technical specification typically to control or refine the synthesized information.
6.1. Implementation and Used Technologies
Stanford CoreNLP2 provides a set of natural language analysis tools which
can take raw text input and give the base forms of words, their parts of speech, etc. Stanford CoreNLP integrates many of NLP tools, including the Part-Of-Speech (POS) tagger that reads text in some language and assigns parts of speech to each word (and other token), such as noun, verb, adjective, etc. To tokenize and remove stop words from text we use Lucene3 which is a
high-performance, scalable Information Retrieval (IR) library for text indexing and
2http://nlp.stanford.edu 3https://lucene.apache.org
searching. Smith-Waterman and Levenshtein compute syntactical similarity based on words’ morphology. They come from the Simmetrics4 library. The
specific source code of the extraction procedure is available online: https:// github.com/sbennasr/matrix-miner-engine. Our Web environment reuses
the editor of OpenCompare5.
6.2. Importing, Visualizing, and Editing
The MatrixMiner environment is dedicated to the visualisation and edition of PCMs. Human intervention is beneficial to (1) refine/correct some values (2) re-organize the matrix for improving readability of the PCM.
As a result we developed an environment for supporting users in these activ-ities. Our tool provides the capability for tracing products and features of the extracted PCM to the original product overviews and the technical specifica-tions. Hence the PCM can be interactively controlled, complemented or refined by a user. Moreover users can restructure the matrix through the grouping or ordering of features. Overall, the features available are the following:
• select a set of comparable products. Users can rely on a number of filters (e.g. category, brand, sub categories, etc. See Figure6, A );
• ways to visualize the PCM with a traceability with original product descrip-tions. For each cell value, the corresponding product description is depicted with the highlight of the feature name and value in the text. For instance, "500GB Hard Drive" is highlighted in the text when a user clicks on "500GB" (see Figure6, B and C );
• ways to visualize the PCM with a traceability with the technical specification (see Figure 6, D ). For each cell value, the corresponding specification is displayed including the feature name, the feature value and even other related features. Regarding our running example, "Hard Drive Capacity" and two related features ("Hard Drive Type" and "Hard Drive RPM") are depicted together with their corresponding values;
4http://sourceforge.net/projects/simmetrics 5https://github.com/gbecan/OpenCompare
Figure 6: The editor of MatrixMiner in action
• basic features of a PCM editor. Users can remove the insignificant features, complete missing values, refine incomplete values or revise suspect values if any – typically based on information contained in the textual description and the technical specification;
• advanced features of a PCM editor: means to filter and sort values (see Figure 6, E and F ); ways to distinguish Yes, No and empty cells using different colors to improve the readability of the PCM; prioritise features by changing the columns order, etc.
7. Case Study and Evaluation Settings
So far, we have presented a procedure and automated techniques, integrated into the MatrixMiner environment, for synthesizing PCMs. For evaluating our approach, we considered a dataset coming from BestBuy, a multinational con-sumer electronics corporation. BestBuy provides descriptions for hundreds of thousands of products in different domains. We used the BestBuy dataset to synthesize PCMs out of informal product descriptions.
Our evaluation is made of two major studies.
Empirical Study (Section 8). We aim to measure some properties of
the extracted PCMs. Is our extraction procedure able to synthesize comparable information and compact PCMs? Is there an overlap between synthesized PCMs and technical specifications?
User Study (Section9). We aim to evaluate the quality of the information
in the synthesized PCMs. How correct are features’ names and values in the synthesized PCMs? Can synthesized PCMs refine technical specifications? Such a study necessitates a human assessment. We have involved users to review information of our synthesized PCMs using MatrixMiner traceabilities.
In the reminder of this section, we describe the dataset and evaluation set-tings we use for performing the two studies (see Section8and Section9).
7.1. Data
We selected 9 products categories that cover a very large spectrum of do-mains (Printers, Cell phones, Digital SLR Cameras, Dishwashers, Laptops, Ranges, Refrigerators, TVs, Washing Machines) from Bestbuy. Currently, we have implemented a mining procedure on top of BestBuy API [25] for retrieving numerous product pages along different categories. We mined 2692 raw product overviews using Bestbuy API. The characteristics of the dataset are summarized in Table2.
Table 2: Overview dataset
Products Category #Products Overviews #Words per Overview (Avg)
Laptops 425 350 Cell Phones 99 225 Cameras 141 279 Printers 183 277 TVs 253 283 Refrigerators 708 187 Ranges 538 275 Washing Machines 107 255 Dishwashers 238 263
Total 2692 897,020 (#Words in all Overviews)
Another important property of the dataset is that product descriptions across and within different categories do not share the same template. We came to this conclusion when manually grouping and looking at products de-scriptions within the same category. We have read hundreds of dede-scriptions (169 clusters of comparable products have been obtained, see next section). We have observed that the text does not follow the same structures: There are not neces-sarily the same implicit sections (if any) or the same granularity of details. The absence of template challenges extractive techniques – precisely our approach does not assume any regular structure of product descriptions.
7.2. Threshold Settings
Our extraction procedure exhibits some parameters. As part of our exper-iments, we used the same exact parameters’ values for all products categories (laptops, cell phones, cameras, printers, TVs, washing machines, etc.). Now, we describe how these values have been empirically set.
Among the automatically extracted terms, for each Di we have selected the k = 30 items that received the higher ranking according to the C-NC Value.
The value for k has been empirically chosen: we have seen that the majority of the domain-specific terms – to be re-ranked in the contrastive analysis phase – were actually included in the first 30 terms. We have seen that higher values of k were introducing noisy items, while lower values were excluding relevant domain-specific items.
The final term list is represented by the top list of 25 terms ranked accord-ing to the contrastive score: such a list includes domain–specific terms only, without noisy common words. It should be noted that the two thresholds for top lists cutting as well as the maximum term length can be customized for domain–specific purposes through the configuration file. As it was discussed in Section4.1.1, the length of multi–word terms is dramatically influenced by the linguistic peculiarities of the domain document collection. We empirically tested that for the electronics domain, multi–word terms longer than 7 tokens introduce noise in the acquired term list.
Now regarding automatically retrieved numerical information, for each Di
we have selected the k = 15 items that received the higher ranking according to the C-NC Value. To calculate clusters of similar terms (resp. information), the threshold of similarity t has been set empirically after experiments at 0.6 (resp. 0.4). We have seen that the majority of well-formed clusters actually occur when the similarity thresholds are set at these values.
8. Empirical Study
In this section, we address three research questions:
• RQ1.1: What are the properties of the extracted PCMs
(be-ing from overviews or technical specifications)? We measure the
amount of comparable information, the size of matrices, and the incom-pleteness of the information. Does our extraction procedure synthesize
PCMs of good quality? Do synthesized PCMs differ from technical speci-fication PCMs?
• RQ1.2: What is the impact of selected products on the extracted
PCMs (being from overviews or technical specifications)? A naive
selection of products may lead to a non-compact and non-exploitable PCM since considered products have little in common and thus hard to compare. • RQ1.3: Is there an overlap between synthesized PCMs and
technical specifications? We automatically compute common features’
names and values in both sides for investigating the complementarity of the two sources of information.
8.1. Dataset
We created two main datasets: overviews dataset and specifications dataset. Each of them comprises two sub-datasets (random and supervised) which con-tain respectively a random and supervised selection of groups of 10 products belonging to the same category (e.g. laptops).
8.1.1. Overviews Dataset (D1)
SD1.1: Overviews Dataset (random). We randomly select a set of
products (also called clusters hereafter) in a given category (e.g. laptops) and we gather the corresponding products overviews. To reduce fluctuations caused by random generation [38], we run 40 iterations for each category. Results are reported as the mean value over 40 iterations.
SD1.2: Overviews Dataset (supervised clustering). A domain
ex-pert manually selected 169 clusters of comparable products against product overviews. To this end, he relies on a number of filters proposed by Bestbuy (brand, sub categories, etc.). The key idea is to scope the set of products so that they become comparable.
8.1.2. Specifications Dataset (D2)
SD2.1: Specifications Dataset (random). We keep the same set of
products as SD1.1 (that is based on a random strategy). This time we consider technical specifications.
SD2.2: Specifications Dataset (supervised). We keep the same set of
products as SD1.2. (that is based on a supervised clustering). We consider technical specifications.
8.2. RQ1.1. What are the properties of the extracted PCMs (being from overviews or technical specifications)?
Motivation of the study. We investigate whether our approach is able to
syn-thesize comparable information and compact PCMs out of informal overviews. As an extreme case we do not want very large and sparse PCMs with lots of empty cells. We also compare synthesized PCMs with technical specifications. For example: how incomplete are technical specifications in comparison to our synthesized PCMs? Overall, this study gives preliminary insights about (1) the quality of our extraction procedure; (2) the strengths and weaknesses of our synthesized PCMs.
Experimental Setup. To answer our research question, we compute the
fol-lowing metrics over these two datasets: SD1.2 and SD2.2.
• PCM size: the smaller is the size of the PCM, the more exploitable is the matrix.
• % Boolean features: the fewer boolean features there are, the more readable is the PCM.
• % Descriptive and quantified features: the more quantified and de-scriptive features there are, the more usable and exploitable is the PCM. • % Empty cells (N/A): the fewer empty cells there are, the more
com-pact and homogeneous is the PCM.
• % Empty cells per features category: in particular, we measured the percentage of boolean empty cells, the percentage of quantified empty cells and the percentage of descriptive empty cells.
• Number of empty cells per features category (Avg): specifically, we measured the average of empty cells per boolean feature, the average of empty cells per quantified feature and the average of empty cells per descriptive feature.
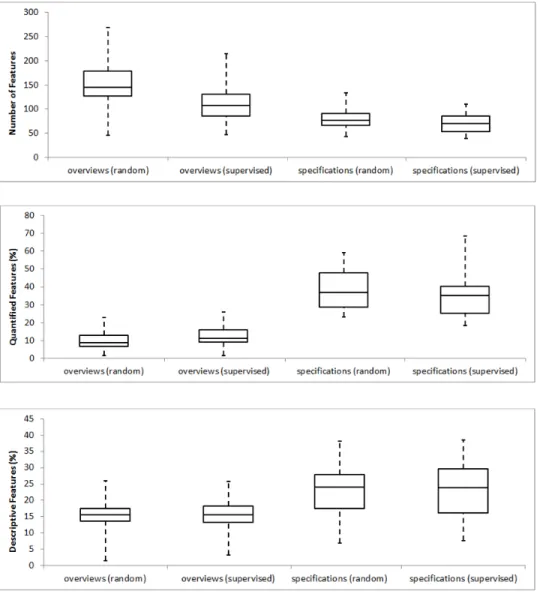
The experimental results show that the synthesized PCMs exhibit numerous quantitative and comparable information. Indeed, the resulting overview PCMs contain in average 107.9 of features including 12.5% of quantified features and 15.6% of descriptive features. Only 13% of cell values are empty which demon-strate that our approach is able to generate compact PCMs.
When applying a supervised scoping, we notice that specification PCMs have 35.8% less features in average than overview PCMs. The nature of product overviews (and the verbosity of natural languages) partly explains the phe-nomenon. Interestingly, overview PCMs reduce the percentage of empty cells by 27.8 percentage points.
8.3. RQ1.2. What is the impact of selected products on the extracted PCMs (being from overviews or technical specifications)?
Motivation of the study. In the previous research question, the 10 products
subject to comparison have been carefully selected. There may be less favourable cases for which the 10 products have been randomly chosen and are thus harder to compare, despite being in the same category. A first assumption is that, for such cases, our extraction procedure can have more difficulties to synthesize PCMs of good quality. A second assumption is that technical specifications face similar issues (e.g., the number of empty cells increases) when a naive selection of input products is performed. The question can be formulated as follows: does the set of considered products influence the properties of the PCMs (e.g., number of empty cells)? Overall, this study gives further insights about our extraction procedure and the kinds of resulting PCMs we can extract.
Experimental Setup. To answer our research question, we compare random
and supervised techniques for products selection according to the metrics that we had used previously in RQ1.1. Thus, we need to compute as well these
metrics over random datasets: SD1.1 and SD2.1. Figures 7 and 8 describe the properties of the synthesized PCMs when applying random and supervised scoping.
The experimental results are as follows.
Complexity of PCMs. We compare the properties of overview PCMs
generated using a random scoping and those engendered from a supervised scoping. We first notice that a supervised manner reduces significantly the complexity of the derived PCMs with 30.4% less cells and as much less fea-tures than a random selection of products. These results also show that our extraction is capable of exploiting the fact that products are closer and more subject to comparison.
Similarly, when we compare specification PCMs obtained respectively from a naive and supervised selection of products, we observe that a supervised scoping gives better results. Indeed, supervised PCMs contain 13.1% less cells and likely less features than random PCMs.
Homogeneity of PCMs. Following a naive scoping, we extracted overview
PCMs with 16.4% of empty cells in average, whereas a manual clustering of products leads to a lower percentage of empty cells (13% in average). In particular, we observe that supervised matrices decrease by 22.7 (resp. 15.9) percentage points the percentage of quantified (resp. descriptive) empty cells. For both naive and manual selection, we obtained no boolean empty cells. Considering a supervised manner, our approach increases by around 3 per-centage points the perper-centage of quantified features, with 2.2 less empty cells per feature in average. Supervised matrices have almost the same percentage of descriptive features as random matrices (15.6% in average) but with 1.6 less empty cells per feature in average. Similarly, supervised scoping enhances the homogeneity of the specification PCMs. The percentage of empty cells declines by 11.1 percentage points. Specifically, supervised PCMs reduce the percentage of quantified (resp. descriptive) empty cells by 11.4 (resp. 10.1) percentage points. In the same time, the supervised selection increases by
2 percentage points the percentage of quantified features and around one percentage point the percentage of descriptive features.
Key findings for RQ1.1 and RQ1.2.
- Our approach is capable of extracting numerous quantitative and compa-rable information (12.5% of quantified features and 15.6% of descriptive features).
- A supervised scoping of the input products reduces the complexity (in average 107.9 of features and 1079.7 of cells) and increases the homogene-ity and the compactness of the synthesized PCMs (only 13% of empty cells).
- An open issued made apparent with RQ1.1 and RQ1.2 is that the size of PCMs can be important while PCMs, being from overviews or technical specifications, can be incomplete. It motivates the next research question RQ1.3. on the complementarity of both PCMs.
8.4. RQ1.3. Is there an overlap between synthesized PCMs and technical speci-fications?
Motivation of the study. The purpose of RQ1.3 is to analyze the
relation-ship and possible overlaps between generated PCMs (coming from the textual overviews) and specification PCMs. In case generated PCMs can be made more complete with the technical specifications (or vice-versa), it can (1) increase the quality of PCMs (e.g., empty cells are replaced by actual values) (2) reduce the user effort in case an information is missing or unclear (he or she can refer to the other source of information).
Experimental Setup. To address RQ1.3, we compared the features and the
cell values for the same set of products in both overview and specification PCMs using the following metrics:
• % Correct features in the overview matrices comparing to the specifica-tion matrices (Features Over in Spec): we consider that a feature in an
overview PCM is correct, if it is similar to another feature in the specification PCM.
• % Correct features in the specification matrices comparing to the overview matrices (Features Spec in Over): we follow the same principle described above.
• % Correct cell values in the overview matrices comparing to the specifica-tion matrices (Cells Over in Spec): for a given product and two similar features in the overview PCM and the specification PCM, we consider that the cell value in the overview PCM is correct if it is similar to the cell value in the the specification PCM.
• % Correct cell values in the specification matrices comparing to the overview matrices (Cells Spec in Over): we apply the same principle as Cells Over in Spec.
Two features are similar if at least one of them occurs in the other. Now, for two similar features and a given product, two cell values are similar if at least one of them contains the other. Figure 9 illustrates the overlap between overview PCMs and specification PCMs.
The experimental results are as follows.
Features Overlap. Overview matrices cover approximately half of the
fea-tures in the specification matrices (49.7% in average, 51.0% for median). However, these latters cover only 20.4% of features in the overview matrices (20.6% for median).
Cells Overlap. Overview matrices cover 26.2% of cell values in the
specifi-cation PCMs (in average, 26.3% for median), while these latters cover only 8.6% of cell values in the overview PCMs (8.5% for median).
The results provide evidence that, with our automated extraction from overviews, there is also a potential to complement technical specifications of products. Another interesting point is that the user can rely on the overlapping features between specifications and overviews to prioritize features and then keep the most relevant ones, in order to reduce the complexity of the overview PCM.
Figure 9: Complementarity of Overview PCMs and Specification PCMs (RQ1.3)
Key findings for RQ1.3.
– A significant portion of features (49.7%) and cell values (26.2%) is recovered in the technical specifications.
– The proportion of overlap of overview PCMs regarding specification PCMs is significantly greater than the overlap of the latter regarding overview ma-trices. This is explained by the fact that the natural language is richer, more refined and more descriptive compared to a list of technical specifications. – Overall, users can benefit from an interesting overlap. They can reduce the complexity of the PCMs by only focusing on overlapping features’ names and values. They can also complete missing cell values or even refine some information of PCMs. It motivates the next "user study".
9. User Study
Our previous study does not evaluate the quality of the information in the synthesized PCMs. For example, we ignore how correct are features’ names and values in the synthesized PCMs coming from informal and textual overviews (see RQ2.1 below). We also want to further understand the relationship between
technical specifications and our synthesized PCMs (see RQ2.2 below). Such in-vestigation necessitates a more qualitative judgment and an human assessment; we have involved some participants to review information of our synthesized PCMs using MatrixMiner traceabilities.
9.1. Experiment Settings
Dataset: We considered the same set of supervised overview PCMs used
earlier in the empirical study: the dataset SD1.2 (169 PCMs in the total). These PCMs cover a very large spectrum of domains (Printers, Cell phones, Digital SLR Cameras, Dishwashers, Laptops, Ranges, Refrigerators, TVs, Washing Machines, etc.). These PCMs are made from various sizes, going from 47 to 214 columns (features), and 10 rows (products).
Participants: The PCMs were evaluated separately by 20 persons, each
using their own computers. Participants were computer science researchers and engineers at Inria (France). They have strong background in software engineering. They were not aware of our work.
Evaluation Sessions: We organized one evaluation session in which we
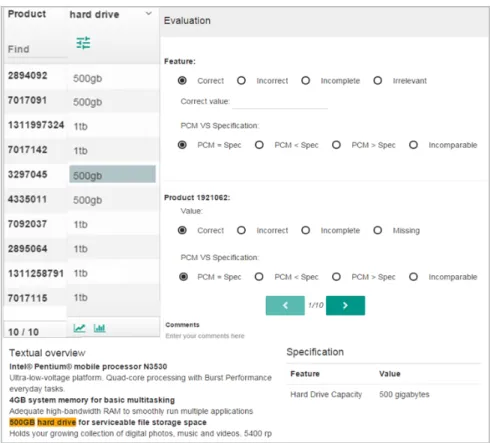
explain the goal of the experiment to the evaluators. We provided a tutorial describing the tool they would have to use, as well as the concepts they were about to evaluate and related illustrative examples. We displayed randomly one column at a time (from any PCM) and the evaluator has to attribute scores for the feature and cell values. The evaluation session took one hour in total.
The evaluators have to validate features and cell values in the PCM against the information contained in the original text. To this end, the tool provides ways to visualize the PCM with a traceability with original product descrip-tions. For each cell value, the corresponding product overview is depicted with the highlight of the feature name and the value in the text.
1. Looking at the feature, the evaluators have to state whether the feature is correct, incorrect, incomplete or irrelevant.
2. Looking at each cell value, the evaluators have to state whether the expected cell value is correct, incorrect, incomplete or missing.
The evaluators can propose a correction of incorrect, incomplete or missing information.
Figure 10: Overview of the environment during PCMs evaluation (by column)
It should be noted that we did not ask to participants to determine whether some features have been missed by our extraction. There may be features in the textual descriptions but not present in the extracted PCMs. Identifying such missing features would require a complete review of the text from a domain expert and is labor-intensive.
To keep the amount of manual effort reasonable, we therefore only accounted for end-user validation of the extracted features.
Furthermore the evaluators had to specify for each column whether the PCM contains more/less refined information (features and cell values) than in the specification:
– PCM = Spec: the PCM and the specification contain the same
infor-mation.
– PCM > Spec: the PCM contains more information comparing to the
specification.
– PCM < Spec: the PCM contains less information comparing to the
specification.
– incomparable: the information in the PCM and the specification do not
match.
The tool offers ways to visualize the PCM with a traceability with the spec-ification. For each cell value, the corresponding specification is depicted including the feature name and the cell value. The evaluators can add a comment at the end of the evaluation of each column.
Evaluation Scenario: Participants performed the evaluation as follows.
We displayed one column at a time (see Figure10and the column hard drive). The evaluators have to validate the feature and cell values. They can either refer to the original text (Figure 10 shows how we highlight both feature names and values) or to the technical specification. Once the evaluation of one column is finished, the evaluator submits his/her evaluation and starts again a new evaluation for a new column.
Evaluation Outputs: We obtained 118 evaluated features and 1203
eval-uated cell values during an evaluation session of one hour. Overall, 50% of evaluated features belong to ranges, 24.57% come from laptops, 16.10% are related to printers, and 9.32% correspond to features of refrigerators, TV and washing machines. On the other hand, 45.95% of evaluated cell values
are about ranges, 22.61% are contained in laptops PCMs, 16.90% of values belong to printers and 14.52% are related to refrigerators, TV and washing machines.
Figure 11: Quality of Features and Cell Values
9.2. RQ2.1. How do users perceive the information of synthesized PCMs when confronted to the original, textual overviews?
Motivation of the study. In Figure 10, the feature hard drive and its 10 cell
values make sense. However our extraction procedure can sometimes introduce errors in the PCMs: features’ names or cell values may be incorrect or irrelevant. In this study, we aim to qualitatively confront the information in the synthesized
PCM with the original text. As there is no automated oracle, we rely on humans judgements to assess it. Thanks to users we can, for instance, compute the percentage of correct features and cell values.
This study aims to provide some insights on the quality of our extraction procedure. Another motivation of this study is to investigate how MatrixMiner traceability mechanisms can help users in reviewing and controlling the infor-mation – we only highlight some elements in the texts and avoid a reading of the entire text.
Experimental resultsare reported in Figure11and show that our automatic
approach retrieves 43% of correct features and 68% of correct cell values in one step and without any user intervention, showing the usefulness of our approach. We also note that 10% of features and 9% of cell values are incomplete which means that are correct but are not enough precise. This means that we are very close to the right values. Using the traceability with the original text, users can easily retrieve the full information and complete the PCM.
Only 20% of features and 21% of cell values are incorrect with 2% of these latters are missing. In the same time, we observe that 27% of features extracted automatically are irrelevant (one cannot objectively know the preferred features for a user). Again, the results provide evidence that the role of the user remains crucial. Indeed, the user is able to correct or complete the information in the PCM thanks to the traceability with the original product descriptions and the specifications. Also, he/she can remove the features which he/she consider irrelevant.
9.3. RQ2.2. How do users perceive the overlap between synthesized PCMs and technical specifications?
Motivation of the study. Thanks to MatrixMiner and basic matching
tech-niques, we can relate information in the synthesized PCMs with technical speci-fications. Previous sections (see RQ1.1, RQ1.2 and RQ1.3) suggest some poten-tial, but we ignore the exact relationship: Is it a refinement? Is it a new infor-mation? Here, we gather insights on the overlap between the synthesized PCM (overviews) and the technical specifications. We investigate how our synthesized