Titre:
Title:
Virtual CPU state detection and execution flow analysis by host
tracing
Auteurs:
Authors
: Hani Nemati et Michel R. Dagenais
Date: 2016
Type:
Communication de conférence / Conference or workshop itemRéférence:
Citation
:
Nemati, H. & Dagenais, M. R. (2016, octobre). Virtual CPU state detection and execution flow analysis by host tracing. Communication écrite présentée à IEEE International Conferences on Big Data and Cloud Computing, Social Computing and Networking, Sustainable Computing and Communications (BDCloud 2016) (SocialCom 2016) (SustainCom 2016), Atlanta, GA, USA (9 pages).
doi:10.1109/bdcloud-socialcom-sustaincom.2016.13
Document en libre accès dans PolyPublie
Open Access document in PolyPublie URL de PolyPublie:
PolyPublie URL: https://publications.polymtl.ca/2991/
Version: Version finale avant publication / Accepted versionRévisé par les pairs / Refereed Conditions d’utilisation:
Terms of Use: Tous droits réservés / All rights reserved
Document publié chez l’éditeur officiel
Document issued by the official publisher
Nom de la conférence:
Conference Name:
IEEE International Conferences on Big Data and Cloud Computing, Social Computing and Networking, Sustainable Computing and Communications (BDCloud 2016) (SocialCom 2016) (SustainCom 2016)
Date et lieu:
Date and Location: 2016-10-08 - 2016-10-10, Atlanta, GA, USA
Maison d’édition:
Publisher: IEEE
URL officiel:
Official URL: https://doi.org/10.1109/bdcloud-socialcom-sustaincom.2016.13
Mention légale:
Legal notice:
© 2016 IEEE. Personal use of this material is permitted. Permission from IEEE must be obtained for all other uses, in any current or future media, including
reprinting/republishing this material for advertising or promotional purposes, creating new collective works, for resale or redistribution to servers or lists, or reuse of any copyrighted component of this work in other works.
Ce fichier a été téléchargé à partir de PolyPublie, le dépôt institutionnel de Polytechnique Montréal
This file has been downloaded from PolyPublie, the institutional repository of Polytechnique Montréal
Virtual CPU State Detection and Execution Flow
Analysis by Host Tracing
Hani Nemati
Department of Computer and Software Engineering, Polytechnique Montreal, Quebec, Canada
Email: [email protected]
Michel R. Dagenais
Department of Computer and Software Engineering, Polytechnique Montreal, Quebec, Canada
Email: [email protected]
Abstract—Cloud computing offers to the end user the ability of accessing a pool of resources with the Pay as Use (PaU) model. By leveraging this technology, users can benefit from hardware virtualization for on-demand resource acquisition and rapid elasticity. However, there is no effective tool to analyze virtual hardware performance, especially when isolation between these virtual resources is not adequate. The existing tools need to access and trace the whole activity of the VM and host. However, in most cases, tracing the virtual machine (VM) is not possible because of security issues and the added overhead. Therefore, there is a need for a tool to troubleshoot unexpected behavior of VMs without internal access for tracing or debugging.
In this paper, we propose a new method to study the state of CPUs inside VMs without internal access. Our tool can detect unexpected delays and their root causes. We developed a virtual CPU (vCPU) state analyser to detect the state of vCPUs along with the reason for being in that state. This approach relies on host tracing, thus adding less overhead to VMs as compared to existing approaches. Then we propose a new approach for profiling threads inside the VMs by host tracing. We implemented different views for the TraceCompass trace viewer to let the administrator visually track different threads and their states inside the VMs. Our tool can detect different problems such as overcommitment of resources.
Keywords—Virtualization; KVM; Performance Analysis; vCPU states; LTTng; TraceCompass
I. INTRODUCTION
Monitoring and analyzing large-scale distributed system in terms of debugging and troubleshooting is always a big challenge for infrastructure providers. This challenge becomes more considerable when cloud resources are monitored [1]. Cloud computing is a promising paradigm that comes with on-demand resource acquisition and rapid elasticity. It lets end-users quickly scale their resources from a pool of shared resources. Sharing resources plays an important role in uti-lizing resources and reducing operational costs. Moreover, the most important motivation of infrastructure providers is maximizing profit by leveraging their resources for delivering service to thousands of cloud users [2]. Despite its merits, cloud users may experience performance degradation, due to resource sharing and interference between virtual machines. Interference between VMs shows itself as latency in response time of programs inside VMs. As we saw in our experiments, execution time for identical tasks varies when VMs are com-peting for the same resources. Diagnosis of this kind of latency by analysing the guest is always complex. The reason being that the VM does not have access to its external environment and also has the illusion of exclusive usage of whole resources. OpenStack [3] is an open source project which acts as infrastructure Provider (IP). It aims to provide control and
management APIs for virtual resources. It lets the infrastruc-ture administrator create and manage virtual instances. It is made up of many components namely Nova for computing, Neutron as network management component, and Ceilometer as monitoring tool. Ceilometer is a basic metering, monitoring and alarming tool in the Openstack. In term of CPU metrics, it has physical CPU time usage, average physical CPU utilization and number of vCPU allocated to each instance[4]. Although the metrics that Ceilometer collects are sufficient for billing, they are not enough for assuring QoS and troubleshooting in virtual machines. For example, Netflix could suffer from CPU steal time when they use the Amazon Web Service (AWS) as partner for services and delivery of content [5]. Therefore, there is an absolute need for a low-overhead tool to investigate the root cause of unexpected latency in virtual environments. The tool should be transparent to the guest operating system and should not add overhead to VMs.
This paper focuses on studying virtualization of CPUs for different VMs. In particular, we developed a vCPU state detection that can automatically investigate the root cause of latency in the VM by host tracing. Massive amount of information about the program executing in the VM is hidden in the vCPU thread in the host. Our tool can inspect the buried information in the vCPU thread and convert it to meaningful knowledge about the thread running on the vCPU. Our approach can find out the performance jitter and its root cause, which is crucial for real time applications. Moreover, it can examine vCPU preemption, as indicator of over-sold VMs in an infrastructure to maintain QoS at an acceptance level of service. It can detect frequent exit reasons which could be an indicator of problems inside the VM and convert them to essential information about the VM. It also lets the infrastructure administrator detect under-performing hosts and carry out better capacity planning for CPU over-shared hosts. Furthermore, we propose an approach to discover the threads inside the VMs when they are executing on a vCPU. This technique employs a VM thread execution flow. From our graphical view, all the activities of the thread inside the VM, like I/O operation, CPU usage, and Memory operation can be uncovered. It also can be used as low-overhead thread profiler inside the VM, without tracing the VM.
Our main contributions in this paper are: First, we propose a fine-grained vCPU state analysis based on host tracing. All the tracing and analysis phase is transparent to the VMs. Therefore, there is no need for internal access within VMs, which is not allowed in most situations because of security reasons. Secondly, we propose a method to build the execution flow of the threads inside the VM without tracing the VM. Thirdly, we implemented three graphical views as follows:
first, a graphical view for vCPU threads from the host point of view. It represents vCPU threads along with other threads inside the host. Secondly, we built a graphical view for the CPUs inside the VM. Thirdly, we present a graphical view for the running threads inside the VM, with their name, PID and parent PID. The rest of this paper is organized as follows: Section II presents a summary of other existing approaches in troubleshooting VMs, and identifies the technique closest to our approach. Section III introduces different vCPU states and their requirements. We also present the algorithm used to retrieve information from vCPU threads. In section IV, we explained the different layers of the architecture that we use in our paper. We also describe the tracer that we used to gather meaningful information about the VMs. We show some use cases of our analysis in section V and section VI. The added overhead with our approach is compared with existing approaches in section VII. In section VIII we propose and implement a new approach for thread analysis inside the VMs without tracing the guest OS. IX concludes the paper.
II. RELATEDWORK
Several performance monitoring tools for virtual machines have been enhanced for practical use. Most of them like Cloud-Watch [6] are closed-source and the information about how they monitor virtual hardware is a secret. In this section we summarize most of the practical tools available for monitoring VMs with their advantages and drawbacks.
Novakovic et al. [7] used some of the performance counters and Linux tools like iostat [8] for monitoring disk. Although, the metrics obtained present a general idea about resource us-age of VMs, this information could not be used to pinpoint the root cause of latency in a VM. Also, most Linux tools such as iostate [8] and vmstat [9] gather statistics by reading proc files with significant overhead. Therefore, it is not recommended to exploit these for implementing a low-overhead monitoring system. PerfCompass [10] is a fault anomaly detection tool for internal and external faults. Internal faults have local impact and external faults have global impact on the system. It also counts the most frequent system calls in the system, to inform cloud administrators about the cause of problems. Furthermore, they used other anomaly detection tools to trigger PerfCompass. PerfCompass can then detect the problem and report it to the admin. To implement it, they trace VMs with LTTng to count and profile the program inside the VM. As a result, they significantly increase the overhead on the VMs due to tracing all system calls and threads activity.
In [11],[12], they implemented guest-wide and host-wide profiling, which uses Linux perf to sample the Linux kernel running in KVM. It allows profiling of applications inside the guest by sampling the program counter (PC) from perf. After PCs are retrieved from perf, they map them to the binary translated code of the guest to find out the running time for each function inside the VMs. To have a more precise profiler, the sampling rate should be increased, which causes more overhead to the VMs. Khandual et al. in [13] presents Linux perf based virtualization performance monitoring for KVM. They benefit from counting the occurrence of different events in the guest to detect anomalies. In their work, they need to access each VM, which is not possible most of the time because of security issues and overhead. While increments to values of some event counters could be an indicator of problem
in the guest, it cannot show the exact problem and the time. In [14], the authors implemented a CPU usage monitoring tool for kernel-based virtual machine (KVM) relying on ”perf kvm record”. By profiling all CPUs, they could monitor CPU usage of VMs and the total CPU usage of the hypervisor. In their work, they needed to profile the guest kernel and host kernel at the same time. They were capable of finding the overhead introduced by virtualization for VMs as a whole, but they cannot measure it for each VM separately. Wang in [15] introduced VMon, monitoring virtual machine interference by using perf. From all the available CPU metrics, they used the last level cache (LLC) as indicator of over commitment of CPU. They showed that LLC has a direct relationship with performance degradation. LLC could be an indicator of CPU overcommitment for CPU intensive workloads, but the result will be different when memory intensive tasks are running in the VM.
The work closest to ours, which motivated the research presented in this paper, is presented in [16]. They propose a method to retrieve the preemption state for vCPUs by using traces from the host kernel and each VM. They are able to study the root cause of preemption, whether it is a VM or a host thread. To implement it, after tracing the host and all guests, they synchronize each VM with host timestamps. Then, they build a control flow of each thread inside the host and each VMs separately. Moreover, they propose a method to search through all threads in the VMs and host and find preemption states. Synchronization, building control flow of each thread, and finding the preemption state through searching all threads, are time consuming. This therefore adds more overhead to VMs. While comparing this work with ours, we observed that this approach of tracing VMs adds at least 6% overhead to each VM. Moreover, tracing the VMs is not allowed all the time. Thus, their method could not retrieve the vCPU state when access to VMs is restricted. In our work, we do not trace VMs, so there is no need for synchronization. We examine different states of vCPUs on the fly, when the control flow of threads for the host is building. As a result, our work adds less overhead to VMs and needs less time to build the state of vCPUs. Moreover, our work is totally independent from the guest operating system (OS) and can identify the root cause of latency for any VM with any OS.
III. CPU STATESFORVIRTUALMACHINES Hardware-assisted virtualization (Intel-VT and AMD-V) is an important milestone in the virtualization technology. In comparison to other virtualization technologies (e.g, para-virtualization and full-para-virtualization), hardware-assisted virtu-alization reduces the overhead of managing privileged in-structions at the host level by executing non-privilaged VM code directly on the physical CPU. In addition, it provides faster switching between Virtual Machine Monitors (VMM) and guest OSs, better management of memory, and assigning host I/O devices to VMs securely.
VMM, known as Hypervisor, acts as host and is the primary software in virtual technology. It has the selective control of host resources and is layered between the virtual machine and hardware. It lets the virtual machines run their code directly on physical CPUs and control the processor and other resources (e.g., Memory and I/O) in the host machine. On the other end, guest software consists of the virtual machine OS and
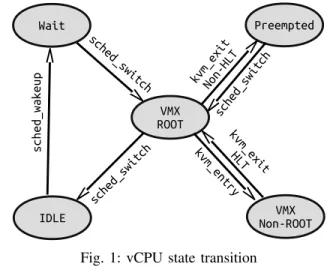
the applications running on top of its OS. Guest software has the illusion of controlling the entire system, but its access to privileged operations is being reduced and is given to VMM. Intel processors (and similarly AMD processors) support two operational modes for running VMM code and guest software code, named VMX root mode and VMX Non-ROOT mode, respectively. Guest software executes as vCPU in VMX Non-ROOT mode, under the authority of the VMM which operates in VMX root mode. In general, the vCPU could be in one of ROOT, Non-ROOT, PREEMPTED, WAITING, and IDLE states. Figure 1 shows different states and the conditions to reach those states. In both ROOT and Non-ROOT states, the vCPU is in running mode. In contrast, in the PREEMPTED, WAITING, and IDLE states, the vCPU is not executing any code. The PREEMPTED state is when the vCPU is being scheduled out by the host CPU scheduler without notifying the guest OS. The IDLE state is when the vCPU is being scheduled out voluntarily by sending the HLT signal from the guest OS. In the WAITING state, the vCPU thread is waiting for the physical CPU for being free to schedule in. The completion time of a task (the time when a task is submitted until it is finished) inside a VM can increase when the vCPU assigned to the task is in the PREEMPTED or WAITING states. It deteriorates further when the PREEMPTED state is not visible inside the VM and it could introduce delays through increasing execution duration for the task. In the following subsection, we describe each state in details.
Fig. 1: vCPU state transition A. VMX ROOT and Non-ROOT State
A running vCPU operates in two states, named root and non-root states. In the non-root state, the VM’s OS can execute most privileged instructions but some of them are restricted and should be executed in root state. In general, VMM code executes in root state and guest software executes in non-root state. For example, in Linux using KVM-QEMU virtual machine, the KVM code runs in root state and the Qemu codes runs in non-root state. Executing some privileged commands like VMCLEAR forces the vCPU to exit from non-root state and operates in root state. The transition between these two states for a vCPU is called VMX transition.
In each VMX transition, some information about the guest software and VMM is stored in the virtual machine control data structure (VMCSs) to manage transitions into and out of VMX non-root. Regularly, the VMM uses separate VMCS for each vCPU. VM-exit information field in the VMCS shows
the reason for exiting from non-root mode. Some important vm-exit reasons are external interrupt, internal interrupt, EPT violation, hlt, and task switch. In the KVM module, each tran-sition between root mode and non-root mode is instrumented with kvm entry and kvm exit (We elaborate more in section IV). In the transition from VMM to guest software, the state of the guest software is retrieved from the VMCS and the state of the VMM is stored into the VMCS. When the transition is completed, the kvm entry event occurs. while transiting from guest software to the VMM, the state of the guest software is stored in the VMCS and the state of the VMM is retrieved from the VMCS. As a result, there is an event named as kvm exit with a field that shows the reason for exiting. This field could be used in order to find other states. To summarize, when a vCPU thread is scheduled in, it enters the root state until the kvm entry event happens. Then, it transitions between non-root state and non-root state with each kvm exit and kvm entry. B. IDLE State
The IDLE state indicates that a vCPU is scheduled out because it did not have any code to execute. When a task inside the VM is finished or the task is waiting for other resources, a VM exit identifying the exit reason of HLT occurs. In this case the state of VM is stored in the VMCS and the host CPU scheduler chooses another thread ready to run on the physical CPU. In Linux, there is a static trace point for sched switch which shows when a thread is scheduled out and another thread is scheduled in. If and only if a vCPU is scheduled out with exit reason of HLT, it goes to IDLE state.
C. PREEMPTED State
This state represents the vCPU executing some code but the host CPU scheduler scheduled out the vCPU thread from the physical CPU. In a cooperative multitasking system, in order to let other processes get the same amount of CPU time, the CPU scheduler schedules out the thread after its time slice is expired. Normally, when a vCPU thread is preempted inside the host, it does not inform the guest software. As a result, the completion time of a task inside the VM increases. In Linux, the scheduler runs every ’time slice’ to choose other potential threads that are ready to run. Although the sched switch event provides some information about the scheduled out thread and the scheduled in thread, it is not an indicator of if the vCPU is in the preempted mode or idle mode. As we mentioned above, if the vCPU is not executing any code, it executes the privileged HLT instruction, causing a transition to the VMM mode. In this case, the vCPU thread voluntarily yields the physical CPU. Otherwise, when not halting, it indicates that the vCPU is running code but its time slice is expired. Thus, the host CPU scheduler decided to schedule out this thread to let other ready processes run their code.
D. WAIT State
The WAIT state demonstrates that the vCPU is in the running queue of the host, but it is waiting for a physical CPU. This also adds latency to the execution of a vCPU. The WAIT state mostly happens when there is not enough physical CPUs, so each vCPU should wait at some point to be scheduled in. In Linux, sched wakeup shows that a thread has waken up and is waiting for a physical CPU. The duration of that interval, from the time the vCPU thread wakes up until when the vCPU is scheduled on a physical CPU, is labeled as the WAIT state.
It also introduces delays throughout increasing the completion time of a task inside a VM.
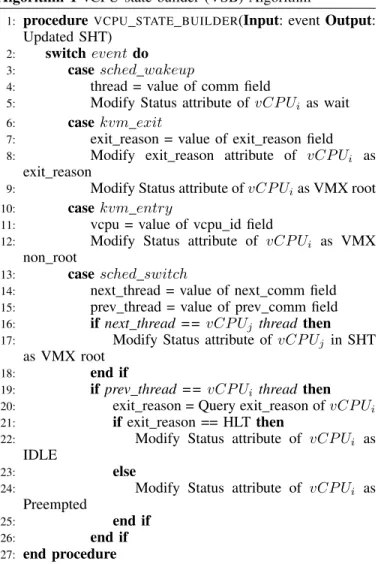
E. Virtual CPU State Building (VSB) Algorithm
Algorithm 1 vCPU state builder (VSB) Algorithm
1: procedureVCPU STATE BUILDER(Input: event Output: Updated SHT)
2: switch event do 3: case sched wakeup
4: thread = value of comm field
5: Modify Status attribute of vCP Ui as wait
6: case kvm exit
7: exit reason = value of exit reason field 8: Modify exit reason attribute of vCP Ui as
exit reason
9: Modify Status attribute of vCP Uias VMX root
10: case kvm entry
11: vcpu = value of vcpu id field
12: Modify Status attribute of vCP Ui as VMX
non root
13: case sched switch
14: next thread = value of next comm field 15: prev thread = value of prev comm field 16: if next thread == vCP Uj thread then
17: Modify Status attribute of vCP Uj in SHT
as VMX root
18: end if
19: if prev thread == vCP Ui thread then
20: exit reason = Query exit reason of vCP Ui
21: if exit reason == HLT then
22: Modify Status attribute of vCP Ui as
IDLE
23: else
24: Modify Status attribute of vCP Ui as
Preempted
25: end if
26: end if
27: end procedure
Each virtual CPU could be in a different state, namely VMX root, VMX non-root,idle, preempted and wait. Among the aforementioned states, wait, preempted and VMX root affect the completion time of the task that is running on a virtual CPU. Finding these states for a virtual CPU could help us to diagnose the execution latency inside a virtual machine. In order to build the vCPU state, we use some kernel tracepoints from LTTng as follows.
The most important tracepoint in our analysis is sched switch. It represents which thread is scheduled in and which one is scheduled out from a physical CPU (pCPU). By looking at next thread and former thread fields in the payload of sched switch, we can ascertain the duration of a vCPU and whether it is in the running or IDLE state. In case no process runs on a vCPU, it yields the vCPU thread and lets the scheduler execute other processes on the pCPU. In case a process runs on a vCPU for a long time, the scheduler could schedule out the vCPU thread and schedule in other threads. By looking at the intervals of running vCPUs on physical CPUs, the total CPU usage of each virtual machine can be determined. The kvm entry and kvm exit events are
the two other important tracepoints in our analysis. These two tracepoints depict the interval for which a vCPU is running in VMX root or VMX non root state. A useful payload field in the kvm entry event is vcpu id, showing the id of the running vCPU inside the VM. Another useful payload field is exit reason in the kvm exit event. The exit reason field introduces the reason for a transition from VMX non root to VMX root.
The pseudocode for our algorithm to uncover different states for vCPUs is depicted in Algorithm 1. The vCPU state builder (VSB) algorithm receives an event as input and updates the SHT as output (Line 1). In case the event is sched wakeup, the state of the vCPU in the SHT is modified to wait state (Line 3-5). When the VSB algorithm receives the kvm exit event, it first modifies the exit reason attribute of the vCPU in the SHT (Line 8) and then changes the status of the vCPU as VMX root state (Line 9). When receiving a kvm entry event, the state of the vCPU is adjusted to VMX non root state (Line 12). The most important event, sched switch, shows when a vCPU is running on a pCPU. When a vCPU is scheduled in, it goes to VMX root state (Line 17) to load the previous state of the virtual machine from the VMCS. In contrast, when a vCPU is scheduled out, it goes to either the idle state or the preempted state. In order to distinguish between these two states, the VSB algorithm queries the last exit reason of the vCPU. If the last exit reason is HLT, which means that the VM runs the idle thread, the state will be modified as idle (Line 22). In other cases of exit reason, it will be changed as preemption state (Line 24). We implemented the proposed algorithm in TraceCompass [17] as new graphical view for vCPU threads inside the host, and vCPUs inside the VM. In the next section, we present the results of some tests for two use cases.
IV. ARCHITECTURE
We use Openstack as an API for controlling the virtual resources. Although the Openstack compute component can be run on a variety of hypervisors, KVM is the most used hypervisor for openstack [18]. We also use KVM as kernel hypervisor or VMM for our analysis. KVM is a linux module that acts as kernel hypervisor and lets a userspace program use the hardware virtualization features. Therefore, to have a VM on top of KVM, we needs a userspace program. We use Qemu as the userspace part of the hypervisor, so that the operating system of each VM could be run on Qemu. Our architecture is shown in Figure 2. Other components are explained below.
Fig. 2: Architecture of our implementation
A. Tracer
In order to analyse the behavior of each VM and find out the vCPU status, we use a lightweight tracing tool called the
TABLE I: Experimental Environment of Host and Guest
Host Environment
CPU Intel(R) i7-4790 CPU @ 3.60GHz Memory Kingston DDR3-1600 MHz, 32GB Operating System Ubuntu 15.10 (Kernel 4.2.0-27) Qemu Version 2.5
LTTng Version 2.8 Guest Environment
vCPU One vCPU- Haswell Model Memory 2GB
Operating System Ubuntu 15.10 (Kernel 4.2.0-27)
Linux Trace Toolkit Next Generation(LTTng)[19]. LTTng is implemented for high throughput tracing and includes lttng-module for linux kernel tracing and lttng-ust for userspace tracing, with minimal overhead. Therefore, it is suitable for our experiment since we want a low impact on VMs. The host kernel and KVM module are instrumented by different static tracepoints. When the events are generated, LTTng gathers and sends them to the trace analyser. We explain the main tasks of the trace analyser in the next section.
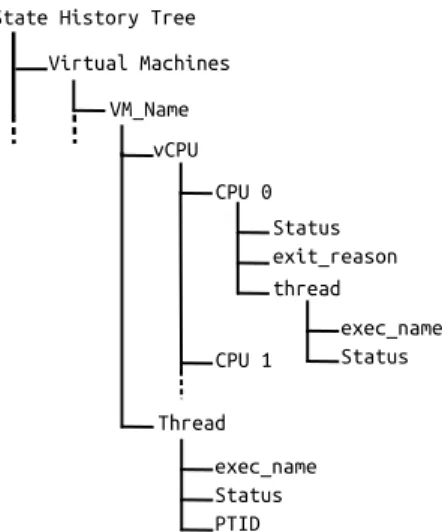
Fig. 3: State History Tree used to store different information of virtual machines
B. Trace Analyser
In our architecture, the trace analyser receives the events from the tracer and stores useful information about the VMs in a state history tree (SHT). We implemented our trace analyser in TraceCompass [17]. TraceCompass is an open source software for analysing traces and logs. It has some pre-built views, especially for LTTng. The SHT is tree shaped disk database of logical nodes to store data in TraceCompass. This data can represent the state of various components in the traced system as integer, long integer or string values associated with a time interval. The data is first stored in memory and later committed to disk. The access time to this data, even on disk, is fast and logarithmic[20]. The structure of the SHT used for our analysis is depicted in Figure 3. This SHT can store all the necessary information about vCPUs. Each VM has different vCPUs, named by their CPU ID. The vCPUs can be in different states, and different threads could be executing
on them. When the event comes from the tracer, meaningful information is extracted and stored in the SHT. Once the SHT is constructed, we can browse through the state, retrieving the stored information, by querying the SHT. To query one of the SHT attributes, the path representing the resource of interest (e.g., vm name/vCPU/CPU 0/exit reason) is needed.
V. USECASES- PREEMPTIVEVIRTUALMACHINES In this section we show how detecting the status of vCPUs could help us to find out the cause of latency in the virtual machine. Our experimental environment is described in Table I. The Qemu version is 2.5 and the KVM module is based on Linux kernel 4.2.0-27. We use sysbench which is a benchmark suite for analysing different system resources. For the CPU performance analysis of virtual machines, we set sysbench to run 30 times to check how many prime numbers are in first 10000 numbers. After each execution, it waits for 200ms and redoes the task. We start a virtual machine (VM1) with one CPU and pinned it’s vCPU0 to pCPU0. We execute sysbench in the virtual machine and then we trace the virtual machine with LTTng. Figure 4 shows the result of execution latency. As shown, the execution time is almost the same for each run and the average is 324ms, with standard deviation of 5ms. As we expect, the execution time for same workload should be almost the same.
For the next evaluation, we start another virtual machine (VM2) and pined its vCPU0 to pCPU0. We configured sys-bench similarly to the previous experiment with VM1, except that we set it to wait for 800ms after each execution. We run Sysbench for both VMs at the same time and trace VM1. Figure 5 shows the execution time of the Sysbench thread for each run inside the VM. As we see, the execution time for the same task is sometimes different and the VM has the illusion of running the Sysbench thread all the time. In this analysis, the average execution time is 443ms, compared to 324ms in the previous test. Even more surprising, the standard deviation for running 30 times the same task is 116ms. We found the cause of the variation in the execution time for the same workload by looking at the vCPU threads, which are Qemu threads inside the host. We find out during this test that the two VMs were preempting each other several times. Figure 6 depicts the flow view of vCPU threads for two virtual machines. The Running state (Green color) in this figure is when VM is either in VMX root mode or non-root mode. The Preemted State (Purple color) is when the vCPU thread is preempted inside the host. The IDLE state for a vCPU is shown as Blocked State (Yellow color) in the control flow view. Also, for a clearer picture, we zoom in the time slice where two virtual machines were preempting each other. A vCPU thread is scheduled in for a short time slice, then the scheduler, without notifying VM1, schedules it out and give the pCPU0 to another task which is VM2’s vCPU.
There is a trade-off between CPU utilization and preemp-tion. As CPU utilization increases, more preemption occurs. IaaS providers wish to increase resources utilization to gain profit, while maintaining a high QoS to stay in the business. Overcommitment of CPUs may cause serious latencies for VMs. Therefore, preemption can be one of the most important factor in the service level agreement (SLA) between the VM user and the Cloud provider. Using our analysis, the cloud
Fig. 4: Execution time of the prime thread (vCPU view) when only one virtual machine is running on pCPU0
Fig. 5: Execution time of the prime thread (vCPU view) when two virtual machines are running on pCPU0
Fig. 6: Control flow view of vCPU threads from two different virtual machines in the Host - Preemption provider could find out when preemption occurs and which
VM is preempting others more.
VI. USECASES- FREQUENTTRANSITION
EPT violation is another vm exit reason that changes the state of vCPU from VMX non root to root. It occurs when a VM attempts to access a page that is not allowed by the EPT paging structure, known as a KVM page fault. IaaS providers overcommit virtual resources to utilize them as much as possible and use fewer servers. However, sometimes overcommitting virtual resources saturates the resources and causes some problem for VMs. In this section, we represent how overcommitting the memory could increase the latency in virtual machines. Figure 7 depicts how a vCPU of VM1 is transiting from VMX root and non root frequenty. It executed VM code for a small period, then it was forced to exit to VMX root state. In order to find out frequent exit reasons, we wrote an analysis that could find out more frequent exit reasons and the associated execution duration. This analysis can help us to guess the behavior of the thread running in the VM and uncover any undue latency. We wrote a C program that writes random numbers into 1GB of memory, named eat mem. This program executes frequently in VM1, VM2, and VM3. We also wrote another program that executes a small CPU intensive task inside VM4 and VM5 randomly. Furthermore, in order to overcommit the memory, we modified the eat mem program to use 25 GB of RAM in the host. The result of our experiment is found in Table II. We observed that VM1, VM2 and VM3 suffered more from overcommitting the memory since they were executing a memory intensive program. VM1, VM2, and VM3 were executing eat mem for 1.5s in average, but 15% of their time is wasted in average because of overcommitting the memory. Also, we can infer that VM1 is suffering more from memory overcommitment.
TABLE II: Execution time for different VMs when the host is suffering from Memory overcommitment
VM name Execution Time(ms) Freq EPT Violation EPT Violation Total Time(ms) Percentage(%) VM1 1329.09 3554 237.4 17.8 VM2 1834.5 18801 260.5 14.2 VM3 1332.4 15288 141.2 10.6 VM4 1169.1 0 0 0 VM5 1857.8 30 0.2 0
TABLE III: Comparison of our approach and the multi-level tracing approach [16] in term of overhead for synthetic loads
Benchmark Baseline VSB Multi-level Overhead VSB (%) Multi-level (%) File I/O (ms) 233 328 361 28.72 35.29 Memory (ms) 319 331 344 3.67 7.23 CPU (ms) 339 352 361 3.72 6.11
VII. OVERHEADANALYSIS
In this section we compare the overhead of our approach with the multi-level tracing [16] approach. Table III represents the differences in term of overhead between two ways of detecting the vCPU state. We used Sysbench benchmarks to reveal the overhead of both approaches since sysbench is configured for Memory, Disk I/O and CPU intensive evalua-tions. In order to compare the two approaches, we enabled the tracepoints that were needed for Mohamad Gebai’s multi-level tracing approach, and we trace the VM and Host at the same time. Also it is worth mentioning that our new VSB algorithm needs only to trace the host. As shown in the table, the multi-level tracing approach adds more overhead in all tests since it needs to trace the VM and the host. We have run the tests several times and the results are almost the same for each run. Our approach has negligible overhead for CPU and Memory
Fig. 7: Control flow view of vCPU thread of one VM in the Host - Frequent Transition (EPT-Violation)
intensive work at almost 3%. For I/O intensive workloads, is has 28% overhead, which is expected since LTTng is also writing the events to the same disk.
VIII. VIRTUALMACHINEDISSECTION
The process identifier (PID) and process name of each thread inside the guest is not directly accessible from host tracing. The only information which can be uncovered by host tracing about the threads inside the VMs, is written in CR3 and SP. CR3 and SP can identify the process and thread, respectively. Indeed, CR3 points to the page directory of a process in the virtual machine. All threads of a process share same the same page directory, therefore switching between two threads within the same process does not change the CR3 value. SP points to the stack of the thread inside the virtual machine. As a result, by retrieving these two identifiers, we can find out which thread is executing on a vCPU. In order to implement this, we create a new trace point, named as vcpu enter guest, for the host by using kprobe, which can retrieve CR3 and SP from the VMCS at each vm entry.
To have more information about threads inside the VMs, we need to map CR3 and SP to the PID and process name. This is not strictly necessary since CR3 and SP are unique identifiers of threads, but it is more convenient and human readable if we can map the process info inside the guest with the information we get from the vcpu enter guest trace point. We wrote a process state dump module for the guest to dump CR3, stack range, PID and process name for each thread inside the VM at the beginning of the trace and also at each thread creation. As we find out in section VII, just enabling the sched switch trace point inside the guest adds almost 3% overhead to the guest execution. We claim that our approach adds a much lower, negligible, overhead to the VM when we dump the process information once during the whole trace.
Fig. 8: Mapping retrieved CR3 and SP from guest area of VMCS to PID and Thread Name
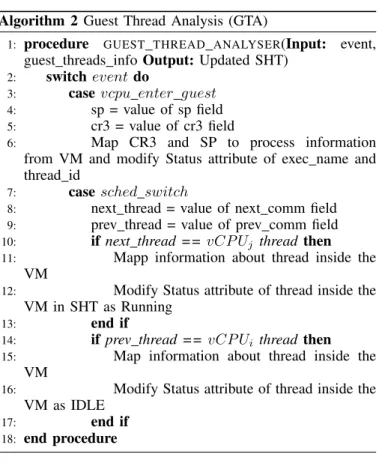
Algorithm 2 Guest Thread Analysis (GTA)
1: procedure GUEST THREAD ANALYSER(Input: event, guest threads info Output: Updated SHT)
2: switchevent do
3: casevcpu enter guest 4: sp = value of sp field 5: cr3 = value of cr3 field
6: Map CR3 and SP to process information from VM and modify Status attribute of exec name and thread id
7: casesched switch
8: next thread = value of next comm field 9: prev thread = value of prev comm field 10: if next thread == vCP Uj thread then 11: Mapp information about thread inside the
VM
12: Modify Status attribute of thread inside the VM in SHT as Running
13: end if
14: if prev thread == vCP Ui thread then 15: Map information about thread inside the
VM
16: Modify Status attribute of thread inside the VM as IDLE
17: end if
18: end procedure
Figure 8 shows the mapping procedure between informa-tion from the VMCS and guest threads. CR3 and SP are extracted from the VMCS guest area at each transition by registering a kprobe to the vcpu enter guest function. Then, within a process, they are mapped with the thread information. The output of this process is a thread name and its TID which is executing on the physical CPU. Algorithm 2 represents the guest thread analysis (GTA). It receives events and guest thread information as an input and it updates the SHT for threads inside the VM (line 1). In the case of the event being vcpu enter guest, the stack pointer and CR3 of that thread are gathered from the VMCS guest state and the process information of the VM in the SHT is updated (line 3-6). When the GTA algorithm receives a sched switch event, it updates the state of Running or IDLE (line 7-17).
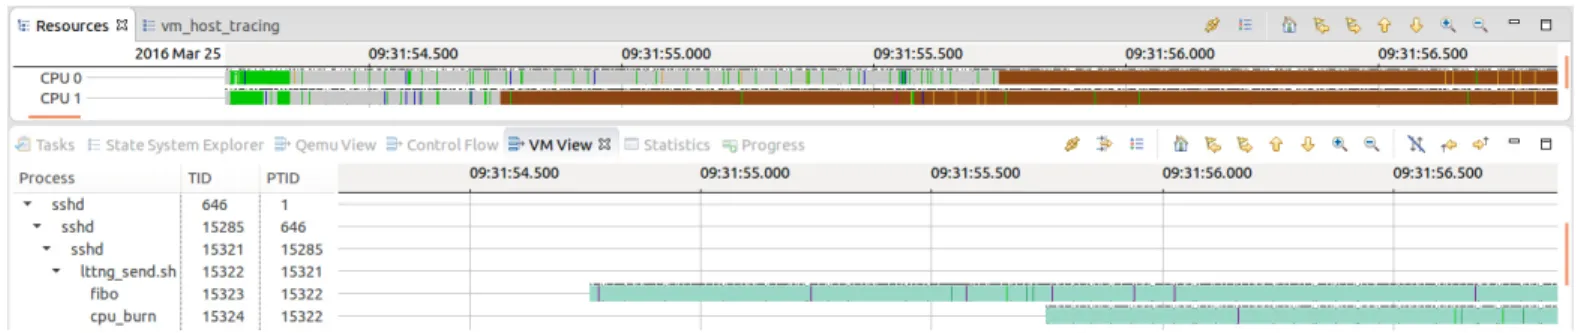
We implemented the proposed algorithm in TraceCompass as a new graphical view for threads inside the VM. To ex-amine our algorithm, we wrote two C programs that calculate fibonacci numbers in a busy loop. We named them as fibo and cpu burn. We used ssh to connect to VM. First, fibo is then run and, after 1 sec., we run the cpu burn program. Figure 9 shows the resource view of the host and the VM thread view at the same time. We see that first a vCPU thread runs on pCPU1 and, after 1 sec., another vCPU thread executes on pCPU0. When we used our algorithm, the VM view represents the
Fig. 9: Control flow view of threads inside the virtual machine
threads running on these two pCPUs at that time. We observe that the fibo program was running on pCPU1 and cpu burn was executing on pCPU0.
IX. CONCLUSION ANDFUTUREWORK
Cloud computing is pervasively used in industry, as a result of the Pay as Use model that it brings. However, current monitoring tools do not provide enough information for troubleshooting and debugging VMs. Moreover, in most cases, access to the VMs are restricted, so administrative tools on the host cannot easily provide information about the state of the VMs. Therefore, there is a need for low-overhead tools that can extract meaningful information from VMs without internal access. In this paper, we proposed a new tool for analysing the behavior of VMs inside a host. Our tool analyses the vCPU threads inside the host and examines the state of the vCPUs inside the VMs. We then showed how our tool can find different problems in the VMs along with their root cause. We also compared our approach with existing techniques and measured the overhead associated with each technique. A new method for profiling the threads inside the VM was proposed and implemented. Furthermore, we implemented several new views for VMs that can help administrators to visually track the behavior of the guests. In the future, we plan to extend our work to use hardware traces (Intel-PT). Intel-PT is a new feature in new Intel processors that lets us trace the behavior of guest OSes with very low overhead.
REFERENCES
[1] Giuseppe Aceto et al. “Cloud monitoring: A survey”. In: Computer Networks 57.9 (2013), pp. 2093–2115. [2] G. V. Prasad, A. S. Prasad, and S. Rao. “A
Combina-torial Auction Mechanism for Multiple Resource Pro-curement in Cloud Computing”. In: IEEE Transactions on Cloud Computing PP.99 (2016), pp. 1–1.
[3] Open source software for creating clouds. https://www. openstack.org/. Accessed: 2016-04-1.
[4] OpenStack telemetry measurements Metrics definition. http://docs.openstack.org/admin-guide-cloud/telemetry-measurements.html. Accessed: 2016-03-15.
[5] Netflix and Stolen Time. http://blog.sciencelogic.com/ netflix - steals - time - in - the - cloud - and - from - users / 03 / 2011. Accessed: 2016-03-29.
[6] Amazon CloudWatch. https : / / aws . amazon . com / cloudwatch/. Accessed: 2016-04-18.
[7] Dejan Novakovi´c et al. “DeepDive: Transparently Iden-tifying and Managing Performance Interference in Vir-tualized Environments”. In: USENIX Conference on An-nual Technical Conference. USENIX Association, 2013, pp. 219–230.
[8] iostat. http://linux.die.net/man/1/iostat. Accessed: 2016-04-18.
[9] vmstat. http://linuxcommand.org/man pages/vmstat8. html. Accessed: 2016-04-18.
[10] D. Dean et al. “PerfCompass: Online Performance Anomaly Fault Localization and Inference in Infrastructure-as-a-Service Clouds”. In: IEEE Transactions on Parallel and Distributed Systems PP.99 (2015), pp. 1–1. ISSN: 1045-9219.
[11] Kohta Nakashima Masao Yamamoto Miyuki Ono. “Uni-fied Performance Profiling of an Entire Virtualized Envi-ronment”. In: International Journal of Networking and Computing. January 2016, pp. 124–147.
[12] Jiaqing Du, Nipun Sehrawat, and Willy Zwaenepoel. “Performance Profiling of Virtual Machines”. In: Pro-ceedings of the 7th ACM SIGPLAN/SIGOPS Interna-tional Conference on Virtual Execution Environments. VEE ’11. New York, NY, USA: ACM, 2011, pp. 3–14. [13] A. Khandual. “Performance Monitoring in Linux KVM Cloud Environment”. In: Cloud Computing in Emerging Markets (CCEM), 2012 IEEE International Conference on. Oct. 2012, pp. 1–6.
[14] A. Anand et al. “Resource usage monitoring for KVM based virtual machines”. In: Advanced Computing and Communications (ADCOM), 2012 18th Annual Interna-tional Conference on. Dec. 2012, pp. 66–70.
[15] S. Wang et al. “VMon: Monitoring and Quantifying Virtual Machine Interference via Hardware Performance Counter”. In: Computer Software and Applications Con-ference (COMPSAC), 2015 IEEE 39th Annual. Vol. 2. July 2015, pp. 399–408.
[16] Mohamad Gebai, Francis Giraldeau, and Michel R Da-genais. “Fine-grained preemption analysis for latency investigation across virtual machines”. In: Journal of Cloud Computing. December 2014, pp. 1–15.
[17] Trace Compass. https : / / projects . eclipse . org / projects / tools.tracecompass. Accessed: 2016-04-3.
[18] Open Stack User Survey Insights Compute Hypervisor Section. http : / / superuser . openstack . org / articles / openstack - user - survey - insights - november - 2014. Accessed: 2016-03-15.
[19] Mathieu Desnoyers and Michel R. Dagenais. “The LT-Tng tracer: A Low Impact Performance and Behavior Monitor for GNU/Linux”. In: OLS (Ottawa Linux Sym-posium) 2006. 2006, pp. 209–224.
[20] A. Montplaisir-Goncalves et al. “State History Tree: An Incremental Disk-Based Data Structure for Very Large Interval Data”. In: Social Computing (SocialCom), 2013 International Conference on. Sept. 2013, pp. 716–724.