Titre:
Title: Entry, Growth and Patenting in Industrial Clusters: A study of the Aerospace Industry in the UK
Auteurs:
Authors: Catherine Beaudry
Date: 2001 Référence:
Citation:
Beaudry, Catherine (2001). Entry, Growth and Patenting in Industrial Clusters: A Study of the Aerospace Industry in the UK. International Journal of the
Economics of Business, 8(3), p. 405 -436. doi:10.1080/13571510110079000
Document en libre accès dans PolyPublie
Open Access document in PolyPublie URL de PolyPublie:
PolyPublie URL: http://publications.polymtl.ca/2249/
Version: Version finale avant publication / Accepted versionRévisé par les pairs / Refereed Conditions d’utilisation:
Terms of Use: CC BY-NC-ND
Document publié chez l’éditeur commercial Document issued by the commercial publisher
Titre de la revue:
Journal Title: International Journal of the Economics of Business
Maison d’édition:
Publisher: Taylor & Francis
URL officiel:
Official URL: http://dx.doi.org/10.1080/13571510110079000
Mention légale:
Legal notice:
This is an Accepted Manuscript of an article published by Taylor & Francis in International Journal of the Economics of Business on 2001, available online: http://www.tandfonline.com/10.1080/13571510110079000.
Ce fichier a été téléchargé à partir de PolyPublie, le dépôt institutionnel de Polytechnique Montréal
This file has been downloaded from PolyPublie, the institutional repository of Polytechnique Montréal
Entry, Growth and Patenting in Industrial Clusters:
A study of the Aerospace Industry in the UK
*Catherine Beaudry
**March 2000, revised January 2001, final version September 2001
Abstract This paper studies how firm performance is influenced by the strength of the industrial cluster (or industrial district) in which it is located. The paper presents estimates of firm-level employment and patent growth models for a range of ‘5-digit’ aerospace industries in the UK. In these models, employment in the firm’s own sector and employment in other sectors is taken as a measure of the strength of the cluster. Strong positive clustering effects are found in many sectors, but nevertheless some clustering effects are negative. Entry into clusters of this industry is also examined and some sectors are found to attract new entry while others are only attracted.
JEL classification: L10, L62, L93, O30, O40, R12
Keywords: Industrial Clusters, Firm performance, Innovation, Entry, Aerospace
* This research was funded by European Community Contract No SOE1 – CT97 – 1058 (DG12 – SOLS),
Industrial Districts and Localised Technological Knowledge: The Dynamics of Clustered SME Networking, which is part of the Targeted Socio-Economic Research (TSER) Programme organised by
DG XII (Science, Research, and Development). We are grateful to Franco Malerba from the Center for Research on Internationalisation, Bocconi University, Milan for allowing us the use of the EPO-CESPRI database. We wish to warmly thank Peter Swann for his helpful suggestions and comments. We
acknowledge helpful comments from our European partners in this research programme, notably Cristiano Antonelli, Stefano Breschi (for some insights on variable definitions in the patent growth model),
discussions with Naresh Pandit and Gary Cook, the earlier work of Rui Baptista developing econometric models of entry, growth and innovation, and comments from two anonymous referees. None of these, however, are responsible for any remaining errors.
** Catherine Beaudry, Manchester Business School, Booth Street West, Manchester, M15 6PB, UK; Tel.: +44-161-275-6580; fax: +44-161-275-7143; e-mail: cbeaudry@man.mbs.ac.uk
1. Introduction
The early 1990s have witnessed serious downsizing in the UK aerospace industry as a result of poor industry performance (Business Ratio Plus, 1994). A cyclical downturn in the civil aerospace sector coinciding with a low demand from the military sector caused a deep recession in the UK aerospace industry. During these years, the workforce of aerospace engineering and manufacturing companies has declined by an average of 7 % per annum. The UK industry, however, survived the recession of the early 1990s better than its European1 counterpart because of early rationalisation and cost cutting to improve productivity. Despite an initial decline, UK sales for this industry have increased by an average of 3 % per annum from 1991 to 1998.2
In the civil aerospace sector, sub-contracting and risk-sharing are now common practice. Prime-contractors often delegate the production, and sometimes even the preliminary design, of complete systems to large suppliers. These in turn outsource parts to 3rd or 4th level suppliers. Maintenance is also increasingly sub-contracted to
specialist firms. Workforce rationalisation at British Aerospace and GEC-Marconi may have led to an increase in the number of entrants and to potential important cluster effects. This empirical study will examine the industry some years after this sharp decline in the main aerospace employers’ workforce, in view of identifying the importance of cluster effects.
There is a long and distinguished tradition of research on industrial clusters (or agglomerations as they were first named) within urban and regional economics,
recent review of the literature). More recently, the work of Porter (1990) and Krugman (1991) has been particularly influential in the renewed interest of this field of study among economists. Indeed, three fields of mainstream economics have examined clusters since Porter’s (1990) study. The first can be characterised by the work of Romer (1986, 1990) as well as Grossman and Helpman (1992) who have introduced the new growth theory. Second, Arthur (1990), David and Rosenbloom (1990), Krugman (1991) as well as Brezis and Krugman (1993) have concentrated on what is commonly called path-dependence in economics. Finally, Jaffe (1989), Jaffe et al. (1993), Feldman (1994), Audretsch (1995), Audretsch and Feldman (1996) and Breschi (1999) have added to the empirical and econometric literature on the clustering phenomenon. Some have sought to empirically measure the extent to which, and the mechanism by which, firms benefit from regional spillovers. Others have focused on the cluster and firm characteristics that enhance firm performance.
The stream of econometric work that most influences this paper has estimated models of firm growth, new firm entry, and patenting as a function of firm-specific variables on employment, turnover, other financial variables and age, as well as
patenting and regional data characterising the various dimensions of industrial strength in clusters. In particular, the paper follows the methodology employed in Swann and Prevezer (1996); Swann et al. (1998); Baptista and Swann (1998a, 1998b); Beaudry and Breschi (2000). These studies have modelled the rate of growth of a firm as a function of the strength of the cluster in which it is located. In the same vein, they have
examined whether strong clusters are responsible for a disproportionate share of innovations, and whether they attract a greater number of new firm start-ups. Baptista and Swann (1998a, 1998b) suggest that firms located in clusters that are strong in their
own (2-digit) industry tend to grow faster, but also tend to introduce more innovations than more isolated firms. In terms of new firm start-ups, the strongest effects of clustering tend to operate across sub-sectors of the industry. Furthermore, they found that firms located in clusters that were strong in other industries did not grow faster and sometimes might grow slower, the same was also shown in the case of firm-specific innovation growth.
These earlier studies focused on the UK alone or focused narrowly on US/UK comparisons in two industries: computing and biotechnology. As such these
conclusions relate only to a narrow group of high-technology industries; they may not be relevant in the context of other industries. The methodology employed in these studies identified some factors that contribute to company growth, innovative performance and new entry in the case of high technology sectors, and a leading question for the present study is whether these same factors apply in the aerospace industry. The purpose of this study is therefore to explore these hypotheses, to see the extent to which they carry over to this other high-technology sector, and to explore the comparative performance of firms within and out of clusters. This paper analyses lifetime growth, patent growth and new firm entry for the UK aerospace industry to evaluate the effects of clustering on a regional basis. By applying three types of analysis to this sector, we aim to gain a better understanding of the cluster effects.
The case of the aerospace industry is particularly interesting because of the two diametrically opposed forces that are at play. On the one side, manufacturing civil aircraft demands greater consolidation to benefit from economies of scale and shared research and development. On the other side, the military sector pushes towards
fixed costs of development are considerable and must be spread over a relatively small production run compared with say the computer industry. An additional difference between the aerospace industry and the two sectors analysed in previous studies is that there are far fewer producers in the aerospace industry. Firms in the industry are increasingly sub-contracting and the practice of risk-sharing encourages collaboration between various levels of contractors. It is therefore a knowledge intensive industry and as such, strong cluster effects are to be expected. Because of these specificities, the aerospace industry is a pertinent example of the beneficial effects of clustering.
These types of studies show whether cluster effects are present but
unfortunately fail to identify exactly the nature of the spillovers that they generate. Applying the same methodology in this paper allows us to determine the importance and extent of the cluster effects in the UK aerospace industry, but we can only deduce the mechanisms at play to create such effects. We cannot tell whether it is the fact that companies share a common infrastructure or a common pool of skilled labour that influences most their performance. All we can say is that something seems to be affecting the growth, innovation and entry rates for the better.
The structure of the paper is as follows. Section 2 sketches the theoretical background to the empirical analysis. Section 3 presents a description of the aerospace industry from the point of view of industrial sectors and regional distribution. Section 4 concentrates on the lifetime growth model empirical analysis. Section 5 modifies the growth model to examine patent growth in the aerospace industry. Section 6 builds and estimates an entry model to determine the sectors that most attract entry into clusters. Finally, section 7 discusses the significance and interpretation of our results.
2. Theoretical interpretation of models used in this study
From earlier work, and building on Baptista’s (1998) literature review, a wide range of empirical observations and theoretical perspectives were implemented into various models of clustering (Swann, 1998a, 1998b). In general, a model of clustering consists of two broadly defined features that impact on the performance of firms located in a cluster: agglomeration externalities referring to advantages of clustering, and congestion externalities relating to its disadvantages (Swann, 1998a). The benefits of clustering can be divided into demand and supply sides advantages.
On the demand side, firms may cluster in a particular location to take
advantage of strong local demand. Some of these advantages are most likely to be felt if the firm is located in a cluster that is strong in its own sector; for example, a chemical firm that is located in a region with a strong chemical industry. Firms located in a cluster may also enjoy demand-side advantages emanating from the strength of another industry in that cluster; Suppose for instance that strong local demand for the output of sector i emanates from another sector j, which is a major consumer of the products of i. Further, in the tradition of Hotelling (1929), a firm stands to take market-share from its rivals (under certain assumptions) if it locates close to other firms. In markets where potential customers are discerning and have very specific requirements, agglomerations also reduce consumer search costs. Finally, demonstration effects arising from the observation of successful firms in a cluster incite new entrants in the cluster. In terms of innovation, customers are an important source of new ideas within the framework of localised user-supplier interactions (von Hippel, 1998; Lundvall, 1993).
Turning to supply side advantages, a wider variety of intermediate inputs at a cheaper price can be obtained by a localised industry that supports a greater number of
specialised local suppliers. Further, a localised industry can attract and create a large pool of skilled workers, smoothing the effects of the business cycle through increasing numbers (David and Rosenbloom, 1990). Some supply side advantages may be strongest when companies are co-located with their peers from the same industry. Indeed, some Marshallian externalities are sector-specific (Marshall, 1920), notably the availability of labour with sector-specific skills. In addition, infrastructure benefits such as access to major motorways, railways and airports is often cited as an attractor of firms into a cluster. Some infrastructure benefits are not specific to any sector(s), while some may be more relevant to some sectors than to others. Similarly to the demand side, informational externalities accrue to the new entrant from seeing established firms producing successfully at a particular location. These informational externalities are in some measure sector-specific.
A very important supply-side benefit consists of knowledge spillovers, i.e. the positive externalities of technical and scientific discoveries on the productivity of firms that neither made the discovery themselves nor licensed its use from the holder of the intellectual property rights. Knowledge spillovers are facilitated because tacit
knowledge flows more easily within a cluster (Jaffe et al., 1993). Firms are embedded in a network of relationships with users, suppliers, competitors as well as research centres, whether public or private (Kline and Rosenberg, 1986; Nelson, 1993). These networks are often highly localised to facilitate knowledge flows and general
communication among agents (Storper, 1992; Freeman, 1991). Codified information that has a singular meaning and interpretation can be transmitted at low cost over long distances, while knowledge is more vague, difficult to codify and is better transmitted through repeated face to face interactions, which are better managed in close proximity
(Audretsch, 1998). This implies that firms and inventors operating in a specific industry will be more innovative when located next to each other than when isolated from one another because of the greater probability of sharing tacit knowledge and having access to local universities and research centres (Jaffe, 1989; Jaffe et al., 1993; Feldman, 1994; Audretsch and Feldman, 1996, 1999; Mansfield, 1995). While the greater part of technology spillovers, perhaps, is sector-specific, firms seek to sustain competence in a wider range of technologies than the range of their output markets would suggest (Patel and Pavitt, 1994). For this reason, we can expect technological spillovers to cut across sectoral boundaries. Malerba (1992) identified a further supply-side advantage in the learning-by-doing and learning-by-using that is facilitated in clusters because of the opportunities to experiment with new techniques through production problem-solving, meeting customer’s needs, and overcoming technical imbalances (Pred, 1966).
Moreover, as Arthur (1990) argues, any advantage from clustering, and particularly innovation, is likely to become cumulative and self-reinforcing. Hence, a key aspect of the effect of clusters on a firm’s innovative activities and subsequent growth resulting from acquisition of market share is not so much the current size of an industry in a particular area, but the accumulated stock of knowledge. Regions that first emerged as centres of innovative activity in a particular sector tend to maintain their advantage over time.
Unfortunately, there can also be disadvantages of locating in a cluster, and as with the benefits, these can accrue on the demand side as well as the supply side. Many of these disadvantages are likely to be generic rather than sector-specific, just think of high property rentals in very dense metropolitan areas.
On the demand side, the disadvantages of clustering are relatively obvious. Increased local competition in output markets arising from congestion or external diseconomies detracts from company performance and may result in lower profit margins, thereby reducing the amount of resources potentially devoted to research and development. In a Cournot model, for instance, an increased number of competitors will reduce per-firm sales, prices and hence future growth. As congestion becomes heavy, it is very likely that these disadvantages will start to dominate the demand-side benefits. In addition, these effects are most likely to be felt by firms located with their peers in the same industry, i.e. in the case where the competition in the output market is strong. Here, the demand-side disadvantages are generic rather than sector-specific.
Similarly to the demand side, the disadvantages of clustering on the supply side also relate to congestion and competition but in input markets, the most flagrant
examples being the cost of real estate and labour. Once again, many of the
disadvantages are generic rather than sector-specific. For instance, a firm located in the centre of a large metropolitan area faces congestion, high property rentals and high labour costs, but these costs are also imposed on all businesses located in this area, regardless of the sector. Nevertheless, some disadvantages may be sector-specific.
To summarise, clustering effects can in principle emanate on the demand side or the supply side, and can be positive or negative. Empirical analysis can therefore help measuring the relative magnitudes of these different effects. To some degree, the relative magnitudes of these effects for a given firm in a given cluster will depend on the sectoral makeup of that particular cluster. The models estimated in sections 4 and 5 estimate the effect of own-sector employment and other-sector employment on the lifetime growth and patent growth of a particular company. To help the reader interpret
the parameter estimates in these two sections, it is useful to sketch four scenarios, where the effects mentioned above are of different magnitudes. Table 1 summarises the sector-specific and generic advantages and disadvantages described above into four scenarios measured in terms of their effects on own-sector and other-sectors
employment.
[Table 1 should appear approximately here]
The earlier empirical results referred to in the last section often corresponded to the scenario described in the top right corner of Table 1. But even if the other scenarios seem at first sight less likely, they are all possible. The results of sections 4 and 5 may suggest that all four scenarios may be more common than has previously been thought. A final point on the sectoral makeup of clusters needs to be addressed before going further. From the recent literature on new growth economics, two types of
localised knowledge externalities can be identified (Glaeser et al., 1992). First, some of the advantages from clustering may arise from industry specialisation in that a high concentration of an industry’s activities in a particular location may induce higher levels of technology spillovers and facilitate innovation. These have been named localisation economies, or Marshall-Arrow-Romer (MAR) externalities. Second, some benefits may be gained from cluster diversity or variety between complementary industries, and the innovative ideas, skills, know-how and human capital that these distinct but somewhat related industries bring to the cluster, hence promoting firms’ innovative activities. Jacobs (1969) has named these externalities urbanisation economies. Audretsch and Feldman (1999) concluded that diversity matters more than specialisation, and we will verify whether this also applies to the aerospace industry.
3. Data
This study combines three sources of data: company data, patent data, and regional data. These three sources of data are described in detail below, accompanied by the specific issues relating to their merger into a single database.3 Then follows a
brief description of the aerospace industry from the simple observation of the basic data. Data sources
Extensive work was required to extract the relevant set of companies from the full Dun and Bradstreet’s OneSource UK vol. 1 & 2 database (September 1998 edition).4 Four categories of company information are considered in the econometric analysis: firm size (number of employees), sector (using four-digit UK Standard Industry Classification (SIC) 1992 rev.), region (postcode) and type of company5 (parent,
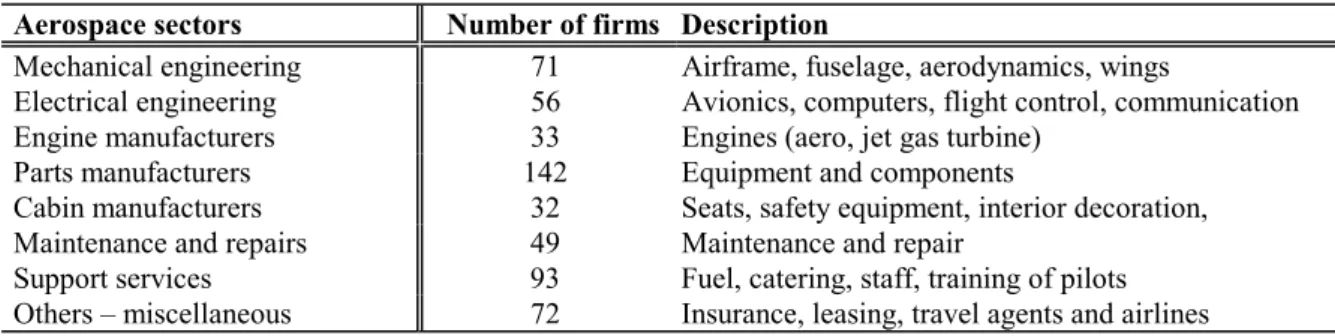
subsidiary or independent). Each sector was disaggregated into 8 sub-sectors for the purpose of detailed econometric analysis following Swann et al. (1998). Table 2 presents the 8 constructed sectors of the aerospace industry, which are a subdivision of the four-digit UK SIC codes.6
[Table 2 should appear approximately here]
Skimming through the data, we noticed that many firms were involved in more than one of the eight sectors chosen. The author’s in-depth engineering knowledge provided invaluable information in determining a single ‘main sector’ of activity for each company. This is an over simplification in the case of multi-sector firms, which may be unsatisfactory when the firm has diversified into other secondary sectors, but without detailed information on such diversification, this seems a reasonable working assumption.
The second set of data used in this study is the REGIO database from Eurostat and provides economic and demographic regional variables at the NUTS (Nomenclature des Unités Territoriales Statistiques) level 3, i.e. 65 counties for the UK. Five variables were extracted by each NUTS level 3 region: number of patents (measure of innovation activity), population density and gross domestic product (measures of cluster strength), as well as number of air travel passengers and kilometres of motorway (measures of infrastructure quality). Unfortunately, REGIO has some flaws; for instance, the last two variables are only available at NUTS level 27. As REGIO provides limited employment data, use was made of the Annual Employment Survey from the Office of National Statistics (ONS) to obtain the total employment by county. Cumulative employment in the aerospace sector was constructed from the aggregation of the number of employees of each firm in each aerospace sub-sector extracted from Dun and Bradstreet’s database.
The third data source used in this study is the EPO-CESPRI database which provides information on patent applications to the European Patent Office (EPO) up to 1994 for the UK. For each patent document, this database lists the innovators (name and address8), filing date to the EPO and assigned technological field9 to the invention.
Finally, some important issues arise while merging the databases, especially in preparing the data for the patent growth analysis. The most complex problem
encountered occurred while merging the patent database with the company information database; The sole point of correspondence between the two sources is the name of the companies, which may not be spelled identically in the two databases. This merger had to be performed case by case with considerable care.
Distribution of firms
Out of 360,000 companies included in the Dun and Bradstreet OneSource UK Vols. 1 & 2 database, 750 firms are involved in aerospace-related activities, of which only 548 firms list the necessary employment data.
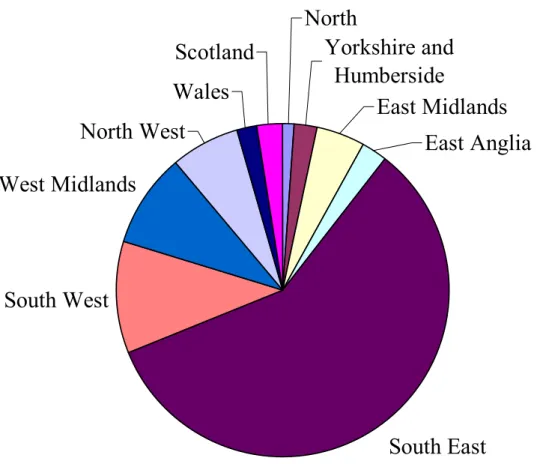
Let us first examine the distribution of firms across the regions of the UK (see Figure 1, and appendix 2 for a breakdown by sector). The main part of aerospace activities appears to be located in the South East of the country. In addition to more than 25 firms per county, the Midlands and part of the South East also possess a number of international airports (Birmingham International, Heathrow, Gatwick and Stansted). A great proportion of the support services to the aerospace industry is located near the main two airports of the country, Heathrow and Gatwick. Further, companies like Lucas Industries and BAe, which have plants all over the country, from Hampshire to
Hertfordshire, Clwyd to Avon, are very difficult to analyse for various reasons: First, most of these important companies file consolidated accounts; Second, plants are located in different UK counties and potentially generate spillovers locally; Third, they produce various outputs, which may be used in different applications. As shown in Figure 2, most of the activity of the aerospace industry is located in the South East (58.2 %, London), the rest being divided into the South West (10.9 %, mainly around Bristol), the West Midlands (9.1 %, Birmingham) and the Northwest (6.6 %,
Manchester).
[Figure 1 should appear approximately here] [Figure 2 should appear approximately here]
Out of the 548 companies operating in the aerospace industry as defined for this study, only 8.3 % of firms patented during the years 1988-1994 (see appendix 3).
Obviously, the vast majority of firms did not patent, while those that did, patented in a relatively restricted number of patent classifications. Only the largest firms such as GEC-Marconi, Lucas Industries and British Aerospace patented in a wide range of technological classifications. Patents will be considered as an aggregate for each firm for the purpose of this paper for two reasons. First, the focus of this study does not involve the diversity of patents in terms of technological classifications as the number of firms involved here is too small. Second, analysing each patent separately to judge whether it is related to the aerospace industry would require considerable technical knowledge and would not bring much more accuracy to the results.
A frequency analysis of the firms that patent was calculated per sector and county. Table 3 presents the number of patent applications filed to the European Patent Office (EPO) per sector and per region.
[Table 3 should appear approximately here]
Mechanical and electrical engineering firms and parts manufacturers possess a much greater number of patents than their counterparts. Some firms, due to the
aggregation of all the patent applications, appear to be producing a greater number of patents. For example, British Aerospace, which has been classified in the airframe sector, filed 242 patent applications during the period 1988-94 in 18 technological classifications: 62 patents in the category control technology and 54 patents in the transport category to name a few. GEC-Marconi, has filed an equivalent number of patent applications (248) in an equally vast array of fields. In the engine manufacturing sector, Rolls Royce is obviously the main patenting company. Lucas Industries, in the parts manufacturing sector, filed 506 patents in 19 categories with the majority in transport and engines.
4. Lifetime growth analysis
The first of our three analyses is concerned with the growth of firms throughout their lifetime. The purpose of this exercise is to determine whether location in a cluster is beneficial to the general growth of firms.
Model
Two approaches to modelling lifetime growth can been used, one at the level of the firm, and the other at the level of the cluster. The most successful approach works at the firm level, and identifies whether firms located in strong clusters (with strong
industry and/or a strong science base) grow faster than isolated firms do. In its simplest form, a model of the lifetime growth of the firm can be written using employment10 as a measure of cluster strength:
∑
= + + + + = V v v v jc ic n n a b Age b E b E d V e 1 3 2 1 0 ln ln ln (1)∑
∑
− = − = + = 1 1 1 1 1 S s s s C c c c D d D d b (2) where:• firm n is active in sector i, and located in cluster c; • en is employment in firm n [FirmEmp];
• Agen is the age of the firm in 1998 (1998 - date of foundation of firm n);
• Eic is employment in sector i, cluster c [OwnEmp];
• Ejc is employment in other sectors j (≠i), cluster c [OthEmp];
• Vv represents other cluster strength variables;
• Ds are sectoral dummy variables.
The double-log format is the most useful for this study, as its parameters are easiest to interpret. Thus the model estimates the trend rate of growth (b1) but also
makes allowances for the fact that growth may be influenced by the presence of similar firms (b2) and of other firms (b3). The cluster and sectoral dummy variables are
introduced in the model as interactive with the age of the firm. This formulation implies that being located in a particular cluster and sector affects the ‘growth rate’ of the firm rather than giving it a ‘fixed’ number of employees (if they were standard intercept dummy variables). In principle, b3 ln Ejc can be replaced by a sum of effects, one for
each sector in cluster c, but given the likely collinearities and the size of the sample, this was thought impractical for the present study.
The reader will have noted that the model used in this section uses a single time period rather than a time series model of company size growth. Using year-to-year growth rates as opposed to a single census lifetime growth model would cloud the results in the volatility and unpredictability that is intrinsic to yearly employment growth figures. In addition, while we can build such a time series for many firms, this is not possible for the smaller companies of our database.
General results
Two types of regressions were estimated in this study of the aerospace sector. First, regressions were estimated on the pooled data (in Table 4 in this sub-section), and dummy variables for sectors were introduced to evaluate the necessity for splitting the sample into 8 distinct sectors. Following the positive results on the sectoral dummy
variables, industry specific regressions were fitted to each sample (in the next sub-section).
[Table 4 should appear approximately here]
The results show that employment in your own sector (in this case one of the eight sectors described above), has a positive effect on firm employment. That is to say that an increase of 10 % of employees in the sector of activity of the firm, in a particular region, will generally be accompanied by an increase of around 3 % of employees in the firm. In other words, a firm located in a cluster with strong own-sector employment has a tendency to grow faster than a firm that is not surrounded by its peers. In contrast, a rise in employment in all other sectors, has a negative effect on firm employment, but to a lesser extent than the own-sector employment. That is to say that a firm located in a region that has a strong other-sectors employment (other than the own sector of the firm), will tend to grow slower than average.
The coefficient of Age is positive, implying that older firms are larger on average, or in other words that the trend rate of growth is positive and around 2.3 % for the entire industry. When sectoral dummy variables (interactive with Age) are included in the estimation, avionics appears with the highest trend rate of growth. These sectoral trend rates of growth may appear very small compared with other high tech industries, but if turnover was used as the size variable, then the average growth rate would be much higher.
With the exception of the number of air travel passengers11 and the number of
patents, the other cluster strength indicators have a small negative impact on firm growth. For instance, a firm located in a very densely populated cluster would tend to grow more slowly than average. It is difficult to bring in new employees if they cannot
find places to live. This is a further indication of congestion in some densely populated clusters. Moreover, the negative but non-significant coefficient of the employment Herfindahl index (EmpHerf) suggests (weakly) that diversity is more important in a cluster than specialisation, as concluded by Audretsch and Feldman (1999).
In contrast, variables representing firm characteristics such as the three dummy variables on the ownership status of the firm have strong positive effects on firm
growth. Indeed, a firm benefits from being a holding company (DHold), but not so much as if it were a subsidiary of a bigger organisation (DSubs). This result clearly identifies the strong impact on firm growth resulting from ownership by a greater organisation. The size of the coefficient on the consolidation dummy variable (DCons) was expected to be significantly large, as firms who file consolidated accounts include all their subsidiaries in their employment count and as a consequence, appear much bigger than they really are.
Sectoral dummy variables were introduced in the lifetime growth model of the firm to evaluate the need for regressions by sector. All the coefficients on the dummy variables are positive and significant, with mechanical and electrical engineering as well as cabin manufacturers with the strongest effects. Because they are not intercept
dummy variables, we cannot say whether the effects on growth are more important in certain sectors or firms are simply older in these sectors. But their significance certainly points towards sectoral-split regressions.
The graphical representation on a map of Britain of the fixed effects for each county (NUTS 3), i.e. the coefficients of the regional dummy variables normalised with respect to the smallest value, is presented in Figure 312. These fixed effects account for
[Figure 3 should appear approximately here]
The strongest fixed effects are located in Greater Manchester and
Mid-Glamorgan. The Bristol/Cardiff region which counts 30 aerospace-related firms is also highlighted as an important region. So is Clwyd, where British Aerospace manufactures the wings of the Airbus in the northern part of Wales. Other important clusters are located in Hampshire (5 avionics firms), Bedfordshire (3 airframe manufacturers), the periphery of London, as well as in the regions west of Glasgow and north of
Manchester. The West Midlands county, with 34 firms, shows relatively small fixed effects compared with Manchester say, with only 7 firms. In the West Midlands, the majority of firms operate in the mechanical engineering (8 firms) and parts (14 firms) sectors.
Results by industry
In the pooled regression described above, dummy variables for seven of the eight sectors defined for this study were found to have positive significant effects on firm growth. This result clearly suggests a further examination of each sector in particular, as is presented in Table 5.
[Table 5 should appear approximately here]
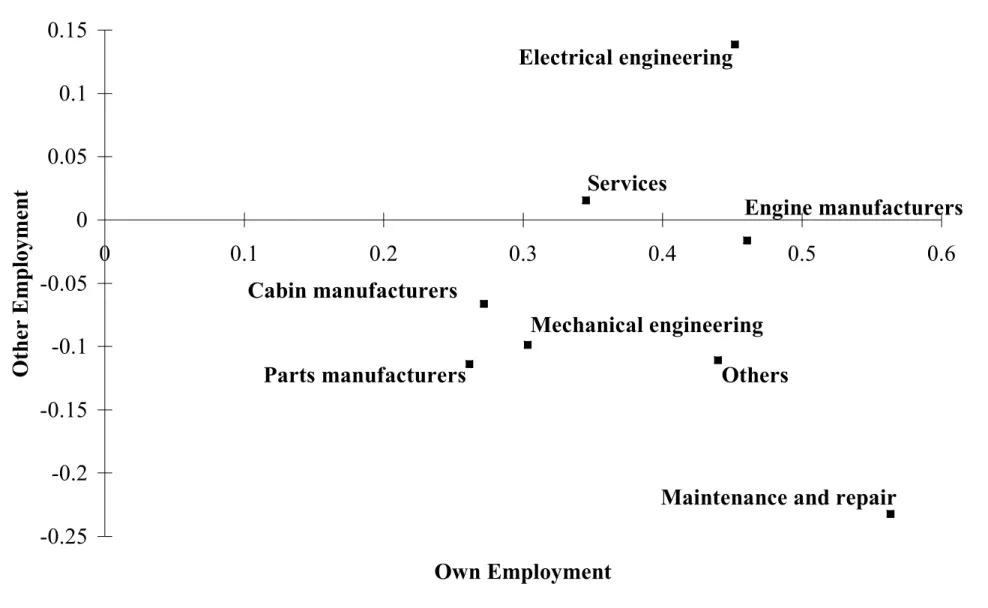
From the sector specific regressions, we can deduce that own-sector and other-sectors employment have different effects on firm growth. This will be treated in greater detail below in Figure 4. The growth rate (coefficient of Age) is positive and significant in the majority of sub-sectors with the exception of mechanical engineering, engine manufacturers and maintenance. These three sub-sectors probably consist of the longest established firms and may no longer experience ‘exponential’ growth. The
consolidation account dummy variable has a strong positive effect in mechanical and electrical engineering, engine and parts manufacturers.13
[Figure 4 should appear approximately here]
Very strong positive cluster effects are observed for electrical engineering, engine manufacturers as well as maintenance and repair sectors, two of which are core sectors in the aerospace industry. Among all the sub-sectors, only electrical engineering possess a positive and significant coefficient for other-sectors employment, implying that this avionics sub-sector does not suffer from the congestion and competition effects that other sub-sectors encounter. Engine manufacturers experience mild congestion and competition effects, while maintenance and repair is the sub-sector that appears to be suffering the most from these negative cluster effects. Understandably, these firms tend to be located near airfields, which are generally also located near densely populated areas. Note that maintenance and repair firms also benefit from very strong positive cluster effects from their own sub-sector. Mechanical engineering, cabin and parts manufacturers, however, benefit from lesser positive own-sector employment effects but also experience lesser negative cluster effects. Firms in these three sub-sectors do not necessarily need to be located near commercial or military airports, moreover, in the case of airframe manufacturers, they often have access to their own airfields. For instance, the North Wales plant of British Aerospace possesses its own airfield from where they fly the wings of the Airbus to Toulouse.
In brief, we have found significant cluster effects in many sectors of the aerospace industry. Moreover, in many of these sectors, a strong employment position in other sectors was found to be detrimental to firm growth in a particular cluster. With the exception of avionics, an important positive effect on own-sector employment and
conversely negative effect on other-sectors employment were discovered in manufacturing industries of large subsystems.
5. Patent growth analysis
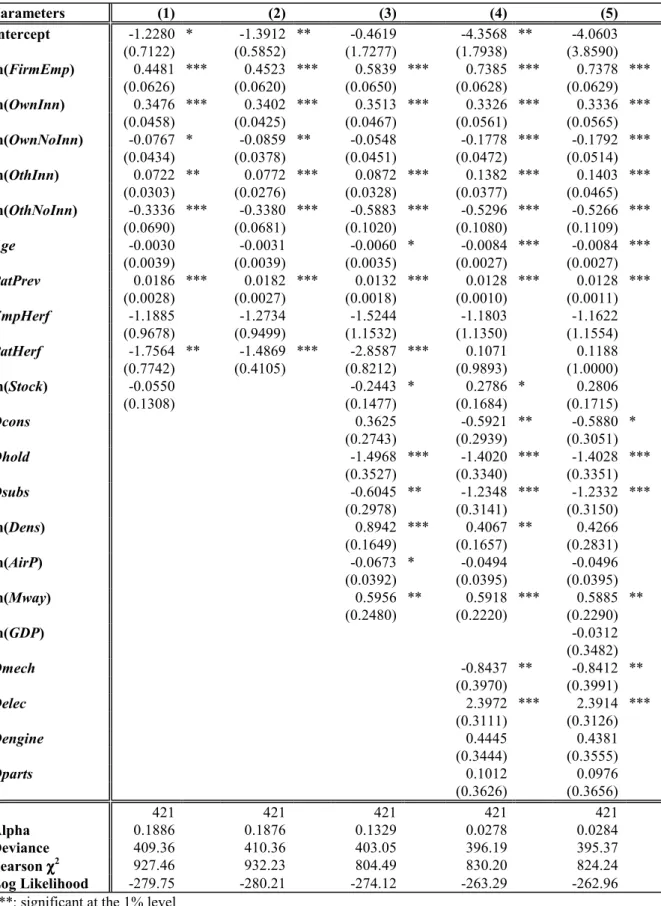
Following the results on the lifetime growth models presented in the previous section, we pursue the analysis by replacing the left-hand side variable with a measure of innovation. Firm employment is relegated to the right-hand side, and patent counts from 1988 to 1994 are chosen as the dependent variable. This second analysis attempts to measure the effects of clustering on patent growth in the firm. Note that to be
consistent with the patent data, 1994 is used for the employment variables (firm, own-sector and other-own-sectors) and consequently, the sample size for which data is available for 1994 declines to 421 firms.
Model
Because the left-hand side variable is discrete and consists of a majority of zeros, Poisson and negative binomial regression methods of analysis will be used (see Hausman et al., 1984). The following functional form was used for the estimation:
∑
∑
= = − − + + + + + + + + = S s s s V v v v p jc jcp p ic icp n n n D d V d E b E b E b E b e b Age b a P 1 1 6 5 4 3 2 1 0 ln ln ln ln ln (3)where the new variables are:
• Pn represents the number of patent applications for each company n [Pat8894];
• Eicp is the part of own-sector employment associated with innovative firms
• Eic-p is the part of own-sector employment related to non-innovative firms
[OwnNoInn];
• Ejcp is the part of other-sectors employment from innovative firms [OwnInn];
• Ejc-p is the part of other-sectors employment associated with non-innovative
firms [OwnNoInn].
The separation of the own-sector and other-sectors employment into innovative and non-innovative employment results from the counter-intuitive estimates obtained for the original cluster strength variables. Indeed, in some cases, the coefficients obtained had the reverse sign of what was expected from the lifetime growth analysis. Following Beaudry and Breschi (2000), we separated the original employment variables into innovative and non-innovative employment to investigate the effects arising from the location in a cluster of an important group of innovative firms.
Results
The analysis performed on the model in equation (3) used employment data for the year 1994 and the sum of patents for the years 1988 to 1994. This kind of set up seems to imply that company employment is a consequence rather than a cause of the innovation activity. The problem of ‘reverse’ causality would be an important problem for a time series model, but not for a single time period as is the case here.
Nevertheless, the EPO-CESPRI database for the UK is currently being updated up to 1998 and this should remove any ‘apparent’ causality. Results of the Poisson and negative binomial regressions estimated here are presented in Tables 6 and 7.
[Table 7 should appear approximately here]
Intuitively, the effects of innovative own-sector employment and firm employment on patent growth are both positive and significant with the latter much more important than the former. Innovative other-sectors employment is also positive (in the fuller models 3 to 5) but much less important than the first two cases, implying that inter-sectoral positive externalities are likely to flow locally from innovative firms. Moreover, from the negative and significant coefficient on non-innovative own-sector and other-sectors employment, we can deduce that firms located in clusters with strong non-innovative employment in all sectors have a slower patent growth than if the region was strong in innovative firms, clearly indicating congestion effects. The benefits of clustering are therefore more generic than sector-specific and strongly depend on the accumulated stock of knowledge (Stock) in the cluster and whether a firm is located with other innovators. As expected from the coefficient of PatPrev, if a firm patented before, it is more likely to patent in the current period, hence reinforcing the cumulative and persistent aspect of innovative activities. Regarding employment and patent
diversity, both coefficients of the Herfindahl indices are negative (when industry dummy variables are omitted) implying that the more diversified the cluster, the better for successful innovative activities. This result therefore supports Audretsch and Feldman’s (1999) claim that diversity matters more than specification.
A higher population density and a better motorway infrastructure seem to also benefit a firm’s innovative performance. In contrast, the number of air traffic
passengers has a negative impact on a firm’s innovative record.14
In addition, younger and more dynamic firms tend to be more innovative than older more ‘bureaucratic’ companies. We may deduce from this that post-innovation,
firms will grow faster but that their most innovative period is the early years. Once a firm reaches a certain size, heavy infrastructure and overheads take over and the innovation performance declines in general (although it does not stop altogether). It may also be the case that entrepreneurs on the brink of a new innovation will enter the market and start their own company on the back of this new innovation. This
phenomenon contributes to lowering the average age of innovative firms.
The consolidation effect is strong again but its significance disappears with the introduction of industry dummy variables, implying that some sectors are more
consolidated than others. Surprisingly, the coefficient on the holding company dummy variable is negative. This suggests that holding companies do not patent as much as independent firms or even as their subsidiaries (as is shown by the less negative significant coefficient on the dummy variable for this particular status).
Once again, the avionics sub-sector stands out: represented by the dummy variable DElec, it has the strongest positive coefficient effect on patent growth. This sector is viewed by many experts in the field as the key to the future of the aerospace industry. This probably implies that the avionics sector is the most prolific in terms of successful patent applications. In contrast, the coefficient of the dummy variables for mechanical engineering firms has a negative effect on patent counts.
6. Entry analysis
This third analysis of the aerospace industry wants to establish the extent to which new firms are attracted by existing clusters in the industry. Specific sub-sectors and particularly the main core sub-sectors of the aerospace industry may play a more significant role in attracting new entry than more peripheral sub-sectors. The entry
model required to study the impact of innovations on entry in the aerospace industry is very complex and necessitates a longer and more detailed time series than is currently available. A simpler entry model is therefore presented in this section.
Construction of the data
Without a comprehensive database of yearly entry in the aerospace sector, a good proxy consists of constructing an entry database using current company data. Assuming that each company started with one employee in its year of formation (year of incorporation in Dun and Bradstreet’s OneSource database), then grew exponentially up to year 1998, it is possible to build such an entry database.15 The database obtained
examines entry in the same 8 aerospace sub-sectors from 1970 to 1995. Model
Three types of models of entry have been used in Swann et al. (1998), a principal model of entry, an average entry model and a full model of entry. Only the latter will be investigated here even though the data necessary to this analysis is fairly limited. A very simple model will be used in this section to evaluate whether firms in a sector i in a particular cluster affects entry of other firms from the same sector in the cluster, but also affects entry of firms from other sectors j into the cluster. Here, total entry in cluster c, and sector i is assumed to be a function of industry strength measured by employment in each sector in the cluster at the end of the previous year. The model is defined as follows:
( )
∑
= − ⋅ + + = J j ij cjt it i i cit n E n 1 1 ln γ β α (4)∑
= ⋅ = C c cit it n n 1 where:• ncit is total entry in sector i, in cluster c, in year t;
• n.it is total entry in sector i, in year t;
• Ecjt-1 is the number of employees in cluster c, in sector j, in year t-1.
This is a somewhat simplified model from the one used by Swann et al. (1998) which includes a fourth order polynomial used to study the contribution to entry of clusters of certain sizes. This particular model was examined in the course of this study but the results are not conclusive and will therefore be omitted from the present paper. Results
For each of the eight aerospace sectors defined earlier, a Poisson regression was fitted to equation (4). The coefficients of the variables obtained from these eight sectoral regressions are presented in Table 8. In each regression, positive sectoral coefficients can be interpreted as attractors of entry, while the most negative coefficients represent congestion effects in clusters. In a sense, the former encourage entry whereas the latter restrain entry in particular sectors. In contrast with the diagonal coefficients16
found for the computer industry (see Swann, 1998b), in the present case, most coefficients are positive and significant implying that successful companies in a particular sector and cluster attract other firms in the same sector and cluster. This result is not surprising as most operations in the aerospace industry are based on specific contracts, i.e. the order of 20 Tornado fighters, for a particular country. It is very
difficult therefore for a firm to set up in isolation because of the problems related with attracting a skilled workforce to an isolated location for a fixed number of years. Aerospace engineers hence prefer to stay within proximity of a number of potential employers and follow the contracts from one firm to another.
[Table 8 should appear approximately here]
From the positive and significant coefficients on sectoral employment, it is possible to measure the attraction of entry between sectors. Figure 5 shows the resulting flow diagram of entry attractors in the aerospace industry. Arrows represent attraction of another sector and the larger the arrow, the stronger the attraction effect from the originating sector towards entry in another sector. Crosses on the top right-hand corner of the box represent entry attraction in the own sector (the diagonal elements mentioned above).
[Figure 5 should appear approximately here]
Mechanical engineering, the core sector of the aerospace industry because it ultimately assembles the final product, attracts entry in three other sectors: support services, engine manufacturing and cabin manufacturing. A positive feedback loop exists through mechanical engineering, engine manufacturers, electrical engineering, other aerospace sectors and parts manufacturers. The three most important sectors of this industry, avionics, airframe and engine manufacturing represent the core of this feedback loop. Two other secondary feedback loops also exist, one from parts to engine manufacturers, and another from cabin manufacturers to electrical engineering. The former seems more intuitive than the latter as engine and parts manufacturers are often grouped into one sub-sectors by most aerospace specialists (Business Ratio Plus, 1994; Smith, 1998).
Entry by maintenance and repair firms is attracted by electronic engineering firms and other firms. There is also an effect from maintenance and repair firms on entry into the cabin manufacturing sector. Not surprisingly, a strong effect exists on entry of support services from the miscellaneous sector. This last sector mainly
comprises travel agents and leasing companies which require airport services to support their air transportation activities.
Cabin manufacturers and support services are solely attracted sectors, i.e. they are not attractive to any other sectors. All other sectors are attractive to entry by firms from other sectors. The two core aerospace sectors, mechanical and electrical
engineering, are both attractive to entry in three other sectors, but the most attractive sector of all is the miscellaneous sector, which ultimately operates the commercial airline industry and orders aircraft and parts from the manufacturing side of the industry.
7. General conclusions
The full implications of this work will not perhaps be appreciated until we have compared our three findings. Four main results stand out. First, companies co-located with others in the same sub-sector show a strong tendency to grow faster than average. This is especially true in some of those sub-sectors of aerospace where we would expect that physical proximity is a marked source of competitive advantage, for example: electrical and mechanical engineering, and engine manufacture. Second, some quite strong and negative “other-sectors” cluster effects are found. This means that companies co-located with many companies from other sub-sectors do not benefit. Indeed, the resultant congestion costs appear to detract from company growth. These effects are not strongly negative in all cases: in many, they are small and insignificantly
different from zero. But we do find a sole example of positive cross-sectoral effects on company growth for the avionics sector - suggesting that cross-sectoral learning is generally weak. Third, our analysis of relative patenting within and without clusters finds a similar pattern of positive own-sector effects on patenting and negative other-sectors effects. Within-company employment has the strongest effect on patenting, but within-cluster, own-sector employment, particularly that of other innovative firms in the same sector, also has a marked effect - if not so strong. Finally, the main three core sectors in the aerospace industry: mechanical engineering, avionics and engine manufacture sub-sectors are the centre of entry attraction of the entire industry.
Clustering not only helps to attract new entry, but also benefits the growth of firms and their propensity to innovate. Sub-contracting is one way to generate such clusters and is probably the main mechanism of knowledge flow in the UK aerospace industry, with workforce mobility.
The case of the avionics or electrical engineering clearly stands out in this industry, and that from the three analyses performed. First, avionics is the only sector with both strong positive effects on own-sector and other-sectors employment implying that it benefits from strong cluster effects but does not appear to suffer from the
congestion effects noticed in other sub-sectors. Furthermore, this sector possesses the highest trend growth rate in the industry. Second, the coefficient of the dummy variable associated with this sector corresponds to the only strong positive effect in the patent growth model, signifying that after accounting for specific effects represented by the variables in the model, the fact of operating in the avionics sub-sector has a positive effect on patent growth. Finally, electrical engineering is at the centre of the entry attraction flowchart, both attracting and being attracted by three other sub-sectors. This
result is not surprising when we consider that an increasing number of specific functions are performed by electronic systems that replace old hydraulic and mechanical systems. Avionics are slowly becoming the essential partner in the high tech industry. It has been recognised in the industry that the core sub-sector of the aerospace industry is no longer airframe but systems integrators, or avionics.
In a sense, clustering benefits from being studied from various angles or research processes. On the one hand, detailed case studies provide insights into the mechanisms through which clustering brings economic benefits. On the other and, broad economic approaches will tell us about the overall picture of the importance and extent of clustering, omitting the details. It permits the comparison of clusters
throughout a country and allows the identification of those that perform better. It is rather like the difference between the diagnostic tools of the general practitioner and those of a microbiologist. The general practitioner will examine the entire body including the history of the patient to pose a diagnostic, while the microbiologist will concentrate on a very small portion of the body. Similarly, the bird’s eye view of the aerospace industry presented here is useful as a complement to the detailed studies of particular clusters in particular regions that focus on the effects of the infrastructure, pool of skilled labour or local demand on firm performance. Evidence of firm networking, transfer of tacit knowledge via staff turnover, sub-contracting or joint research and development do not lend themselves to large-scale quantification necessary to macro-statistics as used in this paper. However, the improved economic performance of firms located in clusters as shown in this paper clearly indicate that something is at play in these agglomerations. Using three types of analyses for growth, patenting and
entry, allows to examine different aspects of the effects of clusters on the UK aerospace industry.
Previous research suggests some interesting dynamic properties in the emergence, growth and longevity of clusters, but these issues have received very little theoretical analysis in the economics literature to date. A way forward for the type of studies on clustering used in this paper is the use of simulation techniques to combine the richness of detailed case studies with the broad view of macro-statistics to analyse complex dynamic models. These simulation models would be able to explore some questions about the evolution of clusters, such as: what factors have the greatest effects on the life cycle of a particular cluster; what is the amount of technological and
industrial diversity needed to prolong the life of an industrial cluster; or what are the inter-relationships between the life-cycle stage of the industries in a particular cluster and the life-cycle stage of that cluster itself. These simulations may help to develop further econometric models of clustering.
Notes
1 The UK aerospace industry is regarded as the second largest in the world just ahead
of France and after the US.
2 Smith (1998) separates the aerospace industry into four main sectors: airframe
manufacturers and assemblers, avionics manufacturers, engine and aircraft component manufacturers as well as space and satellite manufacturers.
Understandably, these figures extracted from Smith (1998) include neither suppliers of raw material and components nor service organisations. In the present paper, we add these related sectors to the main aerospace-manufacturing sector to analyse a more complete industry.
3 Appendix 1 contains a descriptive list of the variables used in this study.
4 A search under the relevant SIC code yields all kinds of companies whose activities
are marginal to this industry - we had to consult textual company descriptors before deciding whether each firm was relevant for our purposes. The following keywords were utilised in the search: aircraft, aerospace, aeroplane, avionics, aviation,
helicopter, missile and spacecraft. This was typically a problem for many of the small firms in the database.
5 Holding companies filing consolidated accounts potentially creates problems for the
empirical analysis in that double counting of employees occurs if subsidiaries appear in the database alongside their parent. As mentioned in Beaudry et al. (2001), there are various ways to treat this problem: First, the consolidated firms may simply be eliminated from the sample, but that has the negative effect of diminishing an already small sample; Second, we may attempt to find the true employment of the
consolidated firm using data on its subsidiaries; Or third, we may just have to live with the approximation given by the dummy variable. The third solution is preferred here, but the second solution will be examined in further work on the aerospace industry.
6 Under the mechanical engineering category, are firms that assemble aircraft as well
as firms manufacturing wings and fuselage. These essential parts of aircraft have been separated from the parts manufacturers category simply because of the small number of these parts required per aircraft (only one airframe and two wings are required per aircraft). The electrical engineering group of companies deal with all the parts of the aircraft that require electronic systems. Nowadays, with flight control heavily depending on on-board computers and communication with ground stations, avionics represent an important part of flight instrumentation. We distinguish engine designers from the general category of mechanical engineering as aerodynamics and the manufacturing of airframes are different disciplines from propulsion. Last but not least in the manufacturing of aeroplanes is the cabin. Without it, international air travel would be very uncomfortable indeed. Repair and maintenance firms were kept separate from mechanical engineering firms even though many manufacturers repair their own aircraft and their parts. For this reason, companies that both produced and repaired aircraft were included in the mechanical engineering category. Two more sub-sectors were added to account for companies that do not produce or repair parts of aircraft, but are nevertheless essential to the running of the industry for the
services they offer to the aerospace industry and to their customers. Services such as kerosene fuel for air travel and catering are only examples of support services
provided to the industry. Travel agents, insurance and leasing companies were included in a last category for other firms involved in the running of the industry.
7 Clusters are generally much smaller than a NUTS level 2 area, but the use of regions
has some administrative sense. For instance, in the UK, government policies and incentives towards new industries are to some extent defined at the region level (NUTS level 1). We also know from Glaeser et al. (1992) and Jaffe et al. (1993) that the external effects that are explored here with these cluster strength variables seem to grow stronger as the regional unit becomes smaller. As a consequence, the effects of the cluster variables only available at NUTS level 2 should be underestimated.
8 A potential bias arises from the common practice of headquarters to patent
innovations originally developed by divisions and subsidiaries located in different areas. Indeed, this may lead to an over-estimation of the volume of patenting
activities in large metropolitan areas where most headquarters are located. This bias, however, is likely to arise mostly in the case of large firms, which are a minority in this database of the aerospace industry. In any case, Howells (1984, 1990) has shown that research and development facilities tend to be located relatively close to
corporate headquarters. Hence, if it is the R&D facilities that leak most of the spillovers, the extent of the distortion is likely to be further lessened. Moreover, it is also likely that any possible innovation has to be approved by the company
headquarters before it is patented, in that case, knowledge spillovers may very well emanate from the company headquarters.
9 We make use here of the aggregation of the International Patent Classification (IPC)
10 A ‘holding company’ effect arises when using turnover as a measure of size in these
models for specific sub-sectors where companies possess substantially greater turnovers than average with a comparatively smaller workforce. To avoid the harmful influence of these outliers, employment was chosen as a more reliable measure of company size.
11 One of the puzzling results from this regression is the non-significant and sometimes
negative coefficient on the number of air travel passengers. In the aerospace industry, one would have expected some link between this variable and firm employment, as the proximity of airports is of importance for the firms involved in services and maintenance. It is possible that this effect may be mitigated by neighbour inter-clustering effects. For instance, in the South East, most firms are located in London, but Gatwick and Stansted are not. Further north, Manchester International Airport is on the boundary of Cheshire and Greater Manchester. Comparing the number of firms per NUTS 2 region with the number of air travel passengers in the same region, we find that in Bedfordshire/Hertfordshire where Luton airport is located, the number of passengers is relatively low compared to that of Manchester, Birmingham and London, and the same is true for Stansted airport in Essex. It is possible that this effect is a consequence in the mix between NUTS 2 and NUTS 3 regions, with air transport data only available in the former disaggregation. This may also be a clear example of the underestimation of cluster effects when the geographical unit is too vast.
12 The coefficients of the regional dummy variables are listed in appendix 4. 13 In the aerospace manufacturing industry, with the exception of cabin builders, a
significant number of companies file consolidated accounts (and are therefore holding companies of some sort). It would therefore be interesting for these sectors to sort out the employment of firms that are holding companies and subsidiaries within consolidated firms.
14 As in the lifetime growth results, this phenomenon may well be attributable to the
larger area employed to define this variable.
15 We are aware of the problems underlying this approximation. For instance, in some
cases, the year of formation and the year of incorporation may be substantially different implying that using the latter overestimates the growth rate of the firm. Another problem arises when firms that have exited the market before 1998 are not present in the database. On the one hand, it is arguable that in this exercise,
surviving entry matters most when studying sectoral attractors. A firm that will fail will most likely do so shortly after its formation and consequently not have time to develop a reputation and attract new entrants. On the other hand, if firms fail in a particular sector or cluster, noticing this phenomenon may detract firms from entering the cluster.
16 The diagonal coefficients measure entry attraction in the same sector. References
Arthur, W.B., “Silicon Valley Locational Clusters: Do Increasing Returns Imply Monopoly?, ” Mathematical Social Sciences, 1990, 19 pp. 235-251.
Audretsch, D.B., “Innovation, Growth and Survival,” International Journal of Industrial Organisation, 1995, 13 pp. 441-457.
Audretsch, D.B., “Agglomeration and the Location of Innovative Activity,” Oxford Review of Economic Policy, 1998, 14(2) pp. 18-29.
Audretsch, D.B. and Feldman, M., “Knowledge Spillovers and the Geography of
Innovation and Production, American Economic Review, 1996, 86 pp. 630-640. Audretsch, D.B, Feldman, M.P., “Innovation in Cities: Science-Based Diversity,
Specialisation, and Localised Competition,” European Economic Review, 1999, 43 pp. 409-29.
Baptista, R., “Clusters, Innovation and Growth: A Survey of the Literature”, in G.M.P. Swann, M. Prevezer and D. Stout, eds, The Dynamics of Industrial Clusters: International Comparisons in Computing and Biotechnology. Oxford: Oxford University Press, 1998, pp. 13-51.
Baptista, R. and Swann, G.M.P., “Do Firms in Clusters Innovate More?”, Research Policy, 1998a, 27 pp. 525-40.
Baptista, R. and Swann, G.M.P., “The Dynamics of Firm Growth and Entry in Industrial Clusters: A Comparison of the US and UK Computer Industries,” Mimeo, Manchester Business School, 1998b.
Beaudry, C., Breschi, S., Swann, G.M.P., “Clusters, Innovation and Growth: A Comparative Study of European Countries,” in J.H. Dunnning and J.-L. Mucchielli, eds, Multinational Firms: The Global and Local Dilemma. Routledge, 2001, page numbers not yet available.
Beaudry, C. and Breschi, S., “Does ‘Clustering’ Really Help Firms’ Innovative Activities?,” CESPRI Working paper 111, 2000.
Breschi, S., “Spatial Patterns of Innovation”, in A. Gambardella and F. Malerba, eds, The Organisation of Innovative Activity in Europe. Cambridge: Cambridge University Press, 1999, pp. 71-102.
Brezis, E.S. and Krugman, P., “Technology and the Life-Cycle of Cities”. NBER Working Paper 4561, 1993.
Business Ratio Plus, The aerospace Industry, 15th Edition, ICC Group Publication, 1994.
David, P.A. and Rosenbloom, J.L., “Marshallian Factor Market Externalities and the Dynamics of Industrial Localisation”, Journal of Urban Economics, 1990, 28 pp. 349-370.
Feldman, M.P., The Geography of Innovation. Dordrecht: Kluwer Academic Publishers, 1994.
Freeman, C., “Networks of innovators: a synthesis of research issues,” Research Policy, 1991, 20 pp. 499-514.
Glaeser, E.L., Kallal, H.D., Scheinkman, J., Shleifer, J. and Shleifer, A., “Growth in Cities”, Journal of Political Economy 1992, 100 pp. 1126-1152.
Grossman, G. and Helpman, E., Innovation and Growth in the Global Economy. Cambridge: MIT Press, 1992.
Hausman, J., Hall, B.and Griliches, Z., “Econometric Models for Count Data with an Application to the Patents-R&D Relationship,” Econometrica, 1984, 52 pp. 909-938.
Hippel von, E., The Sources of Innovation. New York: Oxford University Press, 1988. Hotelling, H., “The Stability of Competition”, Economic Journal, 1929, 39 pp. 41-57.
Howells, J., “The Location of Research and Development: Some Observations and Evidence from Britain,”, Regional Studies, 1984, 18 pp. 13-29.
Howells, J., “The Location and Organisation of Research and Development: New Horizons,” Research Policy, 1990, 19 pp. 133-46.
Jacobs, J., The Economy of Cities. London: Penguin, 1969.
Jaffe, A.B., “Real Effects of Academic Research,” American Economic Review, 1989, 79 pp. 957-970.
Jaffe, A.B., Trajtenberg, M. and Henderson, R., “Geographic Localization of
Knowledge Spillovers as Evidenced by Patent Citations,” Quarterly Journal of Economics, 1993, 108 pp. 577-598.
Kline, S.J. and Rosenberg, N., “An Overview of Innovation,” in R. Landau and N. Rosenberg, eds, The Positive Sum Strategy. New York: National Academy Press, 1986, pp. 275-305.
Krugman, P., Geography and Trade. Cambridge: MIT Press, 1991.
Lundvall, B.A., National Systems of Innovation. London: Pinter Publishers, 1993. Malerba, F., “Learning by Firms and Incremental Technical Change,” Economic Journal
1992, 102 pp. 845-59.
Mansfield, E., “Academic Research Underlying Industrial Innovations: Sources, Characteristics, and Financing,” Review of Economics and Statistics, February 1995, 77(1) pp. 55-65.
Marshall, A., Principles of Economics. London: Macmillan, 1920.
Nelson, R.R., National Systems of Innovation: A Comparative Study. New York: Oxford University Press, 1993.