O
pen
A
rchive
T
OULOUSE
A
rchive
O
uverte (
OATAO
)
OATAO is an open access repository that collects the work of Toulouse researchers and
makes it freely available over the web where possible.
This is an author-deposited version published in :
http://oatao.univ-toulouse.fr/
Eprints ID : 11363
To link to this article : DOI:10.1016/j.quaint.2011.12.010
URL : http://dx.doi.org/10.1016/j.quaint.2011.12.010
To cite this version :
De Vleeschouwer, Francois and Pazdur, Anna
and Luthers, Cédric and Streel, Maurice and Mauquoy, Dmitri and
Wastiaux, Cécile and Le Roux, Gaël and Moschen, Robert and
Blaauw, Maarten and Pawlyta, Jacek and Sikorski, Jarek and
Piotrowska, Natalia A millennial record of environmental change in
peat deposits from the Misten bog (East Belgium). (2012)
Quaternary International, vol. 268 . pp. 44-57. ISSN 1040-6182
Any correspondance concerning this service should be sent to the repository
administrator:
staff-oatao@listes-diff.inp-toulouse.fr
A millennial record of environmental change in peat deposits from the Misten bog
(East Belgium)
François De Vleeschouwer
a,*, Anna Pazdur
a, Cédric Luthers
b, Maurice Streel
b, Dmitri Mauquoy
c,
Cécile Wastiaux
d, Gaël Le Roux
e,1, Robert Moschen
f, Maarten Blaauw
g, Jacek Pawlyta
a, Jarek Sikorski
a,
Natalia Piotrowska
aaGADAM Centre, Institute of Physics, Silesian University of Technology, Gliwice, Poland
bU.R. Paléobotanique, Paléopalynologie et Micropaléontologie, Géologie, ULg, Liège, Belgium
cSchool of Geosciences, University of Aberdeen, Aberdeen, United Kingdom
dStation Scientifique des Hautes Fagnes, ULg, Robertville, Belgium
eU.R. Argiles, Géochimie et Environnements Sédimentaires, Géologie, ULg, Liège, Belgium
fInstitute of Bio- and Geosciences 3: Agrosphere, Jülich Research Centre, Germany
gSchool of Geography, Archaeology and Palaeoecology, Queen’s University Belfast, United Kingdom
a b s t r a c t
In this study, palaeoenvironmental changes recorded in the top metre of a peat profile (Misten bog, East Belgium) were investigated using a multiproxy approach. Proxies include bulk density, Ti and Si content, pollen, macrofossils,d13C on specific Sphagnum stems, and d13Ced18O on Sphagnum leaves. A high-resolution chronology was generated using210Pb measurements and 2214C AMS dates on carefully selected Sphagnum macrofossils.d13C only records large change in mire surface wetness. This is partly
due to the fact that the core was taken from the edge of a hummock, which may make it difficult to track small isotopic changes. Thed13C signal seems to be dependent upon the Sphagnum species composition. For example, a change between Sphagnum section Cuspidata towards Sphagnum imbricatum causes a significant drop in thed13C values. On the whole, the C and O isotopes record two shallow pool phases during the 8the9th and the 13th centuries. Pollen and atmospheric soil dust (ASD) fluxes records increased human occupation in the area. There may be some climatic signals in the ASD flux, but they are difficult to decipher from the increasing human impact (land clearance, agriculture) during the last millennium. The variations in the proxies are not always synchronous, suggesting different triggering factors (temperature, wetness, windiness) for each proxy. This study also emphasizes that, compared to studies dealing with pollution using geochemical proxies, palaeoclimatic inferences from peat bogs need as many proxies as possible, together with highly accurate and precise age-models, in order to better understand climate variability and their consequences during the Holocene.
1. Introduction
Tracking environmental changes in peat bogs during the Holo-cene, and more specifically in the last millennium, is relatively complex, because this period has seen human impacts super-imposed upon abrupt climatic changes, often resulting in complex palaeoenvironmental signals. Given this, the need for multiproxy approaches has been emphasized in recent studies (e.g.Yeloff and
Mauquoy, 2006; Barber, 2007; Blaauw et al., 2010a). However, although some studies show synchronous changes in either climate- or human-driven changes (see e.g. discussion inBarber, 2007), others show discrepancies in the timing of events (e.g.
Charman et al., 2009;De Vleeschouwer et al., 2009).
In peat bogs, short-term (i.e. less than 100 years) events are difficult to date with precision because very high-resolution chronologies are required. This focus on dating control is rarely undertaken because dating effort is often concentrated on long-term trends in peat stratigraphy. This is problematic, because less attention is given to high-resolution dating of abrupt, short-term events, which are crucial for a better understanding of their link with climate variations and cycles, and their impact on the envi-ronment. Moreover, the potential to generate very high-resolution
chronologies by modern AMS radiocarbon techniques using aboveground plant macrofossils (Mauquoy et al., 2008) offers the possibility to go beyond the Holocene trend and focus on abrupt, short-term events by analysing a greater number of thinner peat slices (Amesbury et al., 2010) and by concentrating an increased number of dates within a limited time period (e.g.Mauquoy et al., 2002;Blaauw et al., 2007). On the other hand, there has been recent discussion on whether it is possible to obtain centennial or decadal resolution using peat archives (e.g.Barber, 2007;Amesbury et al., 2010), mainly because the age-model, as well as the number of dated intervals, will greatly influence the final age resolution. In most cases, because calibrated dates often have asymmetric prob-ability distributions spanning decades to centuries, a mean age derived from an age-model will not always represent the most probable age. Recent advances in age-modelling (e.g.Blaauw et al., 2011,2004), and critical assessment of event synchroneity (e.g.
Blaauw et al., 2007, 2010b; Charman et al., 2009) has pushed forward the need for, if not higher resolution, more accurate ways of representing the chronologies of proxies, in order to best determine 1) the time interval of a single event and 2) the minimal resolution that could be obtained in a peat core.
This paper proposes to assess accurate time intervals to a series of events recorded in proxies, triggered by either human or climatic factors, in a peat core from Belgium. In the Hautes Fagnes (East Belgium), previous studies have already demonstrated the poten-tial of peat archives for reconstructing atmospheric pollution (e.g.De Vleeschouwer et al., 2007) or regional vegetation change (e.g. Persh, 1950; Damblon, 1994). To date, however, there is a clear lack of high-resolution and well-dated multiproxy palae-oenvironmental reconstructions spanning the last millennium in this area. This is crucial in order to improve understanding of past climatic changes for this part of Europe, as the Hautes Fagnes are situated in a key position among European peat deposits, under both oceanic and continental influences. The objectives of this research are: (1) to distinguish natural from anthropogenic signals using a very high-resolution chronology and a trans-disciplinary, multiproxy approach; (2) to identify abrupt climatic changes from
the long-term trends; and (3) to identify the nature of climatic changes, i.e. wetter or drier, warmer or colder, more or less windy. This is achieved by studying a 1-m Sphagnum-dominated peat core using various proxies: pollen, plant macrofossils, stable carbon and oxygen isotopes, titanium (Ti) and silicon (Si) contents, and
14
Ce210Pb dating. Besides the main objectives, this study also aims to better understand the role of Sphagnum species composition on the
d
13C signal and to improve understanding of thed
18O signal in Sphagnum mosses.2. Site location
The Misten bog is located in the Hautes Fagnes Plateau (East Belgium,Fig. 1). The average precipitation is c. 1440 mm/y and the mean annual temperature over the Hautes Fagnes averages 6.7!C
(Mormal and Tricot, 2004). The area contains several peat deposits, parts of which are ombrotrophic. The Misten bog (50!3305000N,
06!
09’5000E, 620 m a.s.l.) contains some of the deepest peat deposits
of this area, with more than 7 m of peat in its centre (Fig. 1). It was drained from its northern to its southern border by a single ditch dug in 1774 AD (seeNekrassoff, 2007), and subsequently moder-ately dammed around 1970. The outer rim of the bog has also been cut, mainly in the northeastern and southeastern edges. The first cuttings took place around the XIVth century and were of very small scale (Hindryckx and Streel, 2000). Intensification of cutting took place during the XVIIth and XVIIIth centuries and stopped during the Second World War. These systematic cuttings may have affected the bog hydrology since the middle of the XVIIIth century. However, the extent of damage towards the centre of the bog, where the core was taken, remains unclear (Hindryckx, 2000;
Hindryckx and Streel, 2000).
Several features confirm the ombrotrophic nature of the Misten bog. First, it is located on an isolated plateau (seeFig. 1), which prevents the bog from receiving lateral mineral inputs, e.g. through small streams. The bog vegetation is mainly composed of Sphagnum spp., built up into low hummocks, which is also characteristic of ombrotrophic systems. However, the surface Sphagnum vegetation
500 m
N
620 m
Eupen
Monschau
0.0
0.8
1.5
2.5
3.5
4.5
5.5
6.5
8.5 m
Not prospected7.5
Peat
Thickness
MIS-08-06WZ
O
N
E
D
Z
O
N
E
B
276200 276400 276600 276800 277000 277200 277400 277600 277800 278000 278200 141600 141800 141400 141200 141000 140800 140600 140400 140200Lambert Belge 72 Coordinates 50 km
Fig. 1.The Misten bog (south of the Eupen-Monschau road) and the location of the MIS-08-06W peat profile. Peat thickness afterWastiaux and Schumacker (2003). Dotted lines are
access pathways. Red lines are the cutting fronts (stopped during the 2nd world war). The yellow stripe represents the main drain, dug in 1774 and active until 1970). (For interpretation of the references to colour in this figure legend, the reader is referred to the web version of this article.)
has been recently invaded by abundant amounts of Erica tetralix, Calluna vulgaris and Vaccinium spp. shrubs, reflecting the recent drying of the bog and its evolution towards a peat moor. Geochemical analyses also confirm ombrotrophy (De Vleeschouwer et al., 2007). Finally, the plant macrofossil record of the entire core (seeFig. 4) is also consistent with the presence of acidic, nutrient-poor conditions characteristic of ombrotrophic peat bogs.
3. Materials and methods 3.1. Coring and subsampling
A 1-m core was retrieved from the centre of Misten bog (Fig. 1) in February 2008 using a plain titanium 15 # 15 # 100 cm War-denaar corer (Wardenaar, 1986). The peat profile was collected from the edge of a hummock, in order to register a maximum of vege-tation change in the profile. The core was then wrapped in plastic film and placed into a wooden box with the same dimensions to allow for safe transport. Peat samples were stored in a freezer ($20!C) at the Institute of Earth Sciences (University of Heidelberg,
Germany) and sub-sampled soon after. The core was sliced frozen using a stainless steel band saw at the Institute of Earth Sciences (University of Heidelberg, Germany) with a c. 1 cm increment. The thickness of each slice was then measured again to estimate the loss due to the slicing and to subsequently correct the mid-point depth of each sample. The edges of each slice were removed to avoid any metal contamination by the saw. Each slice was then sub-sampled to provide enough material for each analysed proxy. All the sub-samples were stored in plastic bags in a freezer prior to transfer to the respective laboratories.
3.2. Chronology of the core
The chronological control of the core is based on 2214C AMS
dates of selected plant macrofossils, following the protocols developed byKilian et al. (1995)andMauquoy et al. (2004). The selection of aboveground plant macrofossils ensures that accurate dates are assigned (i.e. free of rootlets and therefore of contami-nation). These macrofossils mainly consisted of Sphagnum spp. stems and opercula. In seven samples, C. vulgaris stems and/or
E. tetralix stems and seed boxes were selected as the amount of Sphagnum spp. was not sufficient to provide large enough samples for dating. All samples were prepared at the GADAM Centre (Gliwice, Poland) using acidealkalieacid washing (to remove any carbonate, bacterial CO2 and humic/fulvic acid), drying and
graphitisation followingGoslar and Czernik (2000). Samples were measured at the Poznan radiocarbon Laboratory (Poznan, Poland) following the protocol fromGoslar et al. (2004)and at the Rafter Radiocarbon Laboratory (Lower Hutt, New Zealand) following
Zonderyan et al. (2007). Results are reported inTable 1. Lead 210 was also measured in recent layers (down to 18 cm depth) after
210Po extraction from 2 g of dry peat powder spiked with208Po
using a sequential HF-HNO3eHCl digestion after peat ashing (De Vleeschouwer et al., 2010). Measurements were performed using an
a
-spectrometer (Canberra model 7401) for two days for each sample in order to obtain sufficient accuracy. The results of the calculation were corrected for the radioactive decay of208Po since the moment of its calibration, and the decay of210Pb since the moment of polonium extraction from the sediment. More details about the 210Pb measurements at the GADAM Centre (Gliwice, Poland) can be found inSikorski and Bluszcz (2008and references therein). The Constant Rate of Supply (CRS) model (Appleby, 2001) was then applied in order to build the 210Pb age-model. Uncertainties were calculated using the propagation of errors technique according to ISO GUM (Guide to the expression of Uncertainty in Measurement,www.iso.org). The modelled ages are reported inTable 2. The raw data, including background measure-ments of deeper samples, are reported inDe Vleeschouwer et al. (2010).3.3. Bulk density, Ti content
Samples were first freeze-dried following the protocol described inLe Roux and De Vleeschouwer (2010). To enable the volume-measurement of each slice, bulk density sub-samples were based on a c. 4 cm base # 4 cm height triangle cut out of each frozen slice (see Section3.1). The dimension of each frozen triangle (including thickness) was measured to estimate the volume. The bulk dry density was calculated by weighing each sub-sample after water-removal by freeze-drying and by dividing its weight by its Table 1
Radiocarbon sample type and results.
Depth (cm) Sphagnum spp. Calluna vulgaris Erica tetralix Age Error Lab. Code
Stem Branches þ leaves Capitulum Branch Leaf Branch Seed box Uncal BP y
12.3 1 1 1 185 30 GdA-1380 28.1 9 20 2 215 30 GdA-1383 29.4 13 425 30 GdA-1620 30.7 15 450 30 GdA-1509 33.3 15 490 45 GdA-1510 35.8 10 10 460 30 GdA-1621 37.1 4 430 35 GdA-1622 38.3 20 620 30 GdA-1623 39.6 20 645 30 GdA-1624 40.8 25 2 355 30 GdA-1381 42.1 700 30 GdA-1427 43.4 15 3 650 40 GdA-1382 46.2 2 3 13 2 2 805 35 GdA-1384 47.6 21 7 840 30 GdA-1385 49.1 17 5 880 30 GdA-1388 57.2 935 30 GdA-1428 57.2 22 28 900 30 GdA-1386 67 32 4 1 1 1110 40 GdA-1387 75.5 1 10 1 5 5 1280 40 GdA-1389 78.3 25 14 1 2 1 1290 30 GdA-1390 86.8 7 16 8 1 1 1345 30 GdA-1391 99.4 31 15 3 0 2 1530 35 GdA-1392
volume. They were subsequently ground using a Retsch Mixer Mill, agate balls and plastic vials, prior to their chemical analyses.
The Ti content was measured on 1 g of dried and homogenised peat powder using a Brüker S8-Tiger wavelength-dispersive X-Ray Fluorescence (XRF) analyzer. The powder was analysed in 40 mm diameter plastic cups, with a 2.5-
m
m mylar film at the base. The XRF was calibrated with 27 certified reference materials, mostly con-sisting of organic matrices such as plant leaves, lichens, peat, organic sediments and coals (NIST-1515, 1547, 1570a, 1573a, 1575a, 1632b, 1635, 2718, 8437, 8438; BCR-60, 62, 129, 482; NIMT-UOE-FM-001; NIES-1, 3, 7, 8, 9, 10a, 10b, 10c; SARM-20; NJV-942 and 943). The detection limits was 2m
g g$1while the standard devia-tions was 23m
g g$1. Results are reported inTable 3.3.4. Plant macrofossils
Plant macrofossil samples from MIS-8-06W were boiled with 5% KOH and sieved (mesh diameter 125
m
m). Macrofossils were scanned using a binocular microscope (# 10e50), and identified using an extensive reference collection of type material (Mauquoy and van Geel, 2007). Volume percentages were estimated for all components with the exception of seeds, Eriophorum vaginatum spindles, Sphagnum spore capsules, and charcoal particles, which were counted and expressed as the number (n) present in each sub-sample. Zonation of the macrofossil diagrams was made using psimpoll 4.25 (optimal splitting by information content).3.5. Pollen analyses
In order to distinguish between human and climate impacts in the record, several samples were studied for their arboreal and selected non-arboreal pollen content. For each sample, 2 g of fresh material was dissolved in 10% HCl after the addition of exotic Lycopodium spp. tablets for quantification. Treatment with KOH was omitted as this may damage pollen microfossils in addition to the added Lycopodium spores. The residues were then dissolved in 96% acetic acid and treated by acetolysis. After centrifugation, the solutions were filtered through 200
m
m and 12m
m mesh sieves. The residues were washed in 96% alcohol and transferred in glycerin to be mounted on glass slides.3.6. Stable isotopes 3.6.1. Specimen selection
Two types of specimen were selected: species/section specific Sphagnum macrofossils and Sphagnum spp. debris.
For species/section specific Sphagnum, stems of Sphagnum imbricatum (42 samples) and Sphagnum papillosum (9 samples), in addition to stems of Sphagnum section Cuspidata (7 samples) were collected using watchmakers forceps from samples which had first been treated with 5% KOH, sieved and rinsed with distilled water. Following the recommendations ofLoader et al. (2007)only stems were selected and where necessary, any attached leaves were removed. The stems were placed into sealed phials.
To separate species/section specific Sphagnum debris from the peat, each sample was successively sieved through 2000, 630, 355, and 200
m
m mesh sizes with a minimum of 5 L of deionised water (Daley et al., 2010). Each size fraction was examined for its composition under a stereoscopic binocular microscope (Nikon SMZ 2B). The size fraction of 355e630m
m has been identified to almost exclusively consist of Sphagnum spp. leaves. Therefore, this size fraction was used for cellulose extraction and stable isotope measurement. Cellulose extraction from the individual samples followed an improved extraction method based on sample bleaching with sodium chlorite (Ménot and Burns, 2001), followed by cellulose dissolution in cuprammonium solution ([Cu(NH3)4](OH)2) and re-precipitation using sulphuric acid(Wissel et al., 2008). This approach achieves pristine cellulose not by removing any contaminants from the cellulose, but by dis-solving the cellulose from bulk organic matter. This way, contam-inations of Sphagnum spp. cellulose with small amounts of minerogenic matter like silt and clay and/or biogenic opal could be completely excluded. The obtained cellulose was highly homoge-neous, ensuring isotopic homogeneity when using small sample amounts for isotope measurements.
3.6.2. Analytical methods
Stable carbon isotope analyses were carried on two types of specimen: 1) species/section specific Sphagnum stems and 2) Sphagnum cellulose from the sieve fraction of 355e360
m
m (Sphagnum spp. leaves). Oxygen isotope analyses were performed on only the second type of specimen.The stable carbon isotope measurements of species/section specific Sphagnum stems were undertaken on bulk plant material, because separation of an adequate amount of stems for cellulose extraction was too time consuming and not possible for each sample.
The stable carbon isotope measurements of both species/section specific Sphagnum stems and Sphagnum cellulose were measured by online combustion of c. 30
m
g dry stems and 200e300m
g dry cellulose, respectively. Samples were weighed into tin foil cups and combusted at 1080!C using an EuroEA elemental analyser (EuroVector Instruments, Italy) to generate CO2for an interfaced IsoPrime
continuous flow isotope ratio mass spectrometer (GV Instruments, United Kingdom). Each sample was measured once and approxi-mately every eleventh sample was measured twice to check repro-ducibility. For species/section specific Sphagnum stems, each sample was measured in triplicate to check the reproducibility.
Oxygen isotope ratios of Sphagnum cellulose were measured by online combustion of 275 & 20
m
g dry cellulose weighed into silver foil cups, which were then vacuum-dried and subsequently pyro-lysed at 1450!C using a high temperature pyrolysis analyser (HT-O,HEKAtech, Germany) to generate CO for the same interfaced IRMS. For the determination of oxygen isotopes, each sample was measured at least three times.
Results are reported using the conventional
d
-notation in per mill vs. V-PDB for carbon and V-SMOW for oxygen. USGS24 graphite and IAEA-C3 cellulose were used as certified reference materials. The overall precision of replicate analyses of samples is estimated to be better than &0.22& and &0.1& ford
13Cstemandd
13Ccell, respectively and better than &0.3& ford
13Ocell(1s
).Table 2
Lead 210 modelled ages for each sample down to 17.5 cm. Raw data (i.e.210Pb
activities) are published elsewhere (De Vleeschouwer et al., 2010).
Depth (cm) Top Age (AD) Uncertainty (y)
0.97 2006 2 2.64 2005 2 3.8 2003 2 4.86 2002 2 5.98 2001 2 7.19 1999 2 8.45 1994 2 9.72 1990 2 11 1980 2 12.3 1969 3 13.7 1952 4 15 1930 5 16.3 1912 7 17.5 1745 9
Table 3
Bulk density, Ti content, stable carbon and oxygen results of the peat core. Mid-point depth (cm) Density (g cm$3) Ti (mg g$1) Species/section used ford13C stem d13C stemvs. V-PDB (&) d13C stemvs. V-PDB standard deviation (&) d13C cellvs. V-PDB (&) d13C cellvs. V-PDB standard deviation (&) d18O cellvs. SMOW (&) d18O cellvs. SMOW standard deviation (&) 0.97 261 $21.59 0.06 28.23 0.06 2.64 0.019 18 $25.08 0.20 25.23 0.20 3.80 0.016 17 S. papillosum stems $27.58 0.14 $24.56 0.28 25.18 0.28 4.86 0.015 8 S. papillosum stems $28.24 0.13 $23.82 0.11 25.23 0.11 5.98 0.022 63 S. papillosum stems $27.58 0.30 $25.37 0.28 25.18 0.28 7.19 0.065 164 S. papillosum stems $26.98 0.14 $25.48 0.38 24.93 0.38 8.45 0.046 183 S. papillosum stems $28.21 0.15 $26.07 0.10 25.07 0.10 9.72 0.109 617 S. papillosum stems $27.57 0.13 $23.23 0.35 28.85 0.35 11.0 0.091 509 $23.57 0.10 26.49 0.10 12.3 0.145 638 $23.46 0.10 27.01 0.10 13.7 0.154 552 S. imbricatum stems $27.26 0.14 $22.54 0.42 29.16 0.42 15.0 0.144 455 $22.95 0.27 27.99 0.27 16.3 0.112 269 S. imbricatum stems $26.67 0.30 $23.67 0.17 26.80 0.17 17.5 0.094 220 S. imbricatum stems $28.03 0.30 $23.48 0.25 26.70 0.25 18.8 0.074 194 S. imbricatum stems $25.78 0.15 $24.30 0.39 26.55 0.39 20.2 0.096 239 S. imbricatum stems $27.78 0.13 $23.49 0.02 27.34 0.02 21.5 0.078 209 $23.35 0.09 26.84 0.09 22.9 0.108 216 S. imbricatum stems $26.26 0.13 $22.99 0.06 27.95 0.06 24.2 0.124 216 S. imbricatum stems $27.43 0.15 $23.78 0.06 27.70 0.06 25.5 0.112 204 S. imbricatum stems $29.59 0.30 $23.28 0.10 27.13 0.10 26.7 0.130 210 S. papillosum stems $26.18 0.15 $23.24 0.05 27.47 0.05 28.1 0.109 196 S. imbricatum stems $24.90 0.13 $23.07 0.43 26.48 0.43 29.4 0.080 185 S. papillosum stems $25.14 0.14 $23.16 0.29 26.90 0.29 30.7 0.102 174 32.0 0.088 236 $23.81 0.04 26.46 0.04 33.3 0.101 280 S. imbricatum stems $26.87 0.15 $23.24 0.28 26.87 0.28 34.5 0.098 216 S. imbricatum stems $24.70 0.13 $23.75 0.09 27.68 0.09 35.8 0.093 283 S. imbricatum stems $26.44 0.13 $23.52 0.01 27.61 0.01 37.1 0.093 237 $23.44 0.32 26.91 0.32 38.3 0.082 201 S. imbricatum stems $26.80 0.15 $22.30 0.33 26.52 0.33 39.6 0.073 144 $22.96 0.09 27.32 0.09 40.8 0.072 284 S. imbricatum stems $26.45 0.30 $21.71 0.22 26.54 0.22 42.1 0.078 279 S. imbricatum stems $26.06 0.14 $21.91 0.11 26.63 0.11 43.4 0.065 262 S. imbricatum stems $25.90 0.30 $23.62 0.03 24.80 0.03 44.8 0.067 140 S. s. Cuspidata stems $26.00 0.30 $23.50 0.14 23.55 0.14 46.2 0.074 179 S. s. Cuspidata stems $26.35 0.14 $22.82 0.04 24.58 0.04 47.6 0.059 142 S. s. Cuspidata stems $29.50 0.30 $22.62 0.08 25.40 0.08 49.1 0.092 321 S. imbricatum stems $27.65 0.13 $23.86 0.19 27.18 0.19 50.5 0.075 136 S. imbricatum stems $27.51 0.14 $23.35 0.42 26.01 0.42 51.8 0.054 113 S. imbricatum stems $26.33 0.14 $22.79 0.09 26.97 0.09 53.1 0.046 81 S. imbricatum stems $25.83 0.14 $23.05 0.55 26.70 0.55 54.4 0.050 42 S. imbricatum stems $27.80 0.14 $22.29 0.06 26.22 0.06 55.8 0.043 36 S. imbricatum stems $27.58 0.15 $22.24 0.20 25.90 0.20 57.2 0.085 164 S. imbricatum stems $25.80 0.13 $23.23 0.17 27.39 0.17 58.5 0.045 121 S. imbricatum stems $30.55 0.13 $23.29 0.21 26.42 0.21 59.7 0.048 90 60.9 0.052 60 S. imbricatum stems $27.43 0.14 $24.11 0.13 26.35 0.13 62.2 0.075 207 S. imbricatum stems $27.87 0.13 $23.27 0.22 27.08 0.22 63.5 0.061 105 S. imbricatum stems $27.17 0.13 $23.49 0.20 26.94 0.20 64.7 0.058 37 S. imbricatum stems $28.71 0.15 $23.94 0.17 26.50 0.17 65.8 0.060 52 S. imbricatum stems $27.08 0.13 $23.20 0.40 26.70 0.40 67.0 0.059 87 S. s. Cuspidata stems $25.53 0.30 $23.15 0.14 26.01 0.14 68.4 0.077 96 $22.76 0.10 26.47 0.10 69.8 0.078 87 $21.58 0.02 26.20 0.02 71.1 0.071 88 72.5 0.064 88 S. s. Cuspidata stems $18.68 0.13 $17.82 0.16 24.72 0.16 74.1 0.076 56 S. s. Cuspidata stems $19.05 0.14 $18.42 0.25 24.03 0.25 75.5 0.075 161 S. s. Cuspidata stems $19.96 0.13 $21.73 0.05 26.26 0.05 76.9 0.076 175 S. imbricatum stems $20.62 0.15 $22.28 0.24 26.03 0.24 78.3 0.084 120 S. imbricatum stems $24.30 0.30 $22.82 0.08 26.32 0.08 79.7 0.078 86 S. imbricatum stems $24.84 0.30 $22.76 0.21 26.28 0.21 81.2 0.040 11 S. imbricatum stems $26.05 0.13 $22.78 0.03 27.00 0.03 82.6 0.045 9 S. imbricatum stems $28.05 0.14 $22.80 0.09 26.08 0.09 84.1 0.057 19 S. imbricatum stems $28.86 0.30 $23.20 0.26 25.65 0.26 85.4 0.078 50 S. imbricatumstems $28.82 0.15 $23.25 0.33 26.16 0.33 86.8 0.081 71 $23.63 0.20 27.04 0.20 88.2 0.088 83 S. imbricatum stems $27.43 0.14 $23.68 0.60 26.37 0.60 89.6 0.085 79 S. imbricatum stems $27.42 0.14 $23.34 0.16 26.71 0.16 91.0 0.073 65 S. imbricatum stems $26.00 0.30 $23.25 0.18 26.35 0.18 92.3 0.057 45 S. imbricatum stems $27.86 0.15 $23.26 0.11 26.53 0.11 93.7 0.077 77 $24.05 0.26 26.22 0.26 95.1 0.058 22 S. imbricatum stems $26.44 0.13 $23.16 0.25 26.15 0.25 96.4 0.057 19 S. imbricatum stems $26.26 0.14 $22.94 0.25 25.79 0.25 97.9 0.054 33 S. imbricatum stems $27.17 0.15 $23.48 0.49 26.63 0.49 99.4 0.067 46 $23.85 0.36 26.17 0.36
Coal, oil and gas are of organic origin and thus depleted in13C. Anthropogenic fossil fuel burning, which increased the concentra-tion of atmospheric CO2, lowered the
d
13C value of air by about 1.7&since the onset of industrialisation. Therefore, all Sphagnum
d
13C cel-lulosevalues of post-1850 AD samples were corrected by adding ad
13Ccorrection factor interpolated from measured and estimated annual data (Leuenberger, 2007). Results are reported inTable 3.
3.7. Data comparison
In order to compare macrofossil results and stable isotope results, two statistical tests were performed, as described below. Prior to analysis, the data were checked for normality, but even after transformation (log and square root) a KolmogoroveSmirnov test confirmed that the distributions were significantly not normally distributed. The effect of species/section composition of Sphagnum was therefore first explored using the KruskaleWallis test (test statistic H), and post hoc tests were conducted using the Manne Whitney test (test statistic U). Both tests were undertaken using SPSS v.17 software. Partial correlations were also calculated between standardised values of the DCA axis 1 scores,
d
13C of Sphagnum cellulose, andd
13C of Sphagnum species/section specific stems.4. Results and discussion
4.1. Chronology and accumulation rates
An age-model was constructed using the14C dates and the CRS modelled210Pb ages. Radiocarbon dates were translated to calendar distributions using the IntCal09 calibration curve (Reimer et al., 2009). Through the dated depths, age-depth models were drawn consisting of 50 1-cm thick sections of piece-wise linear accumu-lation, with the accumulation rate of each section depending somewhat on the previous section (an autoregressive process with a degree of “memory”) (Blaauw et al., 2011). This process resembles the Bpeat routine ofBlaauw and Christen (2005), although it uses many more sections and thus results in more flexible age-depth models. Using an iterative Markov Chain Monte Carlo process, several thousands of independent likely age-depth models were constructed, each of them assigning calendar ages to all depths (dated or non-dated). From these models, calendar age distribu-tions were constructed for all depths, and depicted as grey-scales where more likely calendar ages are depicted by darker grey levels (Fig. 2). Less secure sections of the age-depth model are indicated by lighter grey spread over larger areas. The same age-models can be used to produce grey-scale plots of proxy values (see discussion andFig. 6aeb), where the calendar scale uncer-tainties are also indicated using grey-scales (Blaauw et al., 2007).
From the base (ca. 500 AD) of the peat profile towards 25.5 cm (around 1600 AD), the mean peat accumulation rate continuously decreases from c. 1 mm y$1, to 0.32 mm y$1. In the first half of the profile however, the peat accumulation rate peaks around 600e670 AD (1.4 mm y$1), 690e850 AD (1.6 mm y$1), 870e1030 AD (1.1 mm y$1) and 1130e1200 AD (0.9 mm y$1). Above 25.5 cm, and until the top, the accumulation rate increases drastically and marks the progressive shift from the catotelm to the acrotelm, charac-terised by living plants and uncompressed peat.
4.2. Palaeoenvironmental, palaeoclimatic and human indicators 4.2.1. Pollen evidence of human impact and possible climatic changes
The lower part of the pollen diagram (99.4 cme53.1 cm), where Fagus is equal to or higher than 20% (Fig. 3), belongs to Zone IX as defined by Firbas (1949). However, the Fagus curve is strongly
influenced by abundances of Alnus and, to a lesser extent, by Betula, two species growing on the bog (assuming Betula may be Betula pubescens). Above, the Zone X ofFirbas (1949)starts with a clear increase of Quercus and a subsequent decrease of Fagus.
Here, a subdivision of Zones IX and X based on tree ecology is attempted. Zones 1 and 2 have high values (>5%) of Carpinus. In zone 1, Alnus is also commonly more abundant than Betula, indi-cating a more humid climate than in zone 2. In Zone 3, Fagus and Quercus relative abundances oscillate between 15% and 30%, with a general slow decreasing trend of Fagus values. These values are however strongly dependent upon the important values of Betula and its possible species. Betula pendula is abundant on relatively dry acidic soils, whereas B. pubescens may expand on the bog during periods of low Sphagnum abundance. Therefore, Zone 3 may correspond to the drier climatic conditions of the Medieval Warm Period (MWP). Quercus values clearly increase above Fagus values during the transition from Zones 3 to 4, and clearly dominate in Zone 4. The dominance of Quercus may be partly explained by the fact that it is used as cattle fodder, whereas its bark and wood were intensively used. On the other hand, Fagus is not only unable to survive wood fires, but is also strongly influenced by regular cutting to produce charcoal. This industry is known from the XVIth century in the Rurbusch forest, a few km to the south of the Misten bog (Liégeois-Lemaitre, 1957). Fagus cannot therefore compete with other trees such as Quercus, which regenerates more easily from stumps. The rise of Pinus sylvestris up to c. 10% in the upper half of Zone 4 may correspond to its first introduction in the nearby forest Hertogenwald (near Eupen) around 1750 (Pahaut and Oldenhove de Guertechin, 1962). Zone 5 (second half of the XIXth century) is characterised by a significant increase of P. sylvestris and the occurrence of Picea abies, both species having been extensively planted in the area. The main changes in Poaceae and Cerealia curves occur in the transition from Zone 2 to Zone 3, where their respective abundances remain generally below 10% and 6%. Cerealia peaks (>10%) in Zone 4, while Poaceae maximum abundances (>30%) are found in Zone 5. Plantago (mainly Plantago lanceolata)
Fig. 2.Age-model produced by BACON software (Blaauw et al., 2011) coupling both14C
and210Pb results. Age-models are based on 50 1-cm thick sections of linear
accumu-lation, with a degree of memory between each section. Grey-scales indicate all likely age-depth models, and dotted lines indicate the 95% confidence ranges. Shapes show
calendar age distributions of individual dates (calibrated distributions for the14C
5
4
3
2
1
1 5 20 25 30 35 40 45 50 55 60 65 70 57 80 85 90 95 1 0 0 2 0 Al nu s 2 0 Be tu la 2 0 C or yl us 2 0 4 0 6 0 Fa gu s 2 0 C ar pi nu s 2 0 4 0 Q ue rc us Ti lia 2 0 Pi nu s Pi ce a Sa lix Fr axi nu s U lm us 2 0 P oa ce ae C er ea le s P la nt ag o 2 0 4 0 C yp er ac ea e 2 0 C al lu na O th er Er ica ce ae P ol yp od iu m O th er Fi lica le s P te rid iu m 2 0 U nd et ermi ne d 2 0 4 0 6 0 8 0 1 0 0 De pth (c m) T o ta l A P T o ta l N A P Fig. 3. R elati ve arbore al and selecte d non-arbor eal pollen abundances (%) in the Mist en peat pr ofi le. Gr ey ar eas ar e # 4 exagger ations for selected lo w pollen content.Fig. 4. Plant macrofossil diagram of MIS-08-06W . Volume abundances of all components ar e expr essed as per centage s with the ex cep tion of seeds, Eriophorum vaginatum spindles, Sphagnum spore capsules, Cenococcum sclero tia, Meliola ellisii (Type 14) fruit-bodies and charc oal particles, which w er e counted and expr essed as the number (n ) pr esent in each w 5 cm 3sub-sample.
abundance peaks in Zone 5. As it mainly characterises wet meadows and pastures rather than cultivation, Plantago may reflect agricultural changes toward a cattle-based economy on meadows in the area. Cyperaceae (Eriophorum) develops in Zone 2 and is replaced by Calluna and other Ericaceae from the upper part of Zone 4 to Zone 5. This characteristic may indicate a drying of the uppermost peat layers. However Calluna and other Ericaceae are also characteristic of wet and dry heath land. Unless the Calluna and other Ericaceae values are very high, it is therefore difficult to recognize the source area of these species.
4.2.2. Macrofossil evidence for changes in mire surface wetness The results of the plant macrofossil analyses are presented in Fig. 4. The main features of the zones are described in
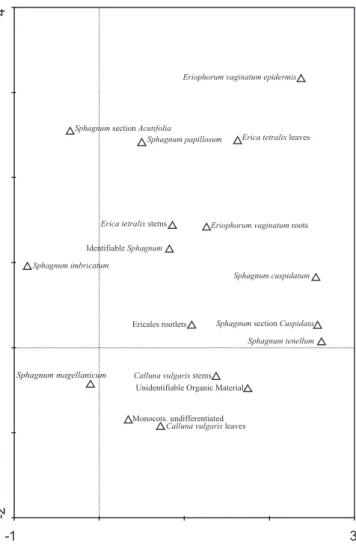
Table 4. In zones MIS-08-06-2 and MIS-08-06-4 increases in mire surface wetness were recorded between 79e68 cm and 48e41 cm. Detrended Correspondence Analysis (DCA) was used to explore the presence of a mire surface wetness gradient in the plant macrofossil data using CANOCO 4.5 (detrending by segments, no transformation and down-weighting of rare species). The DCA ordination is presented inFig. 5. The gradient length of axis 1 is 3.564 and accounts for 28.4% of the variance of the species data. There is a separation between the wet/dry macrofossil components, and evidence for a water level gradient along DCA axis 1. Hygrophilous mire taxa (Sphagnum section Cuspidata, Sphagnum cuspidatum, and Sphagnum tenellum) have high eigenvalues, whereas ‘drier’ indicator species (Ericaceae rootlets and Sphagnum section Acutifolia) have relatively lower values.
4.2.3. Stable isotope signature
The oxygen isotope composition of Sphagnum cellulose (
d
18Ocell)in combination with the stable carbon isotope composition of Sphagnum cellulose (
d
13Ccell) and the species/section specificSphagnum stems (
d
13Cstem) are presented inFig. 6a.In general, the oxygen isotopic composition of cellulose from terrestrial plants depends on: 1) the isotopic composition of the plant’s source water, 2) the enrichment of heavier isotopes in leaf water due to evapotranspiration and 3) the overall biochemical fractionation between source water and cellulose (DeNiro and Epstein, 1979,1981;Sternberg et al., 1986). Due to the consider-ably larger surface of relatively dry hummocks compared to wet hollows and open pools, evaporation is much higher above Sphagnum-covered hummocks than above hollows and pools. The
d
18Owaterin hummocks is therefore significantly more enriched in 18O than in hollows or pools (Ménot-Combes et al., 2002). Anotherexplanation for this difference may be found in heat transfer vari-ations. The water thermal conductivity coefficient ranges from 0.597 W mK$1at 283 K to 0.61 W mK$1at 293 K (Martin and Lang,
1933). However, the thermal conductivity coefficient for living Sphagnum mosses varies from c. 0.030 W mK$1for dry plants to c. 0.55 W mK$1for plants containing about 90% of volumetric water (O’Donnell et al., 2009). Therefore, differences of heat transfer coefficients may also cause differences in evapotranspiration rates in dry hummocks and wet hollows and pools. The solar energy delivered to the water in the pools and very wet plants will be easily transferred, while the same energy delivered into small residual water volumes of the living plants will increase energy of the water molecules to the level necessary for evaporation. Table 4
Macrofossil zonation and main features.
Macrofossil zone Depth (cm) Main features
MIS-08-06W-6 13e0 Following peat charcoal abundance at 12.3 cm, this declines then reduces to zero. Initially abundant Eriophorum vaginatum
epidermis is replaced by Sphagnum papillosum. Peak values of Erica tetralix stems and seeds occur in this zone.
MIS-08-06W-5 41.4e13 Initial high values of Sphagnum imbricatum are followed by high abundances of Sphagnum papillosum with the first
appearance of Sphagnum magellanicum between 33.3 and 26.7 cm. Monocots undifferentiated and Sphagnum imbricatum then alternate as the predominant components of the peat matrices. Marked increase in the number of charcoal fragments.
MIS-08-06W-4 48.4e41.4 Second phase of abundant Sphagnum section Cuspidata leaves with peak recorded values of Sphagnum cuspidatum.
MIS-08-06W-3 67.7e48.4 Marked increase of Sphagnum imbricatum which records high abundances throughout. Moderate increase in charcoal
and a minor presence of Sphagnum section Cuspidata leaves between 57.2 and 55.8 cm
MIS-08-06W-2 79e67.7 Abundant Sphagnum section Cuspidata leaves followed by abundant Eriophorum vaginatum epidermis.
Reduced charcoal present.
MIS-08-06W-1 99.4e79 Abundant Sphagnum section Acutifolia leaves are replaced by abundant Sphagnum imbricatum leaves at 89.6 cm.
A peak of Sphagnum section Cuspidata leaves occurs at 86.8 cm. Relatively high values of charcoal are recorded between 92.3 and 85.4 cm.
-1
3
-2
4
Unidentifiable Organic Material Ericales rootlets
Calluna vulgaris stems
Calluna vulgaris leaves Erica tetralix stems
Erica tetralix leaves
Monocots. undifferentiated
Eriophorum vaginatum roots Eriophorum vaginatum epidermis
Identifiable Sphagnum
Sphagnum section Acutifolia
Sphagnum imbricatum
Sphagnum magellanicum
Sphagnum papillosum
Sphagnum section Cuspidata Sphagnum cuspidatum
Sphagnum tenellum
Fig. 6. (a) DCA axis score 1 of the macro fossil data, d 1 3C cell , d 1 3C stem and d 1 3O cell values and comparison with the D 1 4C curv e fr om R eimer et al. (20 09) .(b) ASD and Cer eals fl ux es compared to the D 1 4C curv e fr om R eimer et al. (20 09) and w et phases record ed by macro fossils and stable Ce O iso topes. Dashed lines symbolize ag e boundaries betw een tw o periods of enhanced fl ux.
As a consequence of both possibilities, the
d
18Ocell time seriesshould provide an indication of past micro-habitat conditions in fens and mires.
At the Misten bog, the
d
18Ocellmeasurements record largevari-ability. Two pronounced excursions towards significantly reduced
d
18Ocellvalues occur during the 8the9th and 13th centuries. The 18O-depleted values presumably indicate phases of reducedevapo-ration and are therefore interpreted as ‘shallow pool phases’ with relatively low evaporative enrichment of the heavier oxygen isotope, resulting in depleted
d
18Owater and thus also in depletedd
18Ocellvalues. Compared to these two hollow or even pool micro-habitat phases, the rest of the
d
18Ocellrecord points to a drier miremicro-topography, with higher evaporative enrichment of the bog surface water from a hummock-like surface.
The two large shifts to depleted
d
18Ocellvalues coincide with thereplacement of S. imbricatum (the dominant species for the last ca. 1500 years) by Sphagnum section Cuspidata (Fig. 4). The occurrence of Sphagnum section Cuspidata is restricted to wet bog surface conditions since this species is mostly found in wet hollows and shallow pools (Barber and Langdon, 2007). The wet/dry bog surface conditions indicated by the
d
18Ocell data are therefore in goodagreement with the macrofossil interpretations.
d
18Ocellwet phasesoccur in macrofossil Zones 2 and 4, while
d
18Ocelldry phases occurin macrofossil Zones 1, 3 and 5.
The overall value of the enrichment factor between the oxygen isotope composition of source water and moss cellulose (
D
cellewater)from recent bog habitats has been found to be species dependent (Ménot-Combes et al., 2002). Habitat conditions also play a signif-icant role since hollow species, such as Sphagnum section Cuspidata, have been found to provide more constant
D
cellewatervalues thanmore drought-resistant hummock species, thus yielding large variability in their
d
18Ocell values (Ménot-Combes et al., 2002; Zanazzi and Mora, 2005). Therefore, thed
18Ocelltime series found inthe Misten bog record high variability (w5.6&), with oxygen isotope values ranging from 23.6 to 29.2& (Fig. 6a). Approximately half of this variability can be explained by the two ‘shallow pool phases’ with substantially depleted
d
18Ocell values duringthe 8the9th and the 13th centuries. Additionally, during the 20th century, the variability in the
d
18Ocelltimes series is comparativelyhigh and most likely caused by massive human impact on the hydrological conditions at Misten bog (see Section2andHindryckx and Streel, 2000).
Even if the two ‘shallow pool phases’ and the high
d
18Ocellvariability during the second half of the 20th century are not taken into account, the
d
18Ocellvalues of Sphagnum plant materialgrowing on a hummock record relatively high variability. Large uncertainties associated with the
d
18Ocell/d
18Owaterrelationship forbog and mire ecosystems generally limit the use of the oxygen isotope composition of Sphagnum cellulose from peat deposits in palaeoclimate reconstruction (Zanazzi and Mora, 2005). Therefore only the pool phases can be interpreted with certitude in terms of changing hydrological conditions inducing shifts in the
d
18Ocellvalues of w3e4&. This limits the ability to detect environmental and climate variability using the
d
18Ocelltime series. Neverthelessthere is much evidence for two distinct ‘shallow pool phases’ during the 8th to 9th and during the 13th century, and intermediate dry phases.
More comprehensive studies on the carbon isotopic composition of mosses and its relationship to climate provide evidence that the
d
13Ccellof moss cellulose reflects changes in bog and mire surfacewetness (Price et al., 1997;Rice, 2000; Loisel et al., 2009). At the Misten bog, the
d
13Ccellvalues are on average significantly higherthan the
d
13Cstemvalues, whereby the mean isotopic offset of c. 3.4&can be mainly attributed to two different reasons: (1) the stable carbon isotope composition of untreated Sphagnum plant material is
in general lighter than the comparable cellulose values (Me
́ not-Combes et al., 2001) and (2) there is a significant isotopic offset between Sphagnum stems and branches in modern but also fossil Sphagnum plant material (Loader et al., 2007;Moschen et al., 2009). Since (1) the sieved fraction of single leaves, which has been used for cellulose extraction, reflects the isotopic signal of Sphagnum branches and (2) the overall isotopic offset between untreated Sphagnum plant material and cellulose, the isotopic offset between
d
13Cstem andd
13Ccell is easy to explain. Furthermore, becausea limited sample amount was available for stable isotope investiga-tions, the
d
13Cstemvalues were typically based on two to five singleSphagnum stems. Sphagnum stems from different plants of the same species growing at the same time have shown a stable carbon isotope signature varying by 2& or even more (Loader et al., 2007). Conversely, the
d
13Ccell values are based on samples containingseveral thousand single Sphagnum leaves grown throughout several growing seasons and thus are well homogenised and replicable (Moschen et al., 2009;Loisel et al., 2010). Problems associated with changes in the relative proportion of different physical plant or chemical compounds over time can thus be excluded in this type of analysis (Rinne et al., 2005). Therefore, it is expected that the
d
13Ccellvalues will better reflect changes in the bog surfaces wetness than will the
d
13Cstem. Nevertheless, despite the much larger scatter of thed
13Cstemtime series, a large shift to13C-enriched values from ca. 700AD to ca. 800 AD is clearly shown in both time series. It indicates that at Misten bog the
d
13Cstemis also effected by importantenviron-mental and climate variability.
The
d
13Ccelltime series is interpreted to record the mire surfacewetness at the Misten bog during the growing season. Thereby, it can be assumed that the Sphagnum
d
13Ccellvalues are weightedtoward the spring and autumn months, because Sphagnum plants significantly reduces their rate of photosynthesis and thus their relative growth rate during the summer, when the bog surface wetness decreases (Williams and Flanagan, 1996;Rice, 2000). From ca. 500 AD to ca. 750 AD, the
d
13Ccellrecord shows relatively smallfluctuations. A pronounced shift to 13C-enriched values occurs during the 8th and 9th century, pointing to extremely wet condi-tions. Wet conditions during this time span were already suggested by the oxygen isotope composition of the Sphagnum cellulose and macrofossil distribution. Thus, there is much evidence, that during the 8th and 9th century, the area around the Misten bog was a wet and also, a cold environment.
A second peat unit (ca. 13th century) is also almost exclusively composed of Sphagnum section Cuspidata (Fig. 4), pointing to wet conditions. However, whereas both macrofossil and
d
18Ocellpointtowards wet conditions, the
d
13Ccelltime series give no indication ofsuch wet conditions during this phase. Since the stable carbon isotope signature of Sphagnum cellulose is more responsive to hydrological parameters and thus to environmental and climatic conditions rather than to species specific features (Loisel et al., 2009), the non-response of the
d
13Ccell time series during the13th century in the Misten core is rather puzzling. The authors can only speculate that during the 13th century, the bog surface was not as wet as during the 8th to 9th century. That would imply that the species shift to Sphagnum section Cuspidata after ca. 1200 AD is a result of a rising water table, leading to a wetter peat, but not to a real pool development. The hydrological conditions would have not changed as much as during the 8th and 9th century, implying a growth of Sphagnum section Cuspidata under hollow conditions while under shallow pool conditions during the 8th to 9th century. In contrast, an admixture of remains from higher plants to the sieved fraction of Sphagnum leaves which forms the basis of the
d
13Ccellrecord is unlikely to account for the massively13C-enrichedvalues during the 8th and 9th century. Such an admixture would result in higher
d
13C values, since in bog and mire ecosystemshigher plants are in general more enriched in 13C than mosses (Ménot and Burns, 2001). Since the
d
13Cstemtime series, which isclearly attributable to pure Sphagnum plant material, also depict the large shift to13C-enriched values from ca. 700 AD to ca. 800 AD, such an admixture can, however, be excluded.
On the other hand, problems associated with the climatic significance of stable carbon isotope values from hollow and particularly pool species have been described (e.g.Ménot and Burns, 2001;Loisel et al., 2009). Sphagnum species growing on hummocks yield lighter
d
13Ccellvalues than hollow and pool species, becausehummock species photosynthesise under lower water content and thus lower external diffusive resistance (Price et al., 1997). The
d
13Ccellranges reported from recent mire surfaces are significantlylarger in hollow than in hummock samples from the same sites (Price et al., 1997; Loisel et al., 2009). This higher variability can be attributed to a temporary desiccation of hollows and pools commonly occurring during summer. Due to frequently observed repeated desiccation and replenishing of pools and hollows, the range of temperature and moisture conditions are higher when a peat bog micro-environment is a hollow/pool microform. The higher variability in climatic forcing on pools and hollows is thus reflected by a larger isotopic variation in the
d
13Ccell of Sphagnumplants, leading to erroneous interpretation of past environmental and climatic conditions, when hollow and pool species are used for stable isotope investigations. Therefore in isotope-geochemically oriented studies, peat deposits are exclusively sampled in the relatively dry central areas of raised bogs or even on dry hummocks where ombrotrophic species like Sphagnum magellani-cum, Sphagnum fuscum and S. capillifolium (both from section Acu-tifolia) are dominant (e.g.Loader et al., 2007;Lamentowicz et al., 2008,2009;Moschen et al., 2009; Kaislahti Tillman et al., 2010). Exclusion of the
d
13Ccellvalues of these samples from the record,assumed to consist mainly of Sphagnum section Cuspidata, results in significant attenuation of the overall high
d
13Ccell variability(decrease of w2&, acrotelm samples excluded).
To summarise, the large shifts in
d
13Ccelland thed
13Cstemtimeseries both indicate significant environmental changes from a hummock-like microform to a much wetter hollow or even shallow pool micro-topography during the 8th and 9th century. It is also supported by a significant positive correlation (Table 5) between the
d
13Ccelltime series and the macrofossil DCA axis 1scores (r ¼ 0.32, p (two-tailed) <0.01). This correlation increases further when the DCA axis 1 scores and
d
13Cstemwere compared(r ¼ 0.528, p (two-tailed) <0.001). It therefore appears that, bearing in mind the limitations developed above,13C-enriched values (i.e. relatively positive values) are in general associated with periods of increased mire surface wetness, as recorded by the positive DCA axis 1 scores, which supports the results ofLoisel et al. (2010). The
d
18Ocelltime series provide additional evidence for ‘shallow poolphases’ during the 8th to 9th and during the 13th century. However, due to the coring position at the boundary between a pronounced
hummock and a hollow (in order to register the maximum amount of vegetation change), the stable isotope time series are of limited use to explain smaller changes in mire surface wetness.
4.3. Human vs. climatic signals during the last millennium
As Ti is mainly derived from natural soil dust erosion processes (e.g.Hölzer and Hölzer, 1998), it is possible to use it to calculate an atmospheric soil dust content (Shotyk et al., 1998). Because Ti is conservative, it can be assumed that its concentration in ‘soil dust’ is generally similar to its concentration in the upper continental crust (0.40%,McLennan, 2001) and the soils from which it is eroded. Taking into account the peat bulk density and the mean accumu-lation rate for a given sample, it is possible to calculate an atmo-spheric soil dust flux as follows:
ASD!
m
g cm$2y$1"¼100=0:4 # Ti!
m
g g$1"#density!g cm$3" #acc: rate!cm y$1"
Because the age/depth model and the peat accumulation rate was created using BACON, it was used to calculate the ASD flux in order to integrate the age probability distribution in the flux calculation and represent it as a grey-scales. The same approach was used to calculate the Cereal pollen fluxes by multiplying the Cereal concentration of a given sample by the density and the accumulation rate of this sample. Here, these two fluxes are used to reconstruct human activities in the area, in addition to the identi-fication of possible climatic events.
The general Cereal increase during the Middle Ages and the first part of the industrial revolution is due to agriculture and land clearance occurring in this region of Belgium (Fig. 6b). Historical documents mention the development of villages such as Mon-schau (5 km east) in 1198 AD and regional but small-scale defor-estation at the end of the 12th century (Letocart, 1989). These small-scale human interventions involved cutting of Fagus spp., which benefited Quercus spp. development and created small forest openings. The first occupation trace nearby the Misten bog dates back to the middle of the 13th century, when a field parcel 1 km away from the Misten bog was given to the Abbey of Reichestein (Nekrassoff, 2007) and was subsequently cultivated. Another farm was also established 5 km to the north of the Misten bog in the middle of the 14th century (Nekrassoff, 2007). These first nearby agricultural activities are well recorded in the Cereal flux, which increases from ca. 1220 AD to peak around 1320 AD. From the 15th century onwards, historical documents report the increase of agriculture, cattle grazing, wood cutting and charcoal making (Letocart, 1989). This gradual increase in land clearance is also recorded in the relative proportion of non-arboreal pollen, which increases from 20% around ca. 500 AD to 60% around ca. 1900 AD (Fig. 3). The Cereal flux also increases from ca. 1500 AD with 2 peaks at ca. 1540 AD and 1650 AD respectively. Then, the Cereal flux increased continuously. The upper samples are composed of living Sphagnum mosses, which tend to dilute the pollen content, reduce the density and therefore reduce the Cereal flux.
At a first visual correlation, the ASD flux seems similar to the Cereal flux (Fig. 6b). It therefore also reflects the increase of land clearance and agriculture in the region. These activities promote soil erosion and dust availability. However, subtle discrepancies occur between the Cereal and the ASD flux profiles. For example, the ASD profile display a distinctive peak between ca. 1220 AD and 1380 AD, then a second one between 1380 AD and 1620 AD. Moreover, this second peak is not associated with a change in the NAP pollen diagram. It has already been demonstrated that Table 5
Summary of non-parametric tests for Sphagnum spp. composition and weighted
meand13C (& V-PDB) and partial correlations between standardised DCA axis 1
scores vs. meand13C
celland meand13Cstem. Values in bold indicate significant
p values, (0.05.
Test statistics p
Sphagnum species/section
Sphagnum imbricatum, S. papillosum & S. s. Cuspidata H 7.547 0.023
Sphagnum imbricatum & S. papillosum U 123 0.103
Sphagnum imbricatum & S. s. Cuspidata U 66.5 0.021
S. papillosum & S. s. Cuspidata U 14 0.064
DCA axis 1 vs. meand13C
DCA axis 1 vs. meand13C
cell r 0.32 0.01
DCA axis 1 vs. meand13C
climatic instabilities such as the LIA, 8.2ka event or Younger Dryas, can cause abrupt increases in ASD inputs, linked to increased wind storminess (Shotyk et al., 1998;de Jong et al., 2007,2010;
De Vleeschouwer et al., 2009;Le Roux et al., in press). However, the quantification and interpretation of such abrupt mineral increases during the last millennium require special attention, because the consequences (i.e. increased dust fluxes) of abrupt climatic changes are superimposed upon human impacts such as land clearance, soil use and subsequent increased erosion. Therefore, in the ASD flux profile, human impact due to land clearance and agriculture cannot be quantitatively isolated from the global signal, because an intensification of wind strength will result in an increase of trans-port (and deposition) of both mineral and pollen grains. There may therefore be periods of enhanced natural dust deposition super-imposed upon the trend towards intensification of land use. However, it may be too speculative to go into a detailed comparison of these peaks with climatic changes, especially because they are superimposed upon a European (ca. 1000 AD) and local (ca. 1200 AD) land use trend. Therefore, these peaks occur between well-known climatic events such as the Wolf and the Spörer minima (Fig. 6b). In the future a statistical method to test synchronicities of fluxes in BACON will be developed. This should give better insight on the climatic vs. human component of the ASD flux profile.
From the 18th century onwards, systematic cuttings have affected the bog hydrology (Hindryckx, 2000). The palynological zone reconstruction based on several tree-pollen records from the edge towards the centre of the bog shows that peat accumulation may have been affected as early as the middle of the 17th century (Streel et al., 2010). DCA scores and macrofossils may therefore not reflect the natural changes in bog surface wetness during the last 300 years. The mean accumulation rate may also be affected and is indeed low (0.3 mm/y) between ca. 1600 AD and ca. 1850 AD. Therefore, inter-pretations are avoided for this interval, because of both the possible human induced hydrological changes of the bog and the low number of14C dates for this section of the profile, which prevents the crea-tion of an accurate and precise age-depth chronology for this period compared to the rest of the core. From the end of the 19th century, the ASD flux increases drastically, principally because of a significant increase in mineral particles coming from various pollution sources (e.g. land clearance, intensive agriculture and mining activities). In post-1900 AD samples, the industrial revolution and its increased regional land use, but also dust-generating activities (e.g. mining), cause a dramatic increase in the ASD flux. These values are however diluted in the youngest samples, because these samples are made of living, uncompressed Sphagnum in the acrotelm, with high potential growth rates.
5. Summary and conclusion
The 1-m ombrotrophic peat core retrieved from the Misten bog and studied using a multiproxy approach gives insights into palaeoenvironmental changes during the last 1500 years. These are recorded as wet/dry changing conditions by macrofossils and stable CeO isotopes. In addition, a new approach of generating age-models as well as accumulation rates was adopted by using BACON software, in order to generate proxy vs. depth graphs allowing the representation of the age probability distribution. Large shifts in
d
13Ccelland thed
13Cstemtime series, occurring during the 8th and9th century, as well as positive correlation between the
d
13Ccell,d
13Cstem and macrofossil DCA axis 1 scores, indicate changesfrom a hummock-like hollow/shallow pool micro-topography. The
d
18Ocelltime series provide additional evidence for ‘shallow poolphases’ during the 8th to 9th and during the 13th century. Pollen data as well as ASD complement these findings and record human disturbance during the last millennium. The link between dust,
precipitation, temperature, and humidity remains complex during periods of climatic change. More specifically, the ASD peaks do not perfectly match with the main environmental changes recorded by the macrofossil and stable isotopic results from ca. 1100 to 1800 AD, in addition to the human indicators such as Cereal pollen. This may be linked with the fact that the various proxies used here, have different origins, and may therefore have different response times to abrupt climatic changes. Given this, interpreting paleoenvir-onmental signals using both geochemical and biological proxies during the last millennium requires caution because 1) human influences are superimposed upon climatic variation, 2) events shorter than 50 years may not be detectable, even in a very well chronologically-constrained peat core.
Acknowledgements
W. Shotyk (University of Heidelberg) is warmly thanked for loaning his Wardenaar corer and for having let us use the peat-cutting facilities at the IES (University of Heidelberg, Germany). Michel Mathijs and Mona Court-Picon were of great help on the field. We thank Konrad Tudyka and Agnieszka Wiszniowska for their help with the14C sample preparation. Pascal Mertes (DNF-Belgian Forest and Nature Ministry) is also acknowledged for providing us with the official authorization for coring the Misten bog. This research was funded through the ATIS (‘Absolute Time Scales and Isotope Studies for Investigating Events in Earth and Human History’) Marie Curie Transfer of Knowledge project MTKD-CT-2005-029642. The WD-XRF data aquisition was made possible by Richard Bindler (Umeå University) through a research grant from the Kempe Foun-dation, which also provided a post doc fellowship to F. De Vlee-schouwer in 2010. We thank guest editor Paul D.M. Hughes, Jonathan Nichols, and one anonymous reviewer for their useful comments on an earlier version of this manuscript.
References
Amesbury, M.J., Barber, K.E., Hughes, P., 2010. The methodological basis for fine-resolution, multiproxy reconstructions of ombrotrophic peat bog surface wetness. Boreas 10, 1e14.
Appleby, P.G., 2001. Chronostratigraphic techniques in recent sediments. In: Last, W.M., Smol, J.P. (Eds.), Tracking Environmental Change Using Lake Sedi-ments. Basin Analysis, Coring and Chronological Techniques, vol. 1. Springer, pp. 171e203.
Barber, K.E., Langdon, P.G., 2007. What drives the peat-based palaeoclimate record? A critical test using multi-proxy climate records from northern Britain. Quaternary Science Reviews 26, 3318e3327.
Barber, K.E., 2007. Peatland records of Holocene climate change. In: Elias, S.A. (Ed.), Encyclopedia of Quaternary Science. Elsevier, Oxford, pp. 1883e1894. Blaauw, M., Christen, J.A., 2005. Radiocarbon peat chronologies and environmental
change. Applied Statistics 54, 805e816.
Blaauw, M., van der Plicht, J., van Geel, B., 2004. Radiocarbon dating of bulk peat samples from raised bogs: non-existence of a previously reported reservoir effect? Quaternary Science Reviews 23, 1537e1542.
Blaauw, M., Christen, J.A., Mauquoy, D., van der Plicht, J., Bennett, K.D., 2007. Testing the timing of radiocarbon-dated events between proxy archives. The Holocene 17, 283e288.
Blaauw, M., Bennet, K.D., Christen, J.A., 2010a. Random walk simulations of fossil proxy data. The Holocene 20, 645e649.
Blaauw, M., Wohlfarth, B., Christen, J.A., Ampel, L., Veres, D., Hughen, K., Preusser, F., Svensson, A., 2010b. Were last glacial climate events simultaneous between Greenland and France? A quantitative comparison using non-tuned chronolo-gies. Journal of Quaternary Science 25, 387e394.
Blaauw, M., Christen, J.A., 2011. Flexible paleoclimate age-depth models using an autoregressive gamma process. Bayesian Analysis 6, 457e474.
Charman, D.J., Barber, K.E., Blaauw, M., Langdon, P.G., Mauquoy, D., Daley, T.J., Hughes, P.D.M., Karofeld, E., 2009. Climate drivers for peatland palaeoclimate records. Quaternary Science Reviews 28, 1811e1819.
Daley, T.J., Barber, K.E., Street-Perrott, F.A., Loader, N.J., Marshall, J.D., Crowley, S.F., Fisher, E.H., 2010. Holocene climate variability revealed by oxygen isotope analysis of Sphagnum cellulose from Walton Moss, northern England. Quater-nary Science Reviews 29, 1590e1601.
Damblon, F., 1994. Les dépôts tourbeux et l’histoire de la végétation sur le plateau des Hautes Fagnes (Belgique). Annales de la Société Géologique de Belgique 117, 259e276 (In French).