Science Arts & Métiers (SAM)
is an open access repository that collects the work of Arts et Métiers Institute of Technology researchers and makes it freely available over the web where possible.
This is an author-deposited version published in: https://sam.ensam.eu Handle ID: .http://hdl.handle.net/10985/18896
To cite this version :
Paul STIEF, Jean-Yves DANTAN, Alain ETIENNE, Ali SIADAT, Guillaume BURGAT - Product design improvement by a new similarity-index-based approach in the context of reconfigurable assembly processes - Journal of Engineering Design - Vol. 31, n°6, p.349-377 - 2020
Any correspondence concerning this service should be sent to the repository Administrator : archiveouverte@ensam.eu
Product design improvement by a new similarity-index-based
approach in the context of reconfigurable assembly processes
Paul Stief a, Jean-Yves Dantan a, Alain Etienne a, Ali Siadat aandGuillaume Burgatb
aArts et Metiers Institute of Technology, Université de Lorraine, LCFC, HESAM Université, Metz, F-57070, France;bthyssenkrupp Presta France S.A.S., Florange, France
ABSTRACT
An increased and ongoing trend to more product variety can be observed in manufacturing industries. This trend implies that enter-prises have to deal with more and more differing products which leads to challenges on both sides, the product design and the pro-duction. The improvement of production being an important fac-tor, the challenge on the side of the design department is not minor. Between design for manufacturing/assembly and increasing demands in terms of customisation, the management of highly vary-ing products and the generation of coherent product families is of great importance. This article presents a new design improvement methodology based on two physical and functional architecture sim-ilarity indices and two assembly technology simsim-ilarity indices. It aims to guide the designer in the analysis of product similarity, the identi-fication of product subassemblies to optimise and the choice of con-sistent assembly solutions for an easier product family generation and optimised production. A case study from automotive industry is presented to illustrate the application of this approach.
1. Introduction
Product design is a complex task (Suh2005). In today’s market environment with ongoing trends towards more variety, more customisation and shortening product lifecycle times, the economic design of products gains more and more importance. To face complexity and to guide designers, structured product design approaches have been developed as, for example, the axiomatic design approach of Suh (2001) or Pahl, Beitz, and Wallace (2001) sys-tematic design approach. However, in the context of modular and product family-oriented design, the classical approaches lack the knowledge of how to improve product design for a better similarity in the families. In addition, the assembly technologies used are not eval-uated in comparison with other products which can lead to similar product architectures causing problems for assembly because the chosen assembly solutions differ heavily.
The question to answer is then how to design new products or how to adapt the design of the existing products in the way that the products are well adapted for assembly. In the
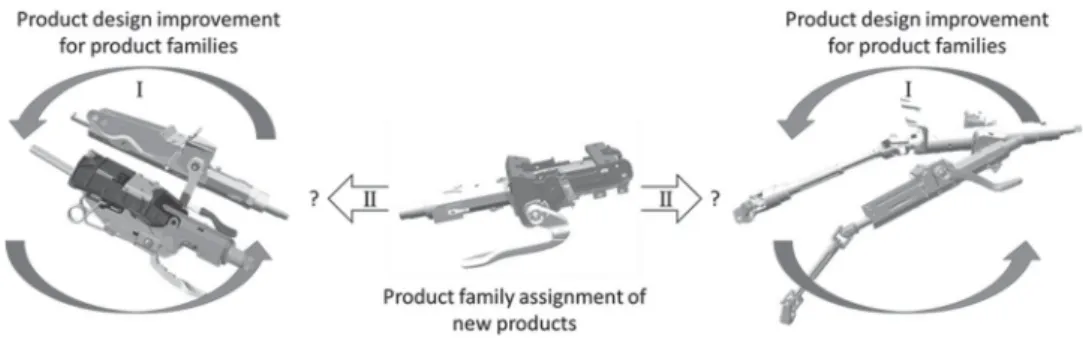
Figure 1.Coverage of the new product design improvement approach.
presented approach, design for assembly is treated in a larger sense than presented, for example, by Boothroyd and Alting (1992). The aim is to propose improvement axes in the sense that not only some components are adapted to more similarity but also the whole product structure, including its physical architecture, its functional architecture as well as its assembly technologies, is adapted to a maximum.
In the following sections, the method overview and research background are presented. In Section 3, the related literature is discussed. The new approach is introduced, justified and explained in Section 4. Section 5 presents an industrial case study which is critically discussed in Section 6. The last section concludes and shows further research perspectives.
2. Method overview and background of the proposed approach
A new product design improvement approach is presented, based on the parallel analysis of both product architecture and assembly technology. Thus, it considers the importance of the product architecture for the design improvement of product families as well as their assembly to assure a compatibility on the technology level. It aims at two directions, as illustrated in Figure1.
First (I), the analysis of the existing product families: Supporting product analysis for product architecture and technology compatibility improvement leading to a better simi-larity in between one product family.
And second (II), the analysis of new products: Identifying the most adapted product fam-ily and improving product architecture design and technology choices during early design stages to increase the similarity with the identified product family. It is important to act during the early design stages, optimally when the first draft is proposed, to limit the costly impact of late changes in product design.
The research is done in strong cooperation with our industrial partner. The deployed research methodology can be described as an iterative circle of development, application and analysis. Through the strong cooperation, the newly developed theories can be con-fronted to industrial reality in their early development stages which allows quick analysis and fast return of experience.
3. Related work
In the introduction, an ongoing trend to more product variety is mentioned. To cope with this increasing variety and to identify possible improvement potential in the existing
product design, it is important to have a precise knowledge of the product range and its characteristics. In this context, the main challenge in product modelling and analysis is not only to cope with product families of a limited product range with shared identical compo-nents. It is also to be able to analyse and to compare products and product families with a high variety and to identify design improvement potential.
3.1. Similarity analysis
In general, there are three visions to describe product families: sales or customer ori-ented, manufacturing oriented and assembly oriented. The former two are well described, whereas the latter, assembly-oriented product families, are rarely mentioned (De Lit and Delchambre2003). On the product family level, assemblies differ mainly in two main char-acteristics: the number of components and their types (i.e. mechanic, electric, electronic). Here, a similarity analysis is essential to improve the product design, on the one hand, for a better similarity within an existing product family and, on the other hand, to identify design improvements.
However, similarity measurement, as presented in the literature, is marked by a wide range of definitions and methods. An exhaustive overview of the literature, concerning the use of commonality analysis in product family design, is proposed by Simpson et al. (2014). The following literature summary is focused on what is entitled as main studies, including commonality indices and metrics. In the literature presented hereafter, the term of com-monality is used. It is defined as the number of components that are used by more than one product and is determined for a product family (Ashayeri and Selen2005). In this article, the terms of commonality and similarity are employed in the same sense and are thought to be synonyms. To be consistent with the cited literature, the term commonality is used in the literature review section, and the term similarity is employed in the sections describing the new approach.
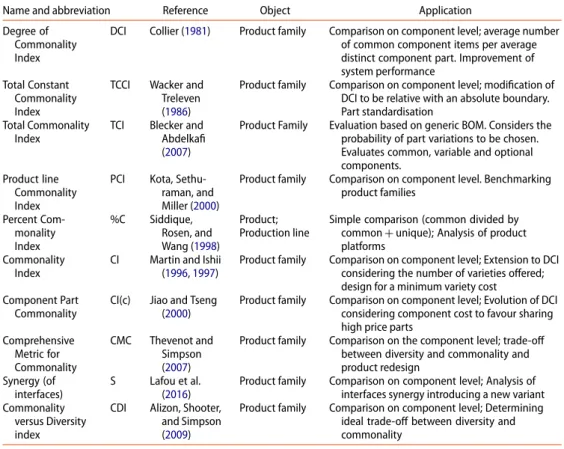
Abdi and Labib (2004) present a two-step approach connecting the Jaccard’s similarity coefficient with an analytic hierarchy process evaluation. The Jaccard coefficient measures similarity between finite sample sets and is defined as the size of the intersection divided by the size of the union of the sample sets. Besides this simple similarity calculation, more sophisticated indices exist in the literature. Table1, inspired by Thevenot and Simpson (2006), gives an overview of these indices.
Besides the TCI, all the indices proposed in Table1have in common that they assess com-monality on the component level (component-based indices). Thus, comcom-monality exists if the same component appears in different products. The TCI considers part variety through the generic BOM. Variety is addressed by its occurrence probability, with the aim to increase the number of common parts. Compatibility analyses of the variety are not considered.
Assembly is only considered by CMC and PCI. But commonality is also fixed on the criterion ‘exactly the same’.
There is a lack of research concerning the identification of similar components in prod-uct families which are characterised by part variety. These similar components might be assembled with the same production facility which means that a commonality of ‘exactly the same’ is not necessary and might be a case of over-engineering. In addition, a component-to-component comparison becomes more complex with increasing compo-nent count. Indeed, complex mechanical assemblies with different compocompo-nent numbers
Table 1.Commonality indices and their objectives.
Name and abbreviation Reference Object Application
Degree of Commonality Index
DCI Collier (1981) Product family Comparison on component level; average number of common component items per average distinct component part. Improvement of system performance
Total Constant Commonality Index
TCCI Wacker and Treleven (1986)
Product family Comparison on component level; modification of DCI to be relative with an absolute boundary. Part standardisation
Total Commonality Index
TCI Blecker and Abdelkafi (2007)
Product Family Evaluation based on generic BOM. Considers the probability of part variations to be chosen. Evaluates common, variable and optional components.
Product line Commonality Index
PCI Kota, Sethu-raman, and Miller (2000)
Product family Comparison on component level. Benchmarking product families Percent Com-monality Index %C Siddique, Rosen, and Wang (1998) Product; Production line
Simple comparison (common divided by common+ unique); Analysis of product platforms
Commonality Index
CI Martin and Ishii (1996,1997)
Product family Comparison on component level; Extension to DCI considering the number of varieties offered; design for a minimum variety cost Component Part
Commonality
CI(c) Jiao and Tseng (2000)
Product family Comparison on component level; Evolution of DCI considering component cost to favour sharing high price parts
Comprehensive Metric for Commonality CMC Thevenot and Simpson (2007)
Product family Comparison on the component level; trade-off between diversity and commonality and product redesign
Synergy (of interfaces)
S Lafou et al. (2016)
Product family Comparison on component level; Analysis of interfaces synergy introducing a new variant Commonality
versus Diversity index
CDI Alizon, Shooter, and Simpson (2009)
Product family Comparison on component level; Determining ideal trade-off between diversity and commonality
are complicated to compare with the above-mentioned component-based indices. Due to the heterogeneity, the effectiveness of a solely component-based model is uncertain as it needs compatibility analysis (another one-to-one comparison). To illustrate: if a com-pany has 103component references, this would make 106comparisons. And every new component must be compared to ≥ 103 others which represents an enormous work charge.
In the context of this research gap, a product model is needed which supports prod-uct analysis in heterogeneous prodprod-uct families. In the following section, the results of a literature review carried out on product and assembly representations are presented. The objective of this literature review is either to identify a product model which enables prod-uct comparison beyond the simple component-to-component analysis, or to identify a model which may serve as a starting point for the new approach.
3.2. Product modelling and assembly representation
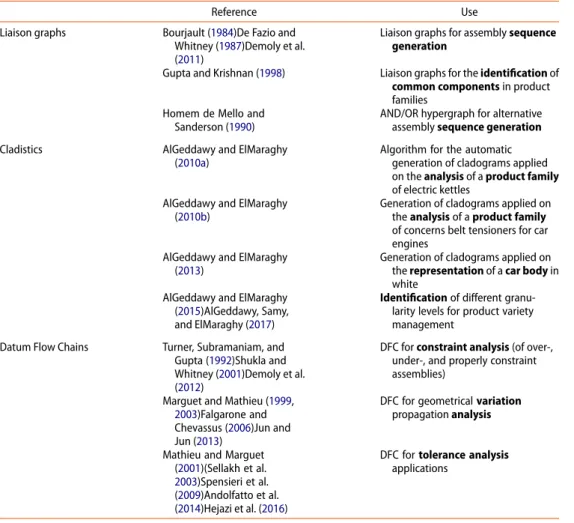
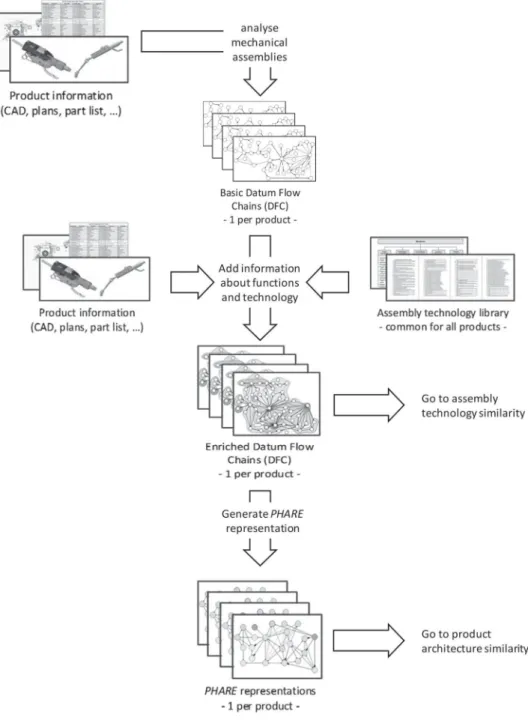
Whitney (2004) identifies the following approaches for assembly modelling which are used in industrial application: part lists, bill of materials (BOM), liaison graphs and Datum Flow Chains (DFC). In addition to these, ElMaraghy, AlGeddawy, and Azab (2008) proposed a new method based on cladistics. The part list is the simplest model which can be used as a starting point for the generation of the other representations (see Figure2).
Figure 2.Different assembly representations and their relation.
As stated by Söderberg, Lindkvist, and Carlson (2006), hierarchical models are not suited to visualise all dependencies between the components making use of network representa-tions more recommendable for product analysis. Therefore, the following review (Table2) focuses on the evaluation of network representations and the hierarchical network of cladistics, briefly defined here below:
• Liaison graphs visualise a product assembly in a network. Components are represented by nodes and their relations by links between the nodes. A link means that two compo-nents are in touch (mechanical assembly or simple contact).
• Cladistics describe technical feature variation in one product family putting the emphasis not on its chronological but on technical evolution. It is used to support the paradigm of delayed product differentiation (He, Kusiak, and Tseng1998).
• Datum Flow Chains represent an evolution of the liaison graphs by adding infor-mation about positioning and eliminated degrees of freedom on the arcs. An exhaustive description of the DFC generation with several examples and its appli-cations in industry is presented in (Whitney2004) and (Mantripragada and Whitney 1998).
Liaison graphs furnish only quantitative information about component connections and no data about the relation characteristics. Furthermore, all the mentioned methods are only applied either on one specific product or on one family of very similar products.
Cladistics seem to be adapted for product family analysis on a general level, mainly focus-ing on components which are linked to product features. However, the feature-oriented analysis does not deliver information about all connections between different components. The model itself gives no information about the product architecture. It seems adapted for very similar products which have a large common base. As a consequence, modelling with cladistics seems less adapted to product families with a high variety of components which highly increase the number of nodes, branches and characters. It cannot be seen how the model enables the identification of improvement axes.
The DFC offers not only quantitative but also qualitative information about an assembly. This fact makes it interesting as a product model. However, it has not often been used for the representation of part and product families and a variation analysis within these families. One application of the DFC on this aspect known to the authors is proposed by Xia et al. (2018).
Table 2.Summary of the literature on assembly representation.
Reference Use
Liaison graphs Bourjault (1984)De Fazio and Whitney (1987)Demoly et al. (2011)
Liaison graphs for assembly sequence generation
Gupta and Krishnan (1998) Liaison graphs for the identification of common components in product families
Homem de Mello and Sanderson (1990)
AND/OR hypergraph for alternative assembly sequence generation Cladistics AlGeddawy and ElMaraghy
(2010a)
Algorithm for the automatic generation of cladograms applied on the analysis of a product family of electric kettles
AlGeddawy and ElMaraghy (2010b)
Generation of cladograms applied on the analysis of a product family of concerns belt tensioners for car engines
AlGeddawy and ElMaraghy (2013)
Generation of cladograms applied on the representation of a car body in white
AlGeddawy and ElMaraghy (2015)AlGeddawy, Samy, and ElMaraghy (2017)
Identification of different granu-larity levels for product variety management
Datum Flow Chains Turner, Subramaniam, and Gupta (1992)Shukla and Whitney (2001)Demoly et al. (2012)
DFC for constraint analysis (of over-, under-, and properly constraint assemblies)
Marguet and Mathieu (1999,
2003)Falgarone and Chevassus (2006)Jun and Jun (2013)
DFC for geometrical variation propagation analysis
Mathieu and Marguet (2001)(Sellakh et al.
2003)Spensieri et al. (2009)Andolfatto et al. (2014)Hejazi et al. (2016)
DFC for tolerance analysis applications
3.3. Conclusion of the literature review
In the first part of the literature review, the existing indices for a similarity analysis have been examined. It has been stated that the proposed component-to-component analysis is not adapted to the analysis of a broad product range. Thus, the second part of the review draws up an inventory of product and assembly modelling approaches with the aim to identify product models, enabling the comparison of differing products. However, either the above presented classical methodologies do not detail the relations between components or they furnish mainly quantitative information about product assemblies. The latter analyse the product structure on a physical level (component level) which causes difficulties regarding an efficient definition and comparison of different product families. Case studies are applied to single products or very similar product families. Addressing this research gap, the key questions are
• How to model and analyse product varieties?
• How identify design improvements to reduce the reconfiguration needs of assembly processes?
The aim is to improve product families in terms of architecture and technology simi-larity to ease assembly. Concerning the first question, an innovative product model has been presented (Stief et al.2018), enabling product modelling on the physical and func-tional architecture level. The approach is based on the DFC product model that has been identified as the product representation which contains the most information. The physical product view is extended to the functional level and eases, on the one hand, the compari-son of differing products. On the other hand, it enables the forthcoming step towards the assembly system by considering that product subassemblies represent subsystems of the assembly system. So, it allows a macro-view of how to organise an adapted assembly sys-tem for a product variety. Based on this model, four similarity indices have been developed (Stief et al.2019).
To answer the second question, a new iterative process using the four similarity indices is introduced in the following section to support product architecture analysis and improve-ment as well as the comparison of used assembly technology. The product architecture similarity heads towards an improvement for the assembly system structure, as described above. The assembly technology analysis shows improvement possibilities concerning the technology choices. This impacts the reconfiguration need in the assembly system later and allows to reduce reconfiguration efforts.
4. New approach for product analysis and design improvement
To close the research gap mentioned in the preceding section, an innovative product mod-elling approach has been developed and similarity indices have been introduced (Stief et al. 2018; Stief et al.2019) which are completed to support an iterative design improvement process. This article highlights the interpretation of the similarity indices and the utilisation of the developed product models for design improvements.
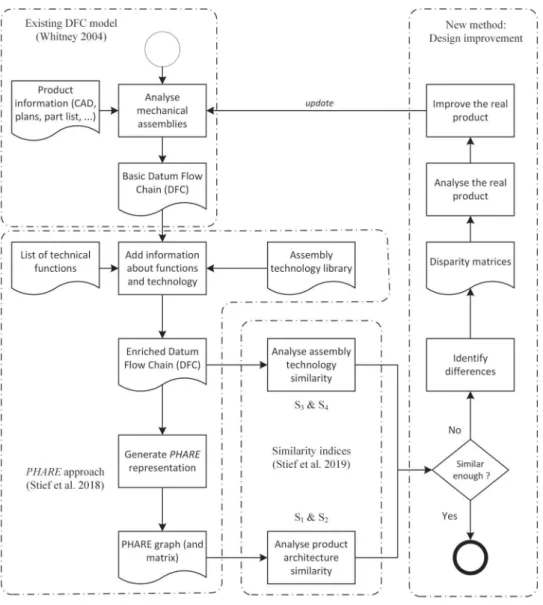
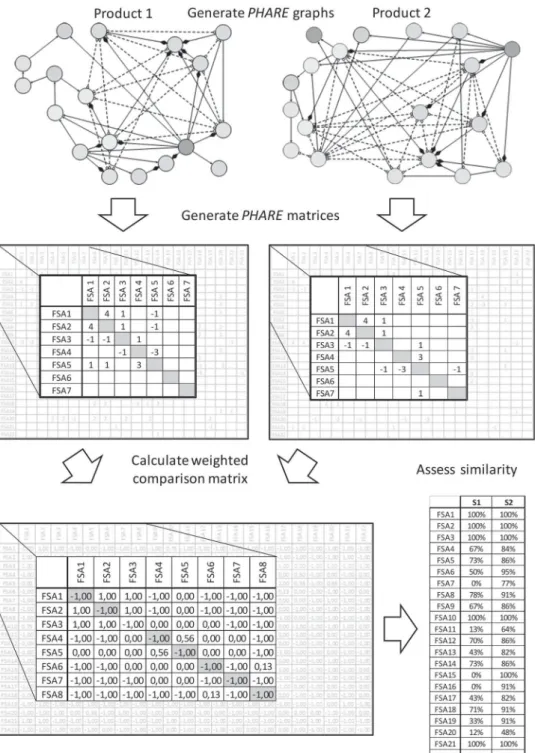
This product improvement process based on similarity evaluation is illustrated by Figure 3. It represents an iterative circle for the improvement of the product architecture and assembly technology which is the here newly presented utilisation of the developed model and indices. The method may be positioned in a reverse engineering approach. Referring to the FBS approach (Gero1990; Gero and Kannengiesser2004), it is located in the link B to S, the structure being the product analysed and the behaviour being its technical function. For the understanding of the new approach, knowledge about the used models and similarity indices is necessary. The product improvement approach is interlinked to an inno-vative product modelling method called the PHARE and its similarity indices. Figure4gives a complete overview of the proposed approach, emphasising the fundamental models and their utilisation for design improvement.
Starting with the assembly analysis of the concerned products, the DFCs are generated. The generation of the DFCs has been sufficiently described in the literature (see Section 2) and is not detailed in this article. In a next step, the DFCs are enriched with information about assembly technology and functional subassemblies (FSA) which are based on tech-nical functions. This step is needed to generate the physical and functional architectures (PHARE).
The similarity indices S1 to S4 are calculated out of the PHARE approach. They have
Figure 3.Synthesised illustration of the new product improvement process.
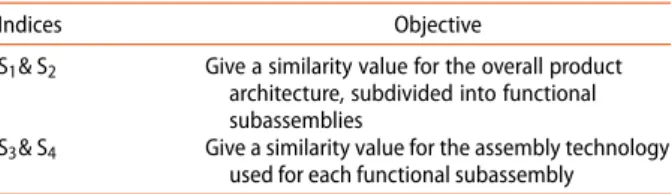
Table 3.Range of the new similarity indices.
Indices Objective
S1& S2 Give a similarity value for the overall product
architecture, subdivided into functional subassemblies
S3& S4 Give a similarity value for the assembly technology
used for each functional subassembly
S1and S2give an overview of the product architecture similarity in terms of structural
and functional complexity similarity. The granularity of the analysis is situated on the level of FSA. The couple of indices indicates if the architecture, i.e. the relations between FSA, is similar for both analysed products and if an FSA has the same complexity concerning its position in relation to the other functional subassemblies in both products.
The couple of S3and S4is used to analyse the assembly technology similarity per FSA:
S3evaluates the similarity of assembly technologies used to assemble an FSA. S4
Figure 4.Overview of models, similarity indices and their utilisation.
utilisation of these indices is presented in this paper by using them for product similarity improvement.
In the next subsections, the different steps of the new product design improvement approach are detailed. The order follows the overview in Figure4. First, the generation of the PHARE is reminded. Then, the origin of the indices S1and S2is called to mind, succeeded
by the indices S3 and S4. Finally, the new iterative improvement process is thoroughly
presented.
4.1. The physical and functional architecture (PHARE approach)
The PHARE representation aims to ease the comparison of products which are composed by a different component number and different component types. Making an abstraction
step from the component level, it is based on the products’ functional subassemblies (FSA). These contain all the components needed to fulfil a function; thus, they contain at least one component if the function is realised in the product. Functions are defined commonly for all products which are to examine and give the common referential for the comparison. The notion of function is here used in the sense of technical functions which must satisfy technical requirements. Once defined, the number of technical functions stays the same which enables and eases the product comparison.
In general, the approach is adapted to all mechanical assemblies and not limited to the automotive sector presented in the case study. However, the definition of technical func-tions restrains the method application to the products of the same domain which can refer to a common definition. To give an example, the method enables the comparison of a biro, a pencil and a feather pen but is not adapted to compare a feather pen with a water ket-tle. Although it is restrained by its assembly orientation, the approach remains generic and flexible.
The following description of how to generate the PHARE model is illustrated by Figure5 which itself is situated on the left side of Figure4.
The DFCs are generated based on product information captured out of part lists, CAD files and technical drawings. They are enriched with information about assembly technol-ogy, based on an assembly technology library. This information enriches the links of the DFC model. In addition, information about FSA is introduced. It is represented by differ-ent zones gathering compondiffer-ents in the DFC. Finally, the PHARE is generated which can be represented as a graph or matrix.
The assembly representation has been shifted from the physical DFC level to a hybrid physical and functional view: nodes in the DFC represent components and arcs their relations; whereas nodes in the PHARE represent FSA and arcs their relations.
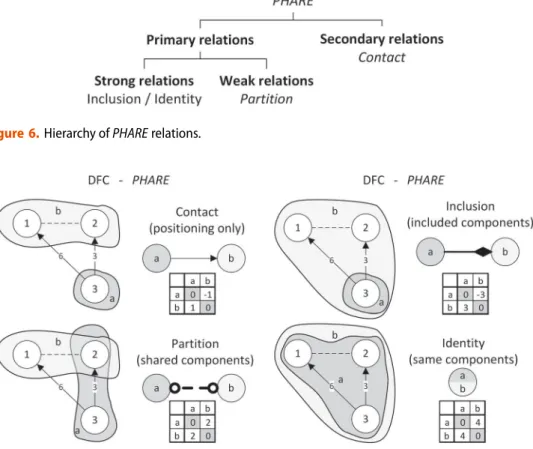
All possible relations between FSA can be described by four different PHARE relations: identity, inclusion, partition and contact. These are divided into primary relations and sec-ondary relations. Primary relations are more important than secsec-ondary relations and strong relations are more important than weak relations. This hierarchy, illustrated in Figure6, is important for the design analysis later.
Figure7illustrates with help of the FSA ‘a’ and ‘b’ and components 1–3 the appearance of PHARE relations in the DFC, the PHARE graph and its matrix. Each relation has its distinct entry in the matrix. The relations ‘contact’ and ‘inclusion’ are directed which implies that they are counted positively when entering an FSA and negatively when leaving an FSA. The relations ‘identity’ and ‘partition’ are undirected and only counted positively. If no relation exists between two FSA, the according matrix entry is set to zero.
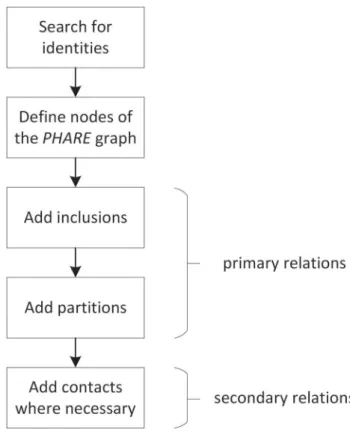
The PHARE generation respects the set of five constraints described below and follows the order described in Figure8.
(1) Two FSA can be connected by maximum one relation. Multiple relations between the same FSA are not allowed except the case described in (5).
(2) Primary relations are a prior to secondary relations, i.e. if there is a primary relation between two FSA, a secondary relation is not established to reduce the number of relations.
(3) The inclusion relations are transitive: if Aε B and B ε C, then A ε C. In this case, no link must be added between A and C.
Figure 5.Illustration of thePHARE approach.
(4) If there is an inclusion relationship Aε B, all incoming and outgoing links are to relate to A except the ones in B but not in A. In this case the links of this element are kept as they meet the other constraints.
(5) If contacts exist in both directions between two FSA, the direction with the higher num-ber of contacts dominates and is represented in the PHARE. If the numnum-ber of contacts
Figure 6.Hierarchy ofPHARE relations.
Figure 7.The four relations inPHARE representation (graph and matrix).
is identical, then the direction of the contact with the highest number of degrees of freedom is selected. In case of equality, a contact in both directions is generated. It is counted as an entering contact for both FSA.
For the matrix generation, the second step can be skipped. Please note that the constraints have slightly evolved, as described above (referring to Stief et al.2018).
4.2. Similarity analysis based on the PHARE approach (similarity indices S1and S2) A similar PHARE architecture is supposed to imply similarity in the assembly system. Thus, it is of importance for a simplified assembly system structure later. Consequently, the first part of the similarity analysis concerns the product architecture in its PHARE representation. The calculation of S1and S2starts with the PHARE matrices, presented in the precedent
subsection. Out of these, a weighted comparison matrix is generated. It is the base for the similarity index calculation. The comparison of entries in two PHARE matrices gives the pon-deration: the value is ‘1’ if both entries are identical and not zero. It is ‘−1’ if both entries are identical and zero. And it is ‘0’ if one matrix contains an entry and the other has no entry (i.e. zero). All the other combinations lead to values between zero and one in the weighted comparison matrix. Figure9illustrates the generation of the weighted comparison matrix
Figure 8.Generation order ofPHARE representation.
Figure 9.Generation of the weighted comparison matrix.
using two of the PHARE matrices shown in Figure7. A full list of possible combinations and values for the pondered comparison matrix as well as the calculations has been published in (Stief et al.2019).
Using the pondered comparison matrix, similarity is evaluated concerning two aspects: the relations between functional subassemblies (S1), on the one hand, and the existence of
common absent links (S2), on the other hand.
For S1,the generic formula is as follows:
S1=
Common relations
Common and unique relations% (1)
And S2is calculated in the following way:
S2=
Common relations+ common absent relations
Number of line entries % (2)
Common relations are entries with values greater than zero in the comparison matrix, unique relations are entries equal to zero. Common absent relations are all entries equal to ‘−1’.
Figure10summarises the approach giving an overview of models and the intermediate results used to get from the PHARE graph to the values for S1and S2. Developed with Excel,
the method and calculations are implemented in Python and being used by our industrial partner.
The analysis of S1 and S2 must be done simultaneously. The two indices cannot be
regarded separately. Both S1and S2give information about the product similarity
con-cerning the structural-functional complexity. However, the S1 value is oriented towards
structural similarity and the S2index delivers additional information about the overall
com-plexity similarity. Due to the construction of the indices, S2 can never be less than S1.
According to Figure11, there are three extreme combinations (1), (2) and (6). These serve to identify either perfect or no similarity. And three possible intermediate combinations (3) – (5) which have different interpretations depending on the values of the index couple.
If an FSA is not realised or only realised by one of the two analysed products, it is no longer considered for further analysis. Low and intermediate values indicate the need for product design modification. The lower the values are, the more important are the mod-ifications. Finally, high and perfect values indicate that there is in the worst case a minor difference between the two products which does not necessarily need any improvement. Figure12gives an illustrative example for the interpretation of S1and S2.
4.3. Similarity of assembly technologies used (similarity indices S3and S4)
The first analysis step gives an idea of the similarity on the product architecture level and indicates which functions are realised in the compared products. However, information about the product assembly is missing. Two complementary similarity indices, called S3and
S4, are proposed to overcome this gap. The similarity of technology choices is expected to
reduce the variety of solutions in a product family which reduces the reconfiguration need later during production.
The calculation of these indices is based on the DFC representation enriched with assembly technology information and FSA. To be consistent, a catalogue of assembly tech-nologies has been defined with our industrial partner which is used for the technology allocation (which are allocated to the arcs of the DFC). Due to the confidentiality issues, this
Figure 10.Method overview – generation of S1and S2.
catalogue cannot be detailed here. The catalogue may be easily adapted to other indus-trial cases. Important is the respect of a common and consistent language to not falsify the similarity analysis.
Figure 11.Interpretations of the indices S1and S2.
Figure 12.Illustrative example for S1and S2, inspired by (AlGeddawy and ElMaraghy2010a).
An illustrative overview of the way to calculate the indices is presented in Figure13. The figure synthesises intermediate models and results which are used during the calculations. Analogous to the indices S1and S2, the indices and their calculation are implemented to
Python. The two indices are calculated in the same way, as shown in eq. 3:
S3,4=
Common assembly technologies
Common and unique assembly technologies% (3) The difference between them is the link selection in the DFC. S3analyses the technology of
the DFC links ‘internal’ of FSA. It gives the similarity of how FSA are assembled. S4analyses
the ‘external’ technology, i.e. the technology which is used to assemble the FSA with its sur-roundings. The difference is illustrated in Figure14with an excerpt of the DFC. It emphasises the notion of internal and external arcs comparing FSA 1 and FSA 2.
Figure 13.Method overview – generation of S3and S4.
Figure 14.Example of internal and external DFC links.
A norm is introduced in the case that an FSA contains only one part: S3is marked ‘none’
because no assembly is realised in the FSA and therefore no assembly technology is used to realise it. In all the other cases, the higher the similarity value, the less differences exist concerning the assembly technology solution in the FSA compared. The two indices are not correlated, a high value for S3does not imply a high value for S4and vice versa. For more
information, a detailed description is published in (Stief et al.2019).
Analysing the similarity values, a designer identifies easily which parts of the products, i.e. the FSA of both analysed products, have an improvement potential in terms of the assembly technology used.
Figure 15.Illustrative example for S3and S4.
It may exist cases where an FSA is assembled in the same way for both products, but its assembly with the surroundings differs. Or in the opposite way, an FSA is assembled identically with its surroundings in both products, but the technologies used for internal assembly differ (Figure15). Both cases underline a need of product design improvement concerning the technology choices.
4.4. Iterative process for identification of product design improvement potential In this section, a new process is presented, using the indices S1 to S4 to guide product
Figure 16.Iterative process for product design improvement.
in terms of product architecture and assembly technology. The detailed process is pre-sented in Figure16. The reasoning focuses first on the product architecture analysis and improvement, named product architecture improvement loop in the figure. Then the assembly technology similarity is assessed and improved during the assembly technology improvement loop.
The product architecture improvement is based on the PHARE matrices. To identify the FSA which causes low similarity in the PHARE, a so-called disparity matrix is generated for each of the both products. These disparity matrices contain all relations which are not the same in the PHARE matrices. Thus, it synthesises all differences. In the disparity matrices, inclusions have the value± 3, partitions the value 2 and contacts the value ± 1. An example is given in Figure17. The reasoning is to reduce the entries in the disparity matrix as much as possible which means that the differences in the PHARE are reduced. Due to the transitivity rule, the differences concerning relations of the type ‘inclusion’ have the most impact on the
Figure 17.Disparity identification.
PHARE and thus on the product similarity indices S1and S2.As a consequence, the
exam-ination order is from strong primary relations, over weak primary relations to secondary relations (remind Figure6).
After the difference analysis, the improvement loop starts with the identification of inclu-sions. Once identified in the disparity matrices, their location in the product architecture is known through the FSA which are implied. In a next step, the real product is examined con-cerning the critical FSA and a solution is proposed to remove the differences and to increase similarity. It is the task of the product designer to assure that the proposed solution removes the difference and satisfies at the same the technical requirements on the product.
When a solution is applied, the PHARE matrix and the disparity matrix are updated, and a new iteration starts analogous to the described one. The iterations of the product improve-ment loop finish when there are only ‘contact’ relations left which are considered as not important to treat.
The presented approach helps the product designer to identify parts of the product which are differing compared to another one. The comparison on the FSA level helps to identify the location of the differences in the real product. Due to the binary compari-son, it seems convenient that the designer adapts one of the two existing solutions to avoid redesigning both products. The approach does not prescribe a technical solution but supports the decision-making process. The final decision is up to the designer.
When the product architecture improvement loop is finished, the assembly technology improvement loop starts. To do so, the updated product structure (i.e. the enriched DFC) is used to calculate the similarity indices S3and S4. Based on this, derivations of used assembly
technologies are identified. With help of the FSA, the differences can be located in the real product. It is the task of the product designer to identify if a common assembly technology solution can be proposed for both products. Equal to the product architecture improve-ment, the approach gives no restriction of the detailed solution but guides the designer during the identification of differences. It is up to the product designer to ensure that the proposed assembly technology solution satisfies the product requirements.
The assembly technology improvement loop finishes, when all differences in assembly technology are analysed and no further improvement can be proposed. With this loop, the new proposed product design improvement process as illustrated in Figure16arrives at its end.
5. Case study application
The proposed indices have been applied to a study case concerning the comparison of two steering columns (here called column 1 and column 2) which have intermediate initial sim-ilarity values. The choice of the two products has been guided by the fact that the partner company has been faced with the decision on which production line to integrate column 1. It has been decided to put it on the production line of column 2, a choice which leads to some practical problems. The aim of this case study is now to identify which product mod-ifications would ease the product integration of column 1 and to confront these results with industrial experience. The financial impact of the results has been estimated by the industrial partner but cannot be detailed here due to confidentiality issues. Both columns are mechanical steering columns with height and length adjustments, and both are quite sophisticated and contain comfort parts. The functional framework for steering columns defined with the industrial partner contains 22 technical functions of which column 1 sat-isfies 21 and column 2 satsat-isfies 20. The general appearance of both columns looks like the left columns in Figure1.
The iterative process has been applied to these two columns. Figure18shows the dispar-ity matrices and their evolution during the case study. Conforming to the iterative process, the disparities of the type ‘inclusion’ (±3) are treated in priority, followed by the dispari-ties of type ‘partition’ (2). During the application, it has been shown that a major part of the existing disparities is linked a with the ‘inclusion’ differences and disappears once the latter are managed. To reach the final state, seven inclusions and two partitions have been treated. Conforming to the problem, only column one has been modified, the modifications impacting the disparity matrices of both columns. The number of entries in the disparity matrices has been reduced from 70 to 6 in the case of column 1 and from 36 to 4 in the case of column 2.
During the redesign loops, two different reasoning cases occurred which are linked to the product design: on the one hand, disparity exists due to different product design solu-tions. In this case, a standard for both products has been proposed which consists in general of the application of one product design to the other product. On the other hand, dis-parity exists due to the additional content in one of the two examined products. In this case, the FSA which is concerned has been excluded from further consideration because
Figure 18.Disparity matrix evolution during case study.
adding a supplementary content to a product is not product design improvement but over-engineering. They are considered in the same way as not realised FSA.
The product modifications in link with the disparity treatment are illustrated in Figure 19which shows the DFC of the two steering columns before and after the improvement process. Modified zones are highlighted with darkened zones, FSAs that are not considered are bleached out. For reasons of confidentiality, the real product and the proposed standard solutions cannot be detailed.
The final effect on product architecture similarity can be analysed with the evolution of S1and S2. Figure20shows the values for S1and S2and their evolution for the 22 FSA (each
Figure 19.Changing product architecture during case study.
values S1have been increased in the middle from 51% to 81%. In detail, the number of FSA
with S1values greater than 90% has been increased from four FSA to 14 FSA. Concerning S2,
all values have been increased to over 90%. An analysis of the remaining differences, which are all caused by not treated ‘contact’ disparities, put into evidence that they are linked to supplementary content in the products (additional components or additional FSA). They are considered as minor differences with less importance.
According to the iterative process, S3and S4are now analysed. Figure21shows their
values. Each line represents one FSA. The entries marked ‘none’ have the following signifi-cation: for S3it means that the FSA contains either only one component and has, therefore,
no internal assembly link, or it is not realised in both products (if S10%). For S4it means
that the concerned FSA contains the base part in the DFC, i.e. the source node of the graph which is not located. It means that the node has no incoming links. Thus, there is no external assembly technology positioning the FSA.
For all other cases, there are some derivations in the assembly technology used. In this case, there are also two reasons for these differences, analogous to S1and S2. On the one
hand, it may be linked to additional content, on the other hand, it may be linked to different assembly technology choices for an identical product structure. An example for a S3
deriva-tion is the addideriva-tion of an addideriva-tional part for the steering shaft in column 1 which implies an additional assembly technology and which decreases the similarity values. An example for a S4derivation is the use of two different assembly technologies to fix stop plates on the
col-umn body: in one case they are rifted, in the other case they are fixed by plastic deformation of a specially conceived support. As a result, the similarity is poor.
After the identification of problematic FSA, the designers’ work is now to choose a stan-dard assembly technology for both columns in order to increase the similarity values S3and
Figure 20.Evolution of similarity indices S1and S2.
6. Discussion
The described case study has been presented to the industrial partner and faced with indus-trial practise. The presented approach is thought to be a guiding process in the similarity analysis of complex products. It requires that the products, existing or under development, are modelled with PHARE model. This may be undertaken during the design stages, when the designer draws the sketches and CAD files of the future product. The new approach highlights differences between the new product and chosen existing products in terms of product architecture and assembly technology. It helps in this way to improve the new product for its integration in an existing product family or the integration to an existing pro-duction line. The case study underlined the capacity of the approach to provide a product model which enables the comparison of complex product structures and which considers assembly technologies.
It illustrates how the PHARE approach and its similarity indices can be used as a base for the product design analysis and improvement by the identification of disparities in the
PHARE and by comparing assembly technologies. The disparity-guided analysis allows to
formalise the approach and to make the reasoning a tool on which fact-based discussions between the design and the production department can take place. However, to under-stand well each step and to propose good under-standard solutions, a basic knowledge of the
Figure 21.Analysis of indices S3and S4.
7. Conclusion and perspectives
For assembly-oriented product family design analysis, it is important to know which prod-ucts should be gathered and how prodprod-ucts should be modified for an improved similarity. To answer the question of similarity identification, several similarity indices have been proposed in the past, ranging from simple part-by-part comparisons to evolved indices considering additional aspects as, for example, material. But all these component-based indices fail to answer the question how to analyse product variety of differing products in the same domain and how to improve similarity if necessary. Addressing this research gap, a new similarity analysis approach is proposed in this article, based on the analysis of four similarity indices S1to S4.
The indices S1and S2are used for a global view on the complexity and similarity of the
product (functional and physical levels) which allows the identification of functional sub-assemblies which have improvement potential. The indices S3and S4detail the similarity
on an assembly level. They give an information if assembly should be adapted or not. The detailed product modelling approach on which the similarity analysis is based has already been introduced in two precedent publications (Stief et al.2018; Stief et al.2019).
In cooperation with the industrial partner, manufacturer of steering columns in the auto-motive sector, a case study on the use of the four similarity indices for product design improvement has been realised and is presented in this article. It underlines that a compari-son of different products is possible. Based on this comparicompari-son, problematic subassemblies can be identified following a formalised iterative process. The confrontation of this first case
study results with the experience of the industrial partner revealed that the propositions are in concordance with what is considered possible and reasonable by the industrial partner. It emphasised the need for objective and structured analysis methods.
As the proposed approach is newly developed, the presented case study and its results are none other than the beginning of the verification of the indices and the reasoning based on them. The whole potential of the new approach has not been completely explored yet and other case studies will follow. At the current state the improvement is focused on design and technology. Additional aspects, e.g. cost and benefits, are not considered yet. Also, the coupling of the new method with classical approaches, for example, a DFA evaluation of each proposed design improvement, might be possible.
An automation of the manually calculus and comparison would be helpful in terms of reducing calculation time and avoiding input mistakes. The implementation of the above-presented approaches has been realised and will be completed within the scope of the research cluster of which this research is part. A long-term perspective might be the link of the method with an CAD system to get and manipulate information in real time. Concern-ing the identification of product families, future work will consist of includConcern-ing a clusterConcern-ing approach. This work will be done in cooperation with the industrial partner in order to assure the accuracy of implementation and output.
As the similarity index-based approach is only a brick in the research work on the design of reconfigurable assembly systems and the identification of adapted product families, it will be integrated into the global approach. The use of S1and S2for product family
genera-tion and clustering is under development. Upcoming work will cope with the link between the product design analysis and improvement and the production system design.
Acknowledgements
The authors gratefully acknowledge the support by thyssenkrupp Presta France, member of the research cluster about humans in the centre of reconfigurable, safe, and efficient production systems. Disclosure statement
No potential conflict of interest was reported by the author(s). Funding
The authors appreciate the support by the European Regional Development Fund [grant under the title ‘Programme opérationnel FEDER-FSE Lorraine et Massif de Vosges 2014-2020’].
ORCID
Paul Stief http://orcid.org/0000-0001-5459-1537
Jean-Yves Dantan http://orcid.org/0000-0002-0491-8391
Alain Etienne http://orcid.org/0000-0001-7452-4497
Ali Siadat http://orcid.org/0000-0002-8406-1892
References
Abdi, M. R., and A. W. Labib.2004. “Grouping and Selecting Products: The Design Key of Reconfig-urable Manufacturing Systems (RMSs).” International Journal of Production Research 42 (3): 521–546.
AlGeddawy, T., and H. A. ElMaraghy.2010a. “Assembly Systems Layout Design Model for Delayed Products Differentiation.” International Journal of Production Research 48 (18): 5281–5305.
doi:10.1080/00207540903117832.
AlGeddawy, T., and H. A. ElMaraghy.2010b. “Design of Single Assembly Line for the Delayed Dif-ferentiation of Product Variants.” Flexible Services and Manufacturing Journal 22 (3–4): 163–182.
doi:10.1007/s10696-011-9074-7.
AlGeddawy, T., and H. A. ElMaraghy.2013. “Determining Granularity Level in Product Design Architec-ture.” In Smart Product Engineering, edited by M. Abramovici and R. Stark, 535–542. Lecture Notes in Production Engineering. Berlin: Springer-Verlag.
AlGeddawy, T., and H. A. ElMaraghy.2015. “Determining Granularity of Changeable Manufacturing Systems Using Changeable Design Structure Matrix and Cladistics.” Journal of Mechanical Design – Transactions of the ASME 137 (4): 041702-1–041702-12.doi:10.1115/1.4029515.
AlGeddawy, T., S. N. Samy, and H. A. ElMaraghy. 2017. “Best Design Granularity to Balance Assembly Complexity and Product Modularity.” Journal of Engineering Design 28 (7–9): 457–479.
doi:10.1080/09544828.2017.1325859.
Alizon, F., S. B. Shooter, and T. W. Simpson. 2009. “Assessing and Improving Commonal-ity and DiversCommonal-ity Within a Product Family.” Research in Engineering Design 20 (4): 241–253.
doi:10.1007/s00163-009-0066-5.
Andolfatto, L., F. Thiébaut, C. Lartigue, and M. Douilly.2014. “Quality- and Cost-Driven Assembly Tech-nique Selection and Geometrical Tolerance Allocation for Mechanical Structure Assembly.” Journal of Manufacturing Systems 33 (1): 103–115.doi:10.1016/j.jmsy.2013.03.003.
Ashayeri, J., and W. Selen.2005. “An Application of a Unified Capacity Planning System.” International Journal of Operations & Production Management 25 (9): 917–937.doi:10.1108/01443570510613965. Blecker, Th, and N. Abdelkafi. 2007. “The Development of a Component Commonality Met-ric for Mass Customization.” IEEE Transactions on Engineering Management 54 (1): 70–85.
doi:10.1109/TEM.2006.889068.
Boothroyd, G., and L. Alting.1992. “Design for Assembly and Disassembly.” CIRP Annals – Manufactur-ing Technology 41 (2): 625–636.doi:10.1016/S0007-8506(07)63249-1.
Bourjault, A.1984. “Contribution À Une Approche Méthodologique De L’assemblage Automatisé: Elaboration Automatique Des Séquences Opératoires.” PhD thesis, Faculté des Sciences et des Techniques, Université de Franche-Comté.
Collier, D. A.1981. “The Measurement and Operating Benefits of Component Part Commonality.” Decision Sciences 12 (1): 85–96.doi:10.1111/j.1540-5915.1981.tb00063.x.
De Fazio, T. L., and D. E. Whitney.1987. “Simplified Generation of All Mechanical Assembly Sequences.” IEEE Journal on Robotics and Automation 3 (6): 640–658.doi:10.1109/JRA.1987.1087132.
De Lit, P., and A. Delchambre.2003. Integrated Design of a Product Family and Its Assembly System. Boston, MA: Kluwer Academic.
Demoly, F., X.-T. Yan, B. Eynard, S. Gomes, and D. Kiritsis.2012. “Integrated Product Relationships Management: A Model to Enable Concurrent Product Design and Assembly Sequence Planning.” Journal of Engineering Design 23 (7): 544–561.doi:10.1080/09544828.2011.629317.
Demoly, F., X.-T. Yan, B. Eynard, L. Rivest, and S. Gomes.2011. “An Assembly Oriented Design Framework for Product Structure Engineering and Assembly Sequence Planning.” Robotics and Computer-Integrated Manufacturing 27 (1): 33–46.doi:10.1016/j.rcim.2010.05.010.
ElMaraghy, H. A., T. AlGeddawy, and A. Azab.2008. “Modelling Evolution in Manufacturing: A Bio-logical Analogy.” CIRP Annals – Manufacturing Technology 57 (1): 467–472.doi:10.1016/j.cirp.2008. 03.136.
Falgarone, H., and N. Chevassus.2006. “Structural and Functional Analysis for Assembly.” In Advances in Design, edited by H. A. ElMaraghy and W. H. ElMaraghy, 87–96. Springer Series in Advanced Manufacturing. London: Springer-Verlag.
Gero, J. S.1990. “Design Prototypes: A Knowledge Representation Schema for Design.” AI Magazine 11 (4): 26–36.
Gero, J. S., and U. Kannengiesser.2004. “The Situated Function–Behaviour–Structure Framework.” Design Studies 25 (4): 373–391.doi:10.1016/j.destud.2003.10.010.
Gupta, S., and V. Krishnan.1998. “Product Family-Based Assembly Sequence Design Methodology.” IIE Transactions 30 (10): 933–945.doi:10.1023/A:1007524906201.
He, D., A. Kusiak, and T.-L. Tseng.1998. “Delayed Product Differentiation: A Design and Manufacturing Perspective.” Computer-Aided Design 30 (2): 105–113.doi:10.1016/S0010-4485(97)00045-6. Hejazi, S. M., D. Biswas, A. Venkiteswaran, J. J. Shah, and J. K. Davidson.2016. “Automated 1st Order
Tolerancing: Schema Generation.” In Conference Proceedings: International Design Engineering Tech-nical Conferences and Computers and Information in Engineering Conference. 2B. 8 vols, 1–14. New York: ASME. DETC2016-60147, V02BT03A020.
Homem de Mello, L. S., and A. C. Sanderson.1990. “AND/OR Graph Representation of Assembly Plans.” IEEE Transactions on Robotics and Automation 6 (2): 188–199.doi:10.1109/70.54734.
Jiao, J., and M. M. Tseng.2000. “Understanding Product Family for Mass Customization by Developing Commonality Indices.” Journal of Engineering Design 11 (3): 225–243.doi:10.1080/09544820075002 1003.
Jun, S., and C. Jun.2013. “Systematic Optimization of Concurrent Design of Product and Locating Strat-egy by Datum Flow Chain.” In Proceedings of the FISITA 2012 World Automotive Congress: Volume 11: Advanced Vehicle Manufacturing Technology. Vol. 199. 11 vols, 79–85. Lecture Notes in Electrical Engineering 199. Berlin: Springer-Verlag.
Kota, S., K. Sethuraman, and R. Miller. 2000. “A Metric for Evaluating Design Commonality in Product Families.” Journal of Mechanical Design – Transactions of the ASME 122 (4): 403.
doi:10.1115/1.1320820.
Lafou, M., L. Mathieu, S. Pois, and M. Alochet.2016. “Manufacturing System Flexibility: Product Flexibility Assessment.” Procedia CIRP 41: 99–104.doi:10.1016/j.procir.2015.12.046.
Mantripragada, R., and D. E. Whitney.1998. “The Datum Flow Chain: A Systematic Approach to Assem-bly Design and Modeling.” Research in Engineering Design 10 (3): 150–165.doi:10.1007/BF0160 7157.
Marguet, B., and L. Mathieu.1999. “Aircraft Assembly Analysis Method Taking into Account Part Geo-metric Variations.” In Integration of Process Knowledge into Design Support Systems, edited by H. Kals and F. van Houten, 365–374. Dordrecht: Springer.
Marguet, B., and L. Mathieu.2003. “Method for Geometric Variation Management from Key Charac-teristics to Specifications.” In Geometric Product Specification and Verification: Integration of Func-tionality, edited by P. Bourdet and L. Mathieu, 217–226. Dordrecht: Springer Netherlands; Springer Verlag.doi:10.1007/978-94-017-1691-8.
Martin, M. V., and K. Ishii.1996. “Design for Variety: A Methodology for Understanding the Costs of Products Proliferation.” In Proceedings of the ASME 1996 Design Engineering Technical Confer-ences and Computers in Engineering Conference, edited by J. M. McCarthy, 1–9. New York: ASME. 96-DETC/DTM-1610.
Martin, M. V., and K. Ishii.1997. “Design for Variety: Development of Complexity Indices and Design Charts.” In Proceedings of the ASME 1997 Design Engineering Technical Conferences, edited by B. Ravani, 1–9. New York: ASME. DETC97/DFM-4359.
Mathieu, L., and B. Marguet.2001. “Integrated Design Method to Improve Producibility Based on Prod-uct Key Characteristics and Assembly Sequences.” CIRP Annals – Manufacturing Technology 50 (1): 85–88.doi:10.1016/S0007-8506(07)62077-0.
Pahl, G., W. Beitz, and K. Wallace.2001. Engineering Design: A Systematic Approach. 2. rev. ed., 3. Print. London: Springer.
Sellakh, R., A. Rivière, N. Chevassus, and B. Marguet.2003. “An Assisted Method for Specifying ISO Tolerances Applied to Structural Assemblies.” In Geometric Product Specification and Verification: Integration of Functionality, edited by P. Bourdet and L. Mathieu, 288–299. Dordrecht: Springer Netherlands; Springer Verlag.doi:10.1007/978-94-017-1691-8.
Shukla, G., and D. E. Whitney.2001. “Systematic Evaluation of Constraint Properties of Datum Flow Chain.” In Proceedings of the 2001 IEEE International Symposium on Assembly and Task Planning (ISATP2001): Assembly and Disassembly in the Twenty-First Century, 337–343. Piscataway, NJ: IEEE. Siddique, Z., D. W. Rosen, and N. Wang.1998. “On the Applicability of Product Variety Design
Con-cepts on Automotive Platform Commonality.” In Proceedings of the ASME 1998 Design Engineering Technical Conferences. New York: ASME. 98-DETC/DTM-5661.
Simpson, T. W., J. Jiao, Z. Siddique, and K. Hölttä-Otto, eds.2014. Advances in Product Family and Product Platform Design: Methods & Applications. New York: Springer.
Söderberg, R., L. Lindkvist, and J. S. Carlson.2006. “Managing Physical Dependencies Through Loca-tion System Design.” Journal of Engineering Design 17 (4): 325–346.doi:10.1080/09544820500275 685.
Spensieri, D., J. S. Carlson, R. Bohlin, and R. Söderberg.2009. “Integrating Assembly Design, Sequence Optimization, and Advanced Path Planning.” In Conference Proceedings: International Design Engi-neering Technical Conferences and Computers and Information in EngiEngi-neering Conference. Vol. 1. 5 vols, 73–81. New York: ASME.
Stief, P., J.-Y. Dantan, A. Etienne, and A. Siadat.2018. “A New Methodology to Analyze the Func-tional and Physical Architecture of Existing Products for an Assembly Oriented Product Family Identification.” Procedia CIRP 70: 47–52.doi:10.1016/j.procir.2018.02.026.
Stief, P., J.-Y. Dantan, A. Etienne, A. Siadat, and G. Burgat.2019. “New Product Similarity Index Develop-ment with Application to an Assembly System Typology Selection.” Procedia CIRP 81: 1077–1082.
doi:10.1016/j.procir.2019.03.256.
Suh, N. P.2001. Axiomatic Design: Advances and Applications. The MIT-Pappalardo Series in Mechanical Engineering. New York: Oxford University Press.
Suh, N. P.2005. “Complexity in Engineering.” CIRP Annals – Manufacturing Technology 54 (2): 46–63.
doi:10.1016/S0007-8506(07)60019-5.
Thevenot, H. J., and T. W. Simpson.2006. “Commonality Indices for Product Family Design: A Detailed Comparison.” Journal of Engineering Design 17 (2): 99–119.doi:10.1080/09544820500275693. Thevenot, H. J., and T. W. Simpson. 2007. “A Comprehensive Metric for Evaluating
Com-ponent Commonality in a Product Family.” Journal of Engineering Design 18 (6): 577–598.
doi:10.1080/09544820601020014.
Turner, J. U., S. Subramaniam, and S. Gupta.1992. “Constraint Representation and Reduction in Assembly Modeling and Analysis.” IEEE Transactions on Robotics and Automation 8 (6): 741–750.
doi:10.1109/70.182674.
Wacker, J. G., and M. Treleven.1986. “Component Part Standardization: An Analysis of Commonality Sources and Indices.” Journal of Operations Management 6 (2): 219–244.doi:10.1016/0272-6963(86) 90026-4.
Whitney, D. E.2004. Mechanical Assemblies: Their Design, Manufacture, and Role in Product Develop-ment. Oxford series on advanced manufacturing. New York: Oxford University Press.
Xia, Q., A. Etienne, J.-Y. Dantan, and A. Siadat.2018. “Reconfigurable Machining Process Planning for Part Variety in New Manufacturing Paradigms: Definitions, Models and Framework.” Computers & Industrial Engineering 115: 206–219.doi:10.1016/j.cie.2017.11.010.