Science Arts & Métiers (SAM)
is an open access repository that collects the work of Arts et Métiers Institute of
Technology researchers and makes it freely available over the web where possible.
This is an author-deposited version published in: https://sam.ensam.eu Handle ID: .http://hdl.handle.net/10985/12557
To cite this version :
Guilhem GRIMAUD, Bertrand LARATTE, Nicolas PERRY - How to Develop Indicators to Assess the Sustainability of Recycling Processes? - In: 10th International Symposium on Environmentally Conscious Design and Inverse Manufacturing, Taiwan, 2017-11-30 - Going Green EcoDesign 2017 - 2017
Any correspondence concerning this service should be sent to the repository Administrator : archiveouverte@ensam.eu
Proceedings of EcoDesign 2017 International Symposium
How to Develop Indicators to Assess the Sustainability of Recycling
Processes?
Guilhem Grimaud 1, 2, Bertrand Laratte 2, 3 , Nicolas Perry 2
1
MTB Recycling, Trept, France
2 Arts et Métiers ParisTech, CNRS, I2M Bordeaux, F-33400 Talence, France 3 APESA-Innovation, France
Abstract
The circular economy offers a partial answer to resource depletion. Recycling is inherent in the circular economy strategies that why industrial companies look for stepping recycling rates up. But recycling approaches are often motivated by economic considerations. Yet the recycling paths are multiple and it is important to determine the best path according to different categories of indicators and not only profit. We worked with MTB, an engineering and manufacturing company of recycling equipment. Our work aims to determine which are the most relevant indicators to assess the sustainability performance of recycling processes. We selected 8 indicators in 3 different categories: technical, environmental and economic. The technical indicators are determined based on a common framework established using the Environmental Technology Verification (ETV) protocol. Environmental and economic indicators results are given using a process Life Cycle Inventory (LCI) database. Information stored in the database using both variable and invariable unit process. The calculation is respectively done with Life Cycle Assessment (LCA) and Life Cycle Cost (LCC) methodologies. During the design phases, specific information is provided to establish the unit process performance of each recycling scenario.
In this article, we present how the performance indicators were selected and calculated in regard with the decision support methodology build up.
Keywords:
Recycling, Performance Indicator, LCA, LCC, ETV
1 INTRODUCTION
The rise of the world population and its life conditions go hand in hand with the growth of energy and raw material consumption as well as the steady growth of CO2
concentration in the atmosphere [1, 2]. The consumption growth comes with an increase in the amount of waste produced annually [3]. The demand for primary resources is not sustainable long term [4, 5]. It is therefore vital to find industrial solutions to maintain equivalent standards of living while also decoupling resource use and demand [6].
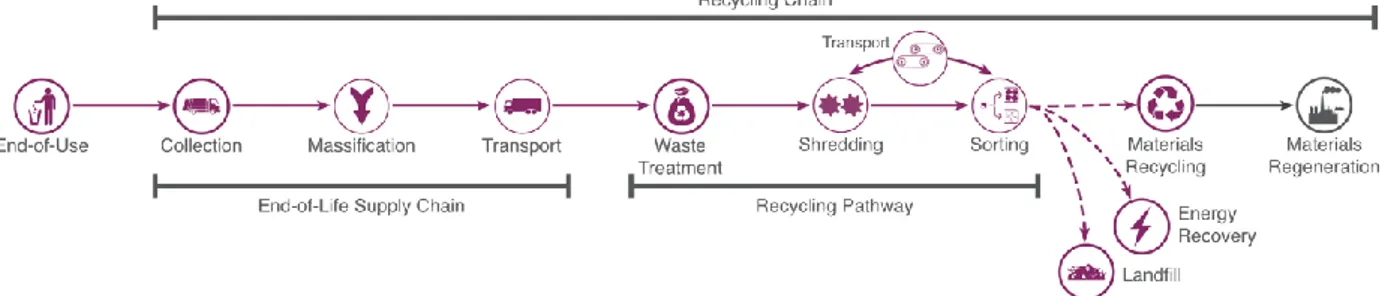
The circular economy offers a partial answer to resource depletion [7]. Recycling is inherent in the circular economy strategies that why industrial companies look for stepping recycling rates up. To do so they implement product centric End-of-Life (EoL) solutions using closed loop recycling [8, 9]. Those strategies show good environmental performance results but a specific EoL requires a suitable and efficient reverse supply chain to reach the recycling plant. The different steps of an EoL scenario are shown on the Fig. 1. Also, as the motivation is mainly profit, the generalisation of closed loop recycling is slowed down [10–12].
MTB company, an international manufacturer of recycling technologies and a recycling operator in France, has launched a sustainability strategy. The aim of the strategy is to reduce the environmental impact of its industrial activities. To do so, MTB started to evaluate its environmental performance with evaluation tools such as Life Cycle Assessment (LCA) and Material Flow Analysis (MFA). The first evaluation has been realised on an aluminium recycling process using only mechanical separation process instead of smelting. Results show the advantages of mechanical processes [13]. Based on these results from environmental evaluations, MTB implemented corrective measures to increase its environmental performance level [14]. Beyond optimising recycling pathways in operation, these results also helped us to guide the research for new recycling processes which have been designed to be more sustainable [15].
All these steps help to enrich the company’s own knowledge, but the evaluation process is long and requires strong stakeholder involvement at each assessment step. To systematise this new practice and provide data relevancy to decision makers, a methodology was needed to integrate the Life Cycle Management (LCM) approach in MTB design phase. For waste that is not recycled in closed loop it is necessary to adapt the recycling pathway. Yet the recycling pathways are multiple and it is important to determine the best path according to different categories of indicators and not only financial performance.
2 MATERIAL AND METHODS
2.1 Methodological Evaluation Framework
As already explain in previous publications [16], recycling pathways are mostly based on common elementary technologies [17, 18]. And the key aspect to implement efficient recycling pathways relies on the technology selection and the technology order selected. According to the literature [19] recycling processes can be classified in 3 families: shredding, separation and transport. In addition to these 3 families of process unit, there is the flow unit family that makes the link between unit process. The Fig. 2 presents the modelling of the interconnections between each unit process and its associate in/output flows.
Fig. 2 Modelling of a recycling pathway step with a unit process and its related flows
This segmentation allows us to build a database to evaluate the performance of each recycling process insert in a recycling pathway. To enable the three-part performance evaluation (Fig. 3), the database includes technical, environmental and economic dataset. On the one hand, for each data a part of the values is fixed. These are the invariant data regardless the type of transformation performed by the unit process. This is mainly the impact of manufacturing, its price without the options or the weight of the equipment. On the other hand, in addition to these fixed values, the engineering team can set value for adjusting unit processes to customer needs. These are the operating settings. These actions will have a direct effect on the performance of the recycling pathway.
Fig. 3 Three-part key performance indicators (KPI) to evaluate ideal recycling pathways
2.2 Step by Step Evaluation
Using the bill of specifications and the details provide by the customer, the general framework of the recycling pathway is defined. The aim is to describe the outlines of the preliminary draft. The draft of the initial specifications is based on the reflection on the specific constraints, delays and costs of the project.
The customer defines purpose and thresholds for the recycling pathway. The engineering team validate or not main orientation of the recycling chain. Base on that information and the general settings, the MTB engineering team can provide the first recycling pathway guidance. The result is to provide a recycling pathway proposal. This proposal is based on a recycling pathway synoptic consisting of the main steps and the possible technologies to reach the thresholds.
Based on the synoptic, the commercial team in discussion with the engineering team can provide a selection of the appropriate technology for each unit process. Next using a case database and the expertise from MTB engineering team the operating settings are set for each unit process.
All the elements filled up so far make it possible to establish the technical, economic and sustainable performance of each unit process. The calculation is made using a process database that relies on fixed and variable values. For the variable values, they are calculated using the specific flow information (Fig. 2).
To obtain the key performance indicators (KPI) for recycling pathway every unit process performance is summed up to obtain the final result. On the one hand, a synthetic evaluation is provided to the customer in order to initiate a discussion. On the other hand, the results help the engineering team to optimise the initial pathway proposal.
2.3 Performance Indicators Selection
As already shown on the Fig. 3, the performance evaluation is a three-part evaluation. For each performance category, we have selected 3 performance indicators that seems to be the most relevant for the recycling pathway evaluation. This selection was made in 2 stages. First, we have selected indicators that are necessary for the stakeholders and are currently missing or not robust enough. On the other hand, we used the Environmental Technology Verification (ETV) protocol [20,21] methodology to introduce a common claims basis for all recycling processes.
We chose not to aggregate these indicators. This will allow to establish a panorama and helps stakeholders to start a discussion about each performance regarding to the other one. It is not a question of producing a classification of recycling pathway subject to caution.
2.4 Indicators from ETV Verification
The Environmental Technology Verification (ETV) is a new tool to help innovative environmental technologies reach the market. The problem is that many clever new ideas that can benefit environment and health are not taken up simply because they are new and untried. Under ETV, if the owner of the technology wishes to, the claims about innovative environmental technologies can be verified by qualified third parties called Verification Body. The
Statement of Verification delivered at the end of the ETV
verification process can be used as evidence that the claims made about the innovation is both credible and scientifically sound [21]. One objective of the European commission with the ETV program is to promote environmental technologies by providing technology developers, manufacturers and investors access to third-party validation of the performance of innovative environmental technologies [22].
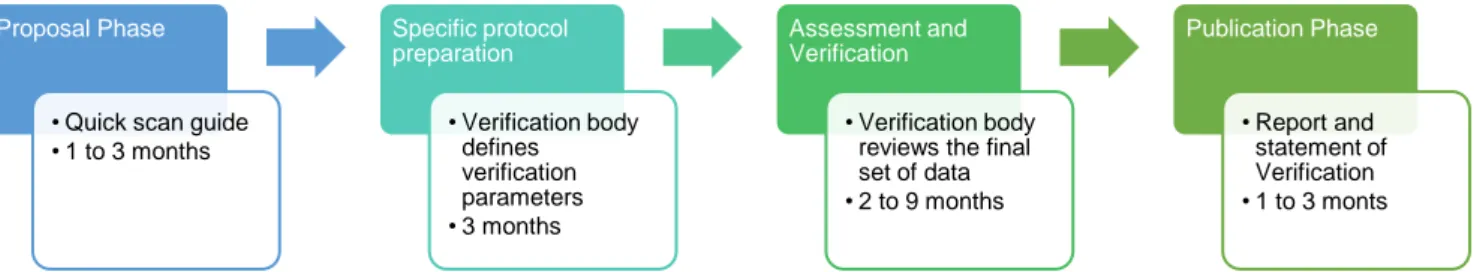
The EU ETV program just ended its pilot phase as the ISO 14034 standard was published [23]. The main steps of the ETV program are given on Fig. 4. All ETV verification steps combine together last 6 to 18 months [24]. In comparison, the average designing time is between 3 and 6 months. Although ETV verification time is too long for the design team to evaluate each recycling pathway, we have decided to launch a verification on a specific recycling process owned by MTB at Trept. The aim is to implement the general requirements of the program into our methodological framework.
Fig. 4 Main Steps of the European Environmental Technology Verification
One of the information we want to get from the ETV verification is the general claims applicable to all recycling pathways. To do so, we also confront our claims with the claims arising from other ETV verification done on recycling technologies. Currently, in addition to our recycling technology only one recycling process is under ETV verification in Europe [25]. The claims from our two verification are similar and relate to the same performance indicators [26]. As a result, the ETV verification allowed us to establish both technical indicators for the characterisation of unit processes which depended on technology choice, and operating setting definition and KPI that are used to establish the global performance of
recycling pathway proposals. The three technical KPI and two other KPI, one for sustainable performance and one for economic performance were established using the ETV verification.
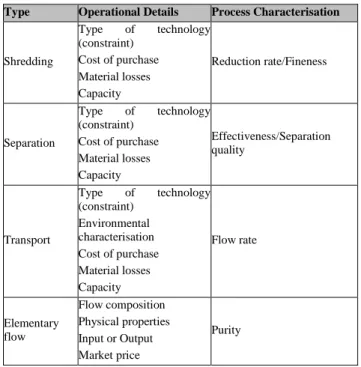
For the 3 families of unit process, the Tab. 1 gives the associate operational details and the technical process characterisation define using the ETV program. For each specific unit process, technical characterisation will help to define the most suitable process for each purpose of the recycling pathway step.
Proposal Phase
• Quick scan guide • 1 to 3 months Specific protocol preparation • Verification body defines verification parameters • 3 months Assessment and Verification • Verification body reviews the final set of data • 2 to 9 months Publication Phase • Report and statement of Verification • 1 to 3 monts
Tab. 1 Variables and characterisation for recycling each unit process family
Type Operational Details Process Characterisation
Shredding Type of technology (constraint) Cost of purchase Material losses Capacity Reduction rate/Fineness Separation Type of technology (constraint) Cost of purchase Material losses Capacity Effectiveness/Separation quality Transport Type of technology (constraint) Environmental characterisation Cost of purchase Material losses Capacity Flow rate Elementary flow Flow composition Physical properties Input or Output Market price Purity 3 RESULTS
3.1 Technical Performance Evaluation
The technical KPI are based on the recovery claims express in every ETV verification. We have split it into three key indicators to characterise recycling pathways:
Recycling rate Recovery rate Landfill rate
The three technical KPI are expressed in percentage (%) of the total amount of waste proceeded. The calculation is made using the recommendations from ISO 22628 [27]. As our scope focus on recycling pathways made from pre-recycling processes, the collection rate is not a relevant indicator for technical performance.
3.2 Environmental Performance Evaluation
The environmental KPI from the ETV verification concern electricity consumption. This is an environmental assessment inventory data that is representative of the eco-efficiency of a recycling pathway [28]. In addition to the inventory data on the energy consumption of the recycling pathway, we added 2 environmental KPI calculated using ILCD methodology [29]:
Climate change: expressed in kilograms CO2
equivalent from Bern model [30]
Non-renewable resource depletion: expressed in kilograms antimony (Sb) equivalent [31]
The environmental data for specific recycling processes are rare and not available in the current LCA database (ELCD, Gabi, Ecoinvent). Inventory data remains to be collected and assessed to build a strong dataset. Our team has started to build an environmental database for recycling processes.
3.3 Economic Performance Evaluation
The economic KPI from the ETV verification concerns the treatment capacity of the recycling pathway. This indicator helps stakeholders to estimate the Technology Readiness Level (TRL) [32] of the unit process technology and the feasibility of the process regarding total waste deposits.
In addition, we have selected two other economic KPI: Cost per ton (expressed in €), which including
initial investment costs and operating costs Profit from recycled materials sales (expressed in
€)
For the economic dataset, data is easily accessible through the information provided by manufacturers and recyclers feedback. The Life Cycle Cost (LCC) analysis is used to determine the economic performance of each unit process. The LCC methodology used to consider both the costs of each system in addition to the profit from recycled materials sales. But we do not include the costs of the environmental impact [23].
4 DISCUSSION AND CONCLUSION 4.1 Discussion
The evaluation methodology tool provided by our team aims to help the engineering and commercial team to implement more sustainable recycling pathway. It is not a matter of providing a comprehensive assessment for each recycling pathway during the design phase, but it is to communicate to industrial customers multiple comprehensive KPI results in addition to economic performance indicators. These additional performance indicators should allow the engineering team to brainstorm solutions to optimise recycling pathway before their commissioning. With an iterative approach, designer could optimise flows and processes to improve eco-effectiveness of recycling chains.
Although recycling pathways are not new, industrial optimisation has not been fully conducted [25]. The unconstructive approach, the complexity of waste and the lack of control over incoming flows limit the drafting of theoretical principles. The increasing interest in waste recycling and the evolving regulations in force steer the waste sector to adopt an increasingly industrial approach. To accompany this transition, it is becoming urgent to integrate advanced tools to choose the right technology during the design process.
4.2 Conclusion
Even though plenty of technical options exist for developing products recycling, the recycling solutions selecting motivations are too often led by the pursuit of profit growth which leads to a greater inefficiency [26]. By communicating additional performance indicators, we are convinced that this approach can evolve. And that new issues will be introduced in trade negotiations for recycling pathway.
As a next step, we need to build a sufficiently complete and robust database to support the evaluation of recycling pathway. This approach must be enriched in the future. It is also required to facilitate the improvement of the quality of results during the refining process variables and input parameters.
AKNOWLEDGMENT
The authors want to thank MTB Recycling and the French National Association for Technical Research (ANRT) for the funding of the PhD study (CIFRE Convention N ° 2015/0226) of the first author.
REFERENCES
[1] T.F. Stocker, D. Qin, G.-K. Plattner, M.M.B. Tignor, S.K. Allen, J. Boschung, A. Nauels, Y. Xia, V. Bex, P.M. Midgley, Climate change 2013: the physical science basis. Climate change 2013: the physical science basis, Cambridge, Intergovernmental Panel on Climate Change Thomas, Cambridge, 2013.
[2] C. Yao, K. Feng, K. Hubacek, Driving forces of CO2 emissions in the G20 countries: An index decomposition analysis from 1971 to 2010, Ecol. Inform. 26 (2015) 93–100. doi:10.1016/j.ecoinf.2014.02.003.
[3] EUROSTAT, Statistics on Waste in Europe, Stat. Explain. (2015). http://ec.europa.eu/eurostat/statistics-explained/index.php/Waste_statistics/fr (accessed April 3, 2016).
[4] R. Miehe, R. Schneider, F. Baaij, T. Bauernhansl, Criticality of Material Resources in Industrial Enterprises – Structural Basics of an Operational Model, 23rd CIRP Conf. Life Cycle Eng. 48 (2016) 1–9. doi:10.1016/j.procir.2016.03.035.
[5] Markus Hametner, A. Dimitrova, A. Dimitrova, P. Schindler, Sustainable development in the European Union - 2016 Edition, EUROSTAT, Brussels, 2016. doi:10.1002/(SICI)1099-0976(199711)7:6<181::AID-EET134>3.0.CO;2-S.
[6] H. Schandl, Decoupling global environmental pressure and economic growth: scenarios for energy use, materials use and carbon emissions, J. Clean. Prod. (2015) 1–12. doi:10.1016/j.jclepro.2015.06.100.
[7] W. McDonough, M. Braungart, Cradle to cradle: Remaking the Way We Make Things, Edition al, Manifesto, Paris, 2012.
[8] G. Rebitzer, P. Fullana, B.P. Weidema, O. Jolliet, Recycling, Close-Loop Economy, Secondary Resources, in: 10th LCA Case Study Symp., 2003: pp. 106–108.
[9] J.M. Allwood, M.F. Ashby, T.G. Gutowski, E. Worrell, Material efficiency: A white paper, Resour. Conserv. Recycl. 55 (2011) 362–381. doi:10.1016/j.resconrec.2010.11.002. [10] J. Butterworth, A. Morlet, H.P. Nguyen, J. Oppenheim, M.
Stuchtey, Towards the Circular Economy: Economic and Business Rationale for an Accelerated Transition, Ellen MacArthur Found. Vol. 1 (2013) 98. doi:10.1162/108819806775545321.
[11] A. Gahleitner, Closing the loop: Next steps critical for Europe’s Circular Economy, Eur. Alum. Assoc. 2 (2015) 2. [12] G. Lavery, N. Pennell, Le Nouveau Modèle Industriel : Plus de
bénéfices, plus d’emplois et moins d’impact sur l’environnement, Interface, 2014.
[13] G. Grimaud, N. Perry, B. Laratte, Life Cycle Assessment of Aluminium Recycling Process: Case of Shredder Cables, in: Procedia CIRP, Berlin, 2016. doi:10.1016/j.procir.2016.03.097. [14] G. Grimaud, N. Perry, B. Laratte, Reducing Environmental Impacts of Aluminium Recycling Process Using Life Cycle Assessment, 12th Bienn. Int. Conf. EcoBalance. October (2016) 7. doi:10.1016/j.procir.2016.03.097.
[15] G. Grimaud, B. Laratte, N. Perry, To Transport Waste or Transport Recycling Plant: Insights from Life-Cycle Analysis, in: Soc. Mater. Int. Conf. (SAM 11), SOVAMAT, Trondheim, 2017: pp. 1–18.
[16] G. Grimaud, N. Perry, B. Laratte, Decision Support Methodology for Designing Sustainable Recycling Process Based on ETV Standards, Int. Conf. Sustain. Mater. Process. Manuf. SMPM 2017. 7 (2017) 72–78. doi:http://dx.doi.org/10.1016/j.promfg.2016.12.020.
[17] UNEP, Recycling Rates of Metals, Internatio, Paris, 2011. [18] A. Fisher, Functional versus Innovative Products, (2012) 8. [19] K. Heiskanen, Theory and Tools of Physical
Separation/Recycling, in: Handb. Recycl., Elsevier Inc., Amsterdam, 2014: pp. 39–61. doi:10.1016/B978-0-12-396459-5.00005-2.
[20] European Commission, General Verification Protocol for EU Environmental Technology Verification proragmme - Version 1.1, (2014) 74.
[21] European Commission, EU Environmental Technology Verification, Environ. Technol. Verif. Progr. (2016) 15. http://ec.europa.eu/environment/etv/ (accessed July 13, 2016). [22] European Commission, ETV Program - Key documents and
links, EU Environ. Technol. Verif. Program. (2016) 1. http://ec.europa.eu/environment/etv/links.htm (accessed June 25, 2016).
[23] International Standard Organization, ISO / WD2 14034 Environmental management- Environmental technology verification and performance evaluation Environmental
management — Environmental Technology Verification, International, 2013.
[24] European Commission, A Comprehensive Guide for Proposers to the EU Environmental Technologies Verification Pilot Programme, Project Ad, European Commission, Luxembourg, 2012.
[25] Re Match, Mechanical Turf Recycling process under ETV Certification, (2016) 30. http://re-match.dk/environment-legislation/etv-certification (accessed July 17, 2017).
[26] S. Ausset, C. Michaud, DRAFT - Specific verification protocol for MTB Cables Recycling Process, EU Environ. Technol. Verif. Pilot Program. (2017) 75.
[27] International Standard Organization, ISO 22628:2002 - Road vehicles -- Recyclability and recoverability -- Calculation method, 2002. https://www.iso.org/standard/35061.html (accessed May 31, 2017).
[28] C. Herrmann, S. Blume, D. Kurle, C. Schmidt, S. Thiede, The Positive Impact Factory–Transition from Eco-efficiency to Eco–effectiveness Strategies in Manufacturing, 22nd CIRP Conf. Life Cycle Eng. 29 (2015) 19–27. doi:10.1016/j.procir.2015.02.066.
[29] JRC - Institute for Environment and Sustainability, Characterisation factors of the ILCD Recommended Life Cycle Impact Assessment methods - EUR 25167, European Commission, Brussels, 2012. doi:10.2788/60825.
[30] IPCC, Climate Change 2007 Synthesis Report, 2007. doi:10.1256/004316502320517344.
[31] L. van Oers, A. De Koning, J.B. Guinée, G. Huppes, Abiotic resource depletion in LCA, Public Work. Water Manag. (2002) 1–75. depletion; LCA; materials, minerals.
[32] International Organization for Standardization, ISO 16290:2013 Space systems — Definition of the Technology Readiness Levels (TRLs) and their criteria of assessment, 2013. https://www.iso.org/obp/ui/#iso:std:iso:16290:ed-1:v1:en (accessed July 17, 2017).