This article has been accepted for publication and undergone full peer review but has not been through the copyediting, typesetting, pagination and proofreading process which may lead to differences between this version and the Version of Record. Please cite this article as doi: 10.1029/2019GL086527
Szalay Jamey, R. (Orcid ID: 0000-0003-2685-9801) Allegrini Frederic (Orcid ID: 0000-0003-0696-4380) Bagenal Fran (Orcid ID: 0000-0002-3963-1614) Bolton Scott, J (Orcid ID: 0000-0002-9115-0789) Bonfond Bertrand (Orcid ID: 0000-0002-2514-0187) Clark George (Orcid ID: 0000-0002-5264-7194)
Connerney John, E. P. (Orcid ID: 0000-0001-7478-6462) Ebert Robert, Wilkes (Orcid ID: 0000-0002-2504-4320) Gershman Daniel, J (Orcid ID: 0000-0003-1304-4769) Giles Rohini, S (Orcid ID: 0000-0002-7665-6562) Gladstone Randy (Orcid ID: 0000-0003-0060-072X) Greathouse Thomas, K. (Orcid ID: 0000-0001-6613-5731) Hospodarsky George, Blair (Orcid ID: 0000-0001-9200-9878) Imai Masafumi (Orcid ID: 0000-0002-2814-4036)
Kurth William, S (Orcid ID: 0000-0002-5471-6202) Kotsiaros Stavros (Orcid ID: 0000-0003-2636-5545) Louarn Philippe (Orcid ID: 0000-0003-2783-0808) McComas David, J. (Orcid ID: 0000-0002-9745-3502) Saur Joachim (Orcid ID: 0000-0003-1413-1231) Sulaiman Ali, H. (Orcid ID: 0000-0002-0971-5016) Wilson Robert, J. (Orcid ID: 0000-0001-9276-2368)
Alfvénic Acceleration Sustains Ganymede’s Footprint Tail Aurora
J. R. Szalay1, F. Allegrini2,3, F. Bagenal4, S. J. Bolton2, B. Bonfond5, G. Clark6, J. E. P. Connerney7,8, R. W. Ebert2,3, D. J. Gershman8, R. S. Giles2, G. R. Gladstone2, T. Greathouse2, G. B. Hospodarsky9, M. Imai9, W. S. Kurth9, S. Kotsiaros8, P. Louarn10, D. J. McComas1, J. Saur11, A. H. Sulaiman9, R. J. Wilson4
1Department of Astrophysical Sciences, Princeton University, Princeton, New Jersey, USA 2Southwest Research Institute, San Antonio, Texas, USA
3Department of Physics and Astronomy, University of Texas at San Antonio, San Antonio, Texas, USA
4Laboratory for Atmospheric and Space Physics, University of Colorado Boulder, Boulder, Colorado, USA
5Space sciences, Technologies and Astrophysics Research Institute, LPAP, Université de Liège, Liège, Belgium
6Johns Hopkins University Applied Physics Lab, Laurel, Maryland, USA 7Space Research Corporation, Annapolis, MD USA
8Goddard Space Flight Center, Greenbelt, Maryland, USA
9Department of Physics and Astronomy, University of Iowa, Iowa City, Iowa, USA 10Institut de Recherche en Astrophysique et Planétologie, Toulouse, France
Key Points
First in-situ particles and fields measurements connected to Ganymede’s auroral tail are reported.
Alfvén wave activity is observed with Poynting fluxes of ~100 mW/m2
capable of accelerating electrons into the atmosphere.
Ganymede’s footprint tail contains electron populations consistent with Alfvénic acceleration, and precipitating energy fluxes of ~11 mW/m2.
Abstract
Integrating simultaneous in-situ measurements of magnetic field fluctuations, precipitating electrons, and ultraviolet auroral emissions, we find that Alfvénic acceleration mechanisms are responsible for Ganymede’s auroral footprint tail. Magnetic field perturbations exhibit enhanced Alfvénic activity with Poynting fluxes of ~100 mW/m2. These perturbations are capable of accelerating the observed broadband electrons with precipitating fluxes of ~11 mW/m2, such that Alfvénic power is transferred to electron acceleration with ~10% efficiency. The UV emissions are consistent with in-situ electron measurements, indicating 13 ± 3 mW/m2 of precipitating electron flux. Juno crosses flux tubes with both upward and downward currents connected to the auroral tail exhibiting small-scale structure. We identify an upward electron conic in the downward current region, possibly due to acceleration by inertial Alfvén waves near the Jovian ionosphere. In concert with in-situ observations at Io’s footprint tail, these results suggest that Alfvénic acceleration processes are universally applicable to magnetosphere-satellite interactions.
Plain Language Summary
Jupiter’s moon Ganymede interacts with the planet’s rapidly rotating magnetic field, which generates an aurora in the Jovian upper atmosphere. The Juno spacecraft crossed magnetic field lines connected to this aurora. We found that a specific type of wave, similar to a wave produced when a string is plucked, is responsible for accelerating the electrons sustaining this aurora. This type of interaction between a moon and the planet it orbits is likely a common process occurring at other exoplanetary systems.
1. Introduction
Jupiter’s auroral features are diverse and complex, consisting of separate emission regions linked to different locations in the magnetosphere and many different physical mechanisms [e.g. Grodent et al. 2015]. While many of these auroral features map to broad areas in the magnetosphere, the aurorae generated by the interaction of Jupiter’s rotating magnetosphere with the Galilean moons allow for a more precise determination of the auroral source regions and physical processes sustaining their aurora.
Ganymede’s auroral signature was discovered in ultraviolet (UV) images of Jupiter’s aurora [Clarke et al. 2002] and is observed to have multiple auroral spots downstream of its main spot, whose separation varies with Ganymede’s System III longitude [Bonfond et al. 2013]. A more continuous auroral tail has also been observed for Ganymede, and remote sensing observations suggest this tail is sustained by reflections of Alfvén waves generated by Ganymede’s interaction with Jupiter’s magnetosphere [Bonfond et al. 2017a]. The morphology and generation of Ganymede’s auroral signatures are expected to be similar to Io’s tail [Bonfond et al. 2017b], such that it has a Main Alfvén Wing (MAW) spot, a Transhemispheric Electron Beam [Bonfond et al. 2008], and a footprint tail aurora. Similar to Io, high-resolution infrared
images have revealed Ganymede’s tail to be highly structured [Mura et al. 2018]. In-situ observations by the Juno spacecraft have bolstered the case that Alfvénic acceleration is sustaining Io’s footprint tail aurora [Bonfond et al. 2009] from measurements of broadband precipitating electron fluxes [Szalay et al. 2018] and Alfvénic magnetic signatures [Gershman et al. 2019]. Since our understanding of Io’s auroral interaction is coalescing around a dominantly Alfvénic acceleration mechanism sustaining both the MAW and tail, and similar acceleration processes are operating at Saturn’s moon Enceladus [e.g. Sulaiman et al. 2018], identifying the acceleration mechanism at another Jovian moon allows us to test the assertion that this process is more broadly applicable to moon-magnetosphere interactions as a whole [Bonfond et al. 2017a; 2017b].
While Io’s auroral signature is the best catalogued of the Galilean moons due to it being the brightest satellite interaction, Ganymede’s auroral footprint characteristics have also been well-documented. Ganymede’s footprint aurora varies on three different timescales, the largest corresponding to Jupiter’s orbital period of ~10 hrs, where the footprint emission is strongest when Ganymede is exposed to the largest plasma sheet densities [Grodent et al. 2009]. The average emitted power of Ganymede’s auroral footprint is estimated to range from 0.2-1.5 GW [Grodent et al. 2009] and 0.8-6.3 GW [Bonfond et al. 2017b]. The total theoretically calculated Poynting fluxes generated by Ganymede’s interaction are estimated to lie between 1-150 GW depending on Ganymede’s position in Jupiter’s plasma sheet [Saur et al. 2013]. The main footprint emission feature covers an area of 5 x 10⁵ km2 at Jupiter’s atmosphere [Grodent et al. 2009], corresponding to a region 8-20 RG wide in Ganymede’s orbital plane (RG = 2634 km is Ganymede’s radius). This region is significantly larger than the diameter of Ganymede due to Ganymede’s own magnetosphere providing a factor of ~10 larger obstacle to the plasma flow and enhancing the size of its interaction region with Jupiter’s magnetospheric plasma [Jia et al. 2008; Paty et al. 2008; Saur et al. 2013]. Accounting for the footprint area, the average emitted power over the footprint is 0.4-13 mW/m2. Assuming a 10% conversion efficiency from incident electron power to auroral emission power [Gérard & Singh, 1982; Grodent et al. 2001; Gustin et al. 2012], this corresponds to an average incident electron energy flux of 4-130 mW/m2 for Ganymede’s main auroral spot. Similar incident energy fluxes are inferred from a decade of Hubble Space Telescope observations of Ganymede’s auroral footprint [Wannawichian et al., 2010]. Its footprint tail fluxes are expected to follow an exponential decay in power as a function of angular separation from the main spot, with an e-folding distance of 11˚ [Bonfond et al. 2017a].
The Juno mission [Bolton et al. 2017] provides an unparalleled opportunity to investigate the acceleration processes driving Ganymede’s complex auroral phenomena as the spacecraft directly transits flux tubes connected to this aurora. Magnetic field perturbations and the characteristics of the electrons responsible for causing emission in the Jovian atmosphere hold the clues to how this aurora is sustained. One auroral signature of particle acceleration/heating is the production of conics, where charged particle populations exhibit peak fluxes at oblique pitch angles [Klumpar et al. 1979]. Observations of conics give insight into how electrons are accelerated on auroral field lines. Electron conics were first observed with the DE-1 spacecraft [Menietti and Burch, 1985], and have been associated with various auroral phenomena [Lysak 1993] such as parallel or perpendicular heating [e.g. Menietti and Burch, 1985; Temerin and Cravens, 1990] and low-frequency parallel electric fields [e.g. Lundlin et al. 1987; Andre and Eliasson, 1992; Thompson and Lysak, 1996]. They have been observed frequently at Jupiter with Juno, likely driving the cyclotron maser instability, and are suggested to be due to inertial Alfvén waves [Louarn et al. 2018].
We focus on data taken when Juno transited magnetic field lines connected to Ganymede’s auroral footprint tail, reporting on a variety of auroral phenomena such as broadband precipitating electrons, Alfvénic perturbations to the magnetic field, and up-going electron conics. In Section 2, we discuss the observation geometry and describe the correlation between remote UV and in-situ fields and particle measurements necessary to link these measurements to the Ganymede footprint tail. We discuss the specific details of the in-situ measurements in Section 3 and conclude with a discussion in Section 4.
2. Correlating Remote and In-Situ measurements
Ganymede orbits Jupiter at 15 Jovian radii (RJ), twice per orbit crossing Jupiter’s current sheet that distends the magnetospheric magnetic field and makes it difficult to precisely trace magnetic field lines from its location to the Jovian atmosphere. Instead of correlating features in Juno plasma data to their equatorially mapped regions as done previously [e.g. Allegrini et al. 2017; Szalay et al. 2017], we link in-situ measurements of particles and fields with near-simultaneous UV images of the Jovian auroral emissions [e.g. Ebert et al. 2019; Gérard et al. 2019].
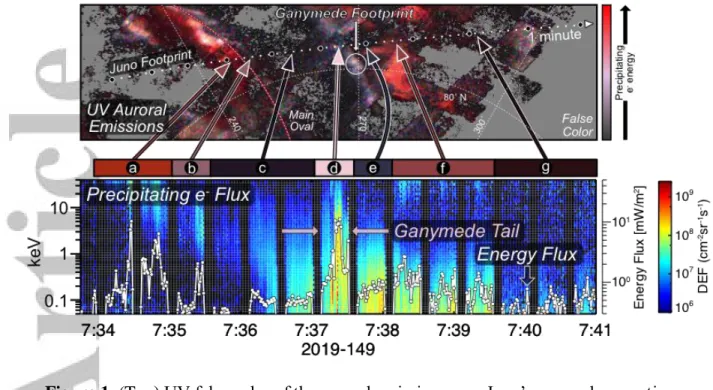
The top panel of Figure 1 shows a false-color UV image taken by Juno’s Ultraviolet Spectrograph (UVS) [Gladstone et al. 2017] accumulated just prior to Juno’s 20th perijove over 10 minutes on 2019-149 (May 29) from 7:35:02 to 7:45:02 UTC (during which Ganymede has moved less than 1˚). These colors can be qualitatively compared to precipitating electron energies observed in-situ.
Juno’s magnetic footprint is shown, traced from Juno’s position to 400 km above the 1 bar level using the JRM09 field model [Connerney et al. 2018], which incorporates a current sheet model [Connerney et al. 1981]. Juno’s footprint moves from left to right in this image and the time between circles is 1 minute. A nominal location for the main auroral oval is denoted with the solid red and dashed white line in the left half of the image. Ganymede’s main auroral spot is the pink feature circled under the “Ganymede Footprint” label and arrow, with the tail extending up and left such that Juno’s mapped footprint crossed it 8˚ down-tail. Beginning on the left side of the image, Juno is transiting across Jupiter’s polar region, where there is limited auroral emission coverage by UVS. Juno then encounters magnetic field lines connected to main auroral oval, where the polar edge has a higher average energy incident to the atmosphere (a), shown in red, immediately followed by an auroral region with lower incident energy (b), shown in pink/maroon. Following this, it transits a region with very little auroral emission for about a minute (c). It then encounters Ganymede’s footprint tail (d), which extends from the Ganymede MAW upward in this image. After this, it encounters a small region with low emission (e), followed by a region with high incident energy for about a minute and a half (f) and then encounters another region with low emission (g).
Uncertainties in the magnetic field mapping can lead to time shifts when comparing the emission thought to be underfoot to in-situ particle and fields data. These effects can be more drastic when mapping from the northern hemisphere, due to the localized magnetic anomaly in this hemisphere [Grodent et al. 2008]. Additionally, the latitude of Ganymede’s auroral footprint can vary by 2˚ depending on current sheet properties [Grodent et al. 2009], adding to the complexities in determining its exact auroral mapping. Therefore, we do not compare Juno’s location with field lines expected to map to Ganymede’s orbit in the equatorial plane. Instead, we directly correlate emission features along Juno’s mapped footprint to precipitating electron fluxes measured by the Jovian Auroral Distributions Experiment (JADE) [McComas
et al. 2017], which exhibit similar temporal and energy structure. The bottom panel of Figure 1 shows JADE electron differential energy fluxes (DEF) for precipitating electrons able to produce auroral emissions (observed in the loss cone) during this time. Pitch angles are calculated using the broadcast magnetic field onboard Juno [Connerney et al. 2017] at a cadence of 1 Hz. Overlaid on this spectrogram is the total downward precipitating energy flux (EF), described in more detail in Section 3.
In region (a), JADE observes high energy electrons, initially extending above JADE’s energy range, then peaking in DEF at ~20 keV towards the end of (a). Subsequently, it measures a downward flux of electrons at lower average DEF energies of 2-20 keV in region (b). Region (c) is initially mostly void of downward electron fluxes, then transitions to a smaller low energy component extending below 0.1 keV. In region (d), we observe a highly structured enhancement in downward energy flux, which is the focus of this study and will be shown in more detail in Section 3. Region (e) returns to lower energy fluxes, similar to the 2nd half of region (c). In region (f), JADE observed an enhancement in high-energy downward fluxes extending above ~10 keV. In region (g), JADE observes very low fluxes without appreciable structure.
Comparison of the temporal order of features seen as Juno transits this region by both UV and in-situ electron measurements provides a high degree of correlation, both in average incident energy and feature duration. Given the high fidelity of correlation between the auroral emission image and downward energy flux, we attribute the enhancement observed in region (d) by JADE to the Ganymede footprint tail. Following this association, we describe the characteristics of auroral fields and particles connected to Ganymede’s footprint tail in Section 3.
3. In-Situ Measurements
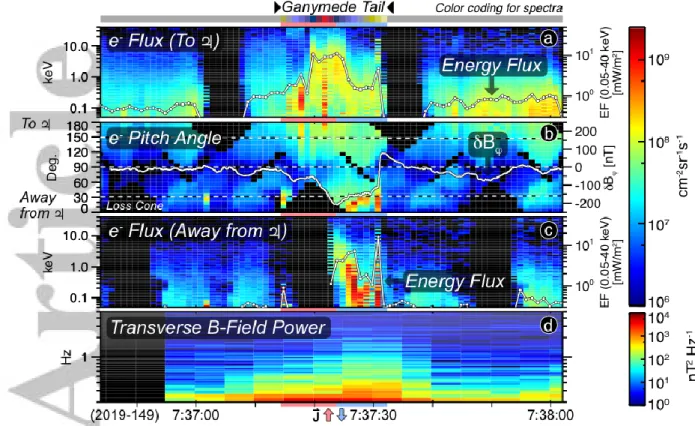
Figure 2 shows in-situ measurements zoomed into region (d) from Figure 1, taken by Juno during 2019-149 from 7:36:44 to 7:38:02 UTC. The Ganymede footprint tail transit is identified as the period with enhanced fluxes in the center of this figure, from 7:37:14 to 7:37:42 and marked with the small color strip running along the top of the figure, where the colors indicate time from 7:37:22 and are used to identify spectra in Figure 3. Figure 2a shows the downward, precipitating electron differential energy flux, taken for measurements in the loss cone of 32˚ during this time (JRM09 model). Overlaid on this panel in white is the downward precipitating energy flux, which peaks at 11 mW/m2 in the enhancement from 7:37:19 to 7:37:24. The downward energy flux is calculated as 𝐸𝐹 = 𝜋 ∑ 𝐷𝐸𝐹𝑖 𝑖 ∙ ∆𝐸𝑖,
summing occurs over the JADE energies (subscript i), where π is the area-projection weighted size of the loss cone above Jupiter’s atmosphere and ∆𝐸𝑖 is the width of each energy bin
following previous analyses [e.g. Mauk et al. 2017a]. We calculate energy flux by summing from 50 eV to 40 keV. Since the fluxes above 40 keV are very near the noise floor, their omission does not substantially affect the analysis in this study. Figure 2c shows the same type of information as the first panel, but for the fluxes moving away from Jupiter in the upward loss cone.
Figure 2b shows DEF electron pitch angles for the same energy range. The JADE sensors provide 240˚ of azimuthal coverage (perpendicular to Juno’s spin axis) and can electrostatically deflect up to 35˚ above/below Juno’s spin plane to track the magnetic field direction. The missing 120˚ of azimuthal coverage leads to gaps in pitch angle, shown as the triangular regions
with no observed fluxes in the second panel. At the onset of the identified Ganymede footprint tail transit (7:37:14), a short-duration electron conic is observed, peaking at around 30˚. There is also a similar feature before the transit at 7:37:00. From 7:37:15 to 7:37:25, strong downward fluxes are observed, peaking in flux within the loss cone at 7:37:17 and 7:37:21. From 7:37:25 to 7:37:27, Juno encounters an upward beam that transitions to an electron conic from 7:37:27 to 7:37:29 with increasing peak pitch angle. The conic diminishes for a single time step (1 s) and an intense upgoing electron flux is observed at 7:37:30 spread more broadly in pitch angle, but also dominantly contained in the upgoing loss cone.
Overlaid on Figure 2b are background-subtracted magnetic field fluctuations in the azimuthal component (Bφ in System III coordinates), smoothed over 0.3 s to remove high-frequency fluctuations. The fluctuations are extracted from Juno magnetic field vector observations after removing the planetary magnetic field by subtracting the JRM09 model [Kotsiaros et al. 2019]. Fluctuations reaching magnitudes up to ~200 nT are readily apparent in the transverse components (perpendicular to the magnetic field direction) and the absence of analogous compressive fluctuations (Supporting Information Figure 1) indicate that the currents are mostly field aligned. The magnetic field structure in δBφ is typical of a northern Alfvén wing crossing with negative δBφ within the main wing and positive δBφ outside of the main wing [e.g. Neubauer 1980; Saur et al. 1999; Saur et al. 2007]. The lack of positive δBφ around 7:37:15 could be due to the detailed geometry of the tail substructures with respect to Juno’s crossing.
The directionality of the currents can be determined by their azimuthal component. Specifically, the sharp decrease in δBφ around 7:37:20 followed by a gradual increase at 7:37:24 and a sharp increase around 7:37:30 suggests Juno crossed a localized upward current (downward electron beam) followed by a downward current (upward electron beam) typical of the northern sub-Jovian Alfvén wing flank [Saur et al. 1999, Jacobsen et al. 2007]. Figure 2d shows the power spectral densities of the transverse magnetic field fluctuations. Following previous analysis techniques [Gershman et al. 2019] by determining the RMS fluctuation power over the given interval and assuming the Alfvén speed is the speed of light in such a strong magnetic field, the total Poynting flux is calculated to be ~100 mW/m2. The Waves instrument onboard Juno [Kurth et al. 2017] also observed enhancements in electric and magnetic field fluctuations coincident with the tail transit time identified here and support these directionalities (Supporting Information Figures 2-4). The power in the magnetic field fluctuations residing in the non-compressional (transverse) component up to 5 Hz, together with the absence of compressive magnetic fluctuations, is consistent with the presence of a non-dispersive Alfvénic mode transmitting field-aligned currents.
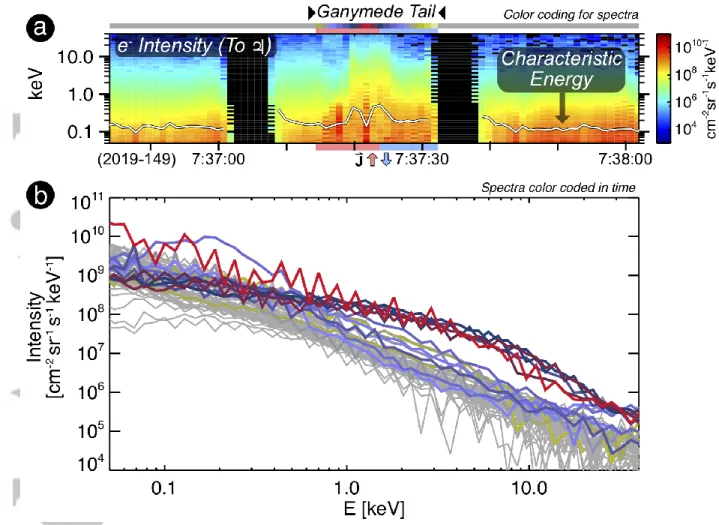
Figure 3a shows the intensity (differential number flux, the DEF divided by proton energy for each energy bin), along with characteristic energy for the precipitating electrons. The characteristic energy is calculated via 𝐸𝑐ℎ𝑎𝑟 = ∑ 𝐼𝑖 𝑖𝐸𝑖∆𝐸𝑖/ ∑ 𝐼𝑖 𝑖∆𝐸𝑖 [e.g. Clark et al. 2018], where I is the intensity and the sum is performed over an energy range from 50 eV to 40 keV. The characteristic energy varies from ~0.1 keV to 0.5 keV in the peak downward flux region, with a dip at ~0.1 keV at the center of the feature. Figure 3b shows intensity spectra for all timesteps in the top panel, color coded by the bar at the top of the figure. During the times around the peak downward energy flux (blue/red), the electron spectra exhibit a broad energization above ~0.5 keV. There is no clear evidence for a peak in the intensity profile indicative of a quasi-static parallel potential structure. The “sawtooth” pattern in some of the spectra is an instrumental effect due to JADE observing rapidly evolving electron fluxes, that
vary on timescales shorter than the 1 s it takes for JADE to sweep every other energy step through all available energies.
4. Discussion and Conclusions
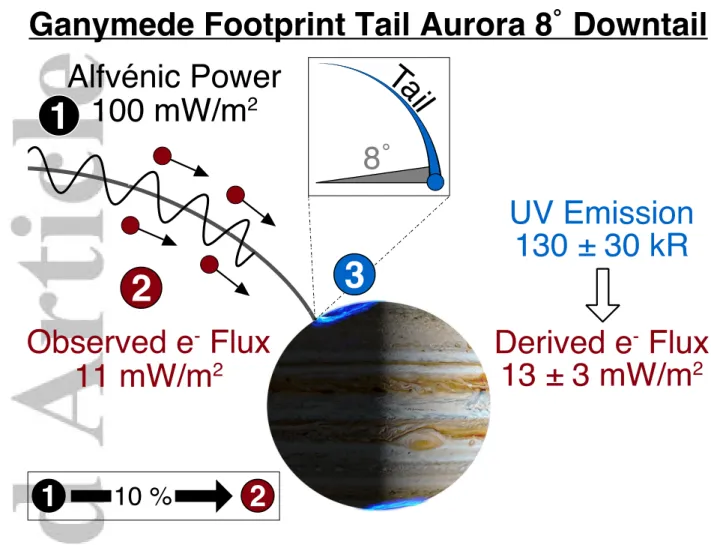
Juno has provided the first in-situ measurements of particles and fields in the Ganymede footprint tail. Magnetic field measurements indicate strong Alfvénic activity, with Poynting fluxes ~100 mW/m2 that provide sufficient energy to power the Ganymede footprint tail aurora. The observed Alfvén waves can accelerate electrons into the Jovian atmosphere, where JADE observed precipitating electron energy fluxes peaking at 11 mW/m2, ~10% of the available Poynting flux energy. The precipitating electrons observed by JADE are sufficient to generate the instantaneously measured auroral emission from the Ganymede footprint tail. UVS observed the main auroral spot (Main Alfvén Wing – MAW) and near-spot auroral tail at this time to have an average H2 photon flux of 130 ± 30 kR in the region associated with the Ganymede footprint (within the circle pointed to with the arrow in Figure 1). This value was calculated by summing the brightness within the 155–162 nm spectral range and then multiplying by a factor of 8.1 to scale it to the entire H2 Lyman and Werner bands UV spectrum [Bonfond et al., 2017c], where the error bar is due to systematic uncertainties in the radiometric calibration [Gérard et al. 2019]. The UV intensities correspond to a precipitating electron energy flux of 13 ± 3 mW/m2 [Grodent et al. 2001; Gustin et al. 2012]. These observed values are also fully consistent with the expected values at ΔλG = 8˚ angular separation from the MAW of 2-63 mW/m2, assuming the fluxes are ~50% of the value at the MAW with an e-folding distance of 11˚ [Bonfond et al. 2017a]. Figure 4 summarizes these findings.
Before and after the Ganymede footprint tail transit, the downward electron intensity spectra were power-law-like as a function of energy, monotonically decreasing with energy resembling a power-law function and without substantial substructure in energy. During the period of largest downward energy flux, the intensities increased by roughly an order of magnitude, with broad enhancements in the range of 0.5 to 40 keV. These downward electron spectra are characteristic of broadband acceleration, similar to those observed throughout Jupiter’s main auroral [Mauk et al. 2017b] and polar region [Ebert et al. 2017] emissions, and do not exhibit peaked features associated with discrete acceleration. While the shape of these spectra is not easily approximated by any of the canonical analytic distributions, to compare with similar previous fits, we fit the spectra to a Kappa distribution [e.q. 3.12 of Livadiotis and McComas, 2013], which yielded Kappa values of 𝜅 = 1.5 − 2.8. A Kappa value of 2.4 was found to best fit the precipitating electron fluxes at Io [Bonfond et al. 2009] and is within the range of values reported in this study for Ganymede, suggesting similar acceleration processes are involved.
At 8˚ separation from the MAW, the emissions map to a distance of ~60 RG downstream in Ganymede’s equatorial plane. During this event, Ganymede is at 280˚ System III longitude, such that it is within the northern portion Jupiter’s plasma sheet and near the peak emission longitude of ~310˚ [Grodent et al. 2009]. The broad structure of the feature is also consistent with Ganymede’s MAW spot size. Mapping the width of the feature discussed here down to an auroral emission altitude of 400 km above the 1-bar level, it spans a distance of 660 km in Jupiter’s atmosphere (Supporting Information Table 1), consistent with high-resolution observations showing the MAW spot to be ~700 km wide [Mura et al. 2018]. The auroral current system is also highly structured, where the sawtooth/checkerboard pattern observed by JADE suggests the electron fluxes are varying on local scales smaller than 50 km (the distance Juno transits locally in JADE’s 1 s sampling period).
During the transit, Juno crossed a current system with separate upward and downward current regions adjacent to each other and exhibiting scale structures. In addition to these small-scale variations, electron beams and conics are observed in the upward current region (Figure 2b). Since there is no corresponding downward beam during this time, and more importantly since this population is in the loss cone, the conic is not a reflected loss-cone distribution and instead indicates heating and/or acceleration below the spacecraft’s altitude of 0.5 RJ.
The up-going electron beam at 7:37:25 indicates parallel acceleration occurs below the spacecraft’s altitude of 0.5 RJ. If this beam and adjacent conic are generated by similar acceleration mechanisms, the conic could also have been driven by parallel acceleration. Low frequency parallel electric field fluctuations, such as those from Alfvén waves, have been found to be able to generate electron conics [André and Eliasson, 1992]. There is a trend of increasing peak pitch angle and decreasing characteristic energy and total energy flux in this conic. If the beam and conic are all formed due to similar parallel electric field fluctuations, this could indicate the acceleration region is getting further from Jupiter (closer to Juno) and decreasing in strength as Juno moves across the downward current region.
We observe a broad distribution of upgoing pitch angles at the edge of the downward current region, which suggests that acceleration occurs at a more dispersed range of altitudes near this boundary. The field-aligned upward electron beams in the loss cone in the downward current region could also generate conjugate auroral emissions in the southern hemisphere. However, if a similar acceleration process is occurring in the southern hemisphere, the lack of a down-going conic in the upward current regions suggests that the downward electron flux may be more locally accelerated, and not due to a conjugate acceleration near the southern ionosphere. The one-way transit time to travel between hemispheres is ~16 min for 50 eV and ~0.5 min for 40 keV electrons and Ganymede has moved less than 1˚ during the transit. If such a conjugate population exists, they could have been pitch-angle scattered during this transit. Ganymede’s auroral tail features are also observed to be patchy and highly structured [Mura et al. 2018], therefore it is possible that the features discussed in this study are a consequence of where Juno has crossed this patchy tail. Additionally, there is no evidence for a bifurcated tail like that intermittently observed for Io [Mura et al. 2018; Szalay et al. 2018].
While this study is focused on the electrons responsible for generating the auroral tail, there is some indication of proton acceleration (Supporting Information Figure 2), similar to that observed during the Io footprint tail transits [Szalay et al. 2019]. Unfortunately, JADE does not have complete ion pitch angle coverage through this observation. Future studies could compare these accelerated protons to those accelerated in the Io footprint tail aurora, particularly on how the source of available protons and the Alfvén reflection scheme through the plasma sheet differs compared to the Io torus. Additionally, comparisons could be made between Io’s and Ganymede’s signatures in the high energy component, where energetic proton depletions [Paranicas et al. 2019] have been observed connected to Io’s footprint tail aurora.
By simultaneously comparing observations of the Alfvén waves responsible for electron acceleration, the precipitating electrons they accelerate, and the auroral emissions those electrons produce, we confirm that Ganymede’s footprint tail is sustained primarily by Alfvénic acceleration processes. Together with the finding that Io’s footprint tail is also sustained primarily by similar processes [Bonfond et al. 2009; Hess et al. 2010; Szalay et al. 2019; Gershman et al. 2019; Damiano et al. 2019], Alfvénic acceleration appears to be a characteristic feature in Jupiter’s moon-magnetosphere interactions and further bolsters the conclusion that broadband acceleration processes are dominant in Jupiter’s aurorae [Mauk et al. 2017b; Saur
et al. 2018]. Saturn’s moon Enceladus also exhibits similar auroral acceleration [Sulaiman et al. 2018], hence, similar processes are operating at multiple outer planets. By extension, Alfvénic acceleration is likely a more universal process applicable to similar interactions at other exoplanet-moon systems [Saur et al. 2013; Bonfond et al. 2017a].
Acknowledgements
The authors would like to thank the many JADE and Juno team members that made these observations possible. We thank V. Hue for producing the footprint prediction calculations. The JNO‐J/SW‐JAD‐3‐CALIBRATED‐V1.0 data set was obtained from the Planetary Data System (PDS) at https://pds.nasa.gov/. We acknowledge the Juno’s NASA contract 699041X. References
Allegrini, F., et al. (2017), Electron beams and loss cones in the auroral regions of Jupiter,
Geophys. Res. Lett., 39(11-12), 1–9, http://doi.org/10.1002/2017GL073180
André, M., & Eliasson, L. (1992). Electron acceleration by low frequency electric field fluctuations - Electron conics. Geophysical Research Letters (ISSN 0094-8276), 19(11), 1073–1076. http://doi.org/10.1029/92GL01022
Bolton, S. J., Lunine, J., Stevenson, D., Connerney, J. E. P., Levin, S., Owen, T. C., et al. (2017). The Juno Mission. Space Science Reviews, 1–33. http://doi.org/10.1007/s11214-017-0429-6
Bonfond, B., Grodent, D., Gérard, J.-C., Radioti, A., Saur, J., & Jacobsen, S. (2008). UV Io footprint leading spot: A key feature for understanding the UV Io footprint multiplicity?
Geophysical Research Letters, 35(5), L05107. http://doi.org/10.1029/2007GL032418
Bonfond, B., Grodent, D., Gérard, J.-C., Radioti, A., Dols, V., Delamere, P. A., & Clarke, J. T. (2009). The Io UV footprint: Location, inter-spot distances and tail vertical extent.
Journal of Geophysical Research, 114(A), A07224.
http://doi.org/10.1029/2009JA014312
Bonfond, B., Hess, S. L. G., Bagenal, F., Gérard, J.-C., Grodent, D., Radioti, A., et al. (2013). The multiple spots of the Ganymede auroral footprint. Geophysical Research Letters,
40(19), 4977–4981. http://doi.org/10.1002/grl.50989
Bonfond, B., Saur, J., Grodent, D., Badman, S. V., Bisikalo, D., Shematovich, V., et al. (2017a). The tails of the satellite auroral footprints at Jupiter. Journal of Geophysical
Research-Space Physics, 122(8), 7985–7996. http://doi.org/10.1002/2017JA024370
Bonfond, B., Grodent, D., Badman, S. V., Saur, J., Gérard, J.-C., & Radioti, A. (2017b). Similarity of the Jovian satellite footprints: Spots multiplicity and dynamics. Icarus, 292, 208–217. http://doi.org/10.1016/j.icarus.2017.01.009
Bonfond, B., Gladstone, G. R., Grodent, D., Greathouse, T. K., Versteeg, M. H., Hue, V., et al. (2017c). Morphology of the UV aurorae Jupiter during Juno's first perijove
observations. Geophysical Research Letters, 44(10), 4463–4471. http://doi.org/10.1002/2017GL073114
Clark, G., Tao, C., Mauk, B. H., Nichols, J., Saur, J., Bunce, E. J., et al. (2018). Precipitating electron energy flux and characteristic energies in Jupiter's main auroral region as
measured by Juno/JEDI. Journal of Geophysical Research: Space Physics, 123, 7554– 7567. https://doi.org/10.1029/2018JA025639
Connerney, J.E.P., Açuna, M.H. & Ness, N.F. (1981). Modeling the Jovian current sheet and inner magnetosphere. J. Geophys. Res., 86, 8370 - 8384.
Connerney, J.E.P., Benn, M., Bjarno, et. al., (2017). The Juno Magnetic Field Investigation,
Space Sci. Rev., http://doi.org/10.1007/s11214-017-0334-z
Connerney, J.E.P., Kotsiaros, S., Oliversen, R.J., et al. (2018). A new model of Jupiter's magnetic field from Juno's first nine orbits. Geophys Res. Lett., 45,
http://doi.org/10.1002/2018GL077312
Damiano, P. A., Delamere, P. A., Stauffer, B., Ng, C.-S., & Johnson, J. R. (2019). Kinetic simulations of electron acceleration by dispersive scale Alfvén waves in Jupiter's magnetosphere. Geophysical Research Letters, 46, 3043–3051.
https://doi.org/10.1029/2018GL081219
Ebert, R. W., Allegrini, F., Bagenal, F., Bolton, S. J., Connerney, J. E. P., Clark, G., et al. (2017). Spatial Distribution and Properties of 0.1-100 keV Electrons in Jupiter's Polar Auroral Region. Geophysical Research Letters, 44(18), 9199–9207.
http://doi.org/10.1002/2017GL075106
Ebert, R. W., Greathouse, T. K., Clark, G., Allegrini, F., Bagenal, F., Bolton, S. J., et al. (2019). Comparing Electron Energetics and UV Brightness in Jupiter's Northern Polar Region During Juno Perijove 5. Geophysical Research Letters, 46(1), 19–27.
http://doi.org/10.1029/2018GL081129
Gérard, J.-C., & Singh, V. (1982). A model of energy deposition of energetic electrons and EUV emission in the Jovian and Saturnian atmospheres and implications. Journal of
Geophysical Research, 87(A6), 4525–4532. http://doi.org/10.1029/JA087iA06p04525
Gérard, J.‐C., Bonfond, B., Mauk, B., Gladstone, G. R., Yao, Z. H., Greathouse, T. K., et al (2019). Contemporaneous observations of Jovian energetic auroral electrons and ultraviolet emissions by the Juno spacecraft. Journal of Geophysical Research: Space
Physics, 124. https://doi.org/10.1029/2019JA026862
Gershman, D. J., Connerney, J. E. P., Kotsiaros, S., DiBraccio, G. A., Martos, Y. M., F.‐ Viñas, A., et al (2019). Alfvénic fluctuations associated with Jupiter's auroral
emissions. Geophysical Research Letters, 46. https://doi.org/10.1029/2019GL082951 Gladstone, G. R., Persyn, S. C., Eterno, J. S., Walther, B. C., Slater, D. C., Davis, M. W., et
al. (2017). The ultraviolet spectrograph on NASA’s Juno mission. Space Science
Reviews, 213(1-4), 447–473. https://doi.org/10.1007/s11214-014-0040-z
Grodent, D., Waite, J. H. J., & Gérard, J.-C. (2001). A self-consistent model of the Jovian auroral thermal structure. Journal of Geophysical Research, 106(A), 12933–12952. http://doi.org/10.1029/2000JA900129
Grodent, D., Bonfond, B., Gérard, J.-C., Radioti, A., Gustin, J., Clarke, J. T., et al. (2008). Auroral evidence of a localized magnetic anomaly in Jupiter's northern hemisphere.
Journal of Geophysical Research-Space Physics, 113(A), A09201.
http://doi.org/10.1029/2008JA013185
Grodent, D., Bonfond, B., Radioti, A., Gérard, J.-C., Jia, X., Nichols, J. D., & Clarke, J. T. (2009). Auroral footprint of Ganymede. Journal of Geophysical Research, 114(A), A07212. http://doi.org/10.1029/2009JA014289
Grodent, D. (2015). A brief review of ultraviolet auroral emissions on giant planets. Space
Science Reviews, 187(1), 23–50. https://doi.org/10.1007/s11214-014-0052-8
Gustin, J., B. Bonfond, D. Grodent, and J. C. Gérard (2012), Conversion from HST ACS and STIS auroral counts into brightness, precipitated power and radiated power for H2 giant planets J, J. Geophys. Res., 117, A07316, http://doi.org/10.1029/2012JA017607
Jia, X., Walker, R. J., Kivelson, M. G., Khurana, K. K., & Linker, J. A. (2008). Three-dimensional MHD simulations of Ganymede’s magnetosphere. Journal of Geophysical
Research, 113(A6), http://doi.org/10.1029/2007JA012748
Klumpar, D. M. (1979). Transversely accelerated ions - An ionospheric source of hot magnetospheric ions. Journal of Geophysical Research, 84(A8), 4229–4237. http://doi.org/10.1029/JA084iA08p04229
Kolmašová, I., Imai, M., Santolík, O., Kurth, W. S., Hospodarsky, G. B., Gurnett, D. A., et al. (2018). Discovery of rapid whistlers close to Jupiter implying lightning rates similar to those on Earth. Nature Astronomy, 2(7), 544–548. http://doi.org/10.1038/s41550-018-0442-z
Kotsiaros, S., Connerney, J. E. P., Clark, G., Allegrini, F., Gladstone, G. R., Kurth, W. S., et al. (2019). Birkeland currents in Jupiter's magnetosphere observed by the polar-orbiting Juno spacecraft. Nature Astronomy, 3(10), 904–909. http://doi.org/10.1038/s41550-019-0819-7
Kurth, W. S., et al. (2017). The Juno Waves investigation, Space Sci. Rev., http://doi.org/10.1007/s11214-017-0396-y
Livadiotis, G., & McComas, D. J. (2013). Understanding Kappa Distributions: A Toolbox for Space Science and Astrophysics. Space Science Reviews, 175(1-4), 183–214.
http://doi.org/10.1007/s11214-013-9982-9
Louarn, P., Allegrini, F., McComas, D. J., Valek, P. W., Kurth, W. S., André, N., et al. (2018). Observation of Electron Conics by Juno: Implications for Radio Generation and Acceleration Processes. Geophysical Research Letters, 45(18), 9408–9416.
http://doi.org/10.1029/2018GL078973
Lundlin, R., Eliasson, L., Hultqvist, B., & Stasiewicz, K. (1987). Plasma energization on auroral field lines as observed by the Viking spacecraft. Geophysical Research Letters
Mauk, B. H., Haggerty, D. K., Paranicas, C., Clark, G., Kollmann, P., Rymer, A. M. et al. (2017a). Juno observations of energetic charged particles over Jupiter’s polar regions: Analysis of monodirectional and bidirectional electron beams. Geophys. Res. Lett., 44, http://doi.org/10.1002/2016GL072286
Mauk, B., et al. (2017b), Discrete and broadband electron acceleration in Jupiter’s powerful aurora. Nature, 549(7670), 66–69, http://doi.org/10.1038/nature23648
McComas, D. J., et al. (2017), The Jovian auroral distributions experiment (JADE) on the Juno mission to Jupiter, Space Sci. Rev., Online first, http://doi.org/10.1007/s11214-013-9990-9
Menietti, J. D., & Burch, J. L. (1985). “Electron conic” signatures observed in the nightside auroral zone and over the polar cap. Journal of Geophysical Research (ISSN 0148-0227),
90(A6), 5345–5353. http://doi.org/10.1029/JA090iA06p05345
Mura, A., Adriani, A., Connerney, J. E. P., Bolton, S., Altieri, F., Bagenal, F., et al. (2018). Juno observations of spot structures and a split tail in Io-induced aurorae on Jupiter.
Science, 361(6), 774–777. http://doi.org/10.1126/science.aat1450
Paranicas, C., Mauk, B. H., Haggerty, D. K., Clark, G., Kollmann, P., Rymer, A. M., et al. (2019). Io's Effect on Energetic Charged Particles as Seen in Juno Data. Geophysical
Research Letters, 86, 8343–6. http://doi.org/10.1029/2019GL085393
Paty, C., W. Paterson, and R. Winglee (2008), Ion energization in Ganymede’s
magnetosphere: Using multifluid simulations to interpret ion energy spectrograms, J.
Geophys. Res., 113, A06211, http://doi.org/10.1029/2007JA012848
Saur, J., Neubauer, F. M., Strobel, D. F., & Summers, M. E. (1999). Three‐dimensional plasma simulation of Io's interaction with the Io plasma torus: Asymmetric plasma flow. Journal of Geophysical Research: Space Physics, 104(A11), 25105-25126. Saur, J., Neubauer, F. M., & Schilling, N. (2007). Hemisphere coupling in Enceladus'
asymmetric plasma interaction. Journal of Geophysical Research-Space Physics, 112(A), A11209. http://doi.org/10.1029/2007JA012479
Saur, J., Grambusch, T., Duling, S., Neubauer, F. M., & Simon, S. (2013). Magnetic energy fluxes in sub-Alfvénic planet star and moon planet interactions. Astronomy and
Astrophysics, 552, A119. http://doi.org/10.1051/0004-6361/201118179
Saur, J., Janser, S., Schreiner, A., Clark, G., Mauk, B. H., Kollmann P., et al. (2018). Wave-particle interaction of Alfvén waves in Jupiter’s magnetosphere: Auroral and
magnetospheric particle acceleration. Journal of Geophysical Research: Space Physics,
123. https://doi.org/10.1029/2018JA025948
Sulaiman, A. H., Kurth, W. S., Hospodarsky, G. B., Averkamp, T. F., Ye, S. Y., Menietti, J. D., et al. (2018). Enceladus Auroral Hiss Emissions During Cassini's Grand Finale.
Szalay, J. R. et al. (2017), Plasma measurements in the Jovian polar region with Juno/JADE,
Geophys. Res. Lett., 86(A8), 8447–9, http://doi.org/10.1002/2017GL072837
Szalay, J. R., Bonfond, B., Allegrini, F., Bagenal, F., Bolton, S., Clark, G., et al. (2018). In situ observations connected to the Io footprint tail aurora. Journal of Geophysical
Research: Planets, 123, 3061– 3077. https://doi.org/10.1029/2018JE005752
Szalay, J. R., Bagenal, F., Allegrini, F., Bonfond, B., Clark, G., Connerney, J. E. P., et al (2019). Proton Acceleration by Io's Alfvénic Interaction. Journal of Geophysical
Research: Space Physics, 124. https://doi.org/10.1029/2019JA027314
Temerin, M. A., & Cravens, D. (1990). Production of electron conics by stochastic
acceleration parallel to the magnetic field. Journal of Geophysical Research (ISSN
0148-0227), 95(A4), 4285–4290. http://doi.org/10.1029/JA095iA04p04285
Thompson, B. J., & Lysak, R. L. (1996). Electron acceleration by inertial Alfvén waves.
Journal of Geophysical Research, 101(A), 5359–5370. http://doi.org/10.1029/95JA03622
Wannawichian, S., Clarke, J. T., & Nichols, J. D. (2010). Ten years of Hubble Space Telescope observations of the variation of the Jovian satellites' auroral footprint brightness. Journal of Geophysical Research, 115(A2),
Figure 1. (Top) UV false color of the auroral emissions near Juno’s mapped magnetic footprint. Grey areas mark regions UVS either did not observe or registered no photons while
viewing. Qualitatively, red features correspond to emissions deep in the atmosphere due to higher energy precipitating electrons, while pink/white features correspond to higher altitude
emissions due to lower energy incident electrons. (Bottom) The color spectrogram shows JADE downward precipitating differential energy flux (DEF). The overlaid line shows energy
Figure 2. JADE and MAG data during the Ganymede footprint tail transit. (a) and (c) show the downward and upward electron differential energy flux (DEF) within the loss cone respectively. Precipitating energy flux is overlaid on these panels with its separate axes on the
right of the spectrograms. (b) shows electron pitch angles with δBφ overlaid. (d) shows the transverse B-field power spectral densities. Red/blue bars indicate approximate up/downward
Figure 3. (a) Precipitating electron intensity spectrogram, with the characteristic energy from 0.05-40 keV overlaid. (b) Intensity for individual spectra, color-coded by the bar at the top of
Figure 4. Summary schematic of the auroral processes involved in sustaining Ganymede’s footprint tail aurora 8˚ downtail. Juno observations are consistent with a 10% efficiency