About the photoionization of Methyl Chloride.
A threshold photoelectron spectroscopic and photoionization mass
spectrometric investigation
R. Locht a, B. Leyh a ,A. Hoxha a, D. Dehareng b, K. Hottmann c, H.W. Jochims c, H. Baumgärtel c
a
Département de Chimie Générale et de Chimie Physique, Institut de Chimie, Bât. B6c, Université de Liège, Sart-Tilman par B-4000 Liège 1, Belgium
b
Centre d'Ingéniérie des Protéines, Institut de Chimie, Bât. B6a, Université de Liège, Sart-Tilman par B-4000 Liège 1, Belgium
c
Institut für Chemie, Physikalische und Theoretische Chemie, Freie Universität Berlin, Takustraβe 3, D-14195 Berlin, Germany
Abstract
The threshold photoelectron spectroscopic (TPES) and the photoionization mass spectrometric (PIMS) study of methyl chloride (CH3Cl) in the 8-20 eV photon energy range is presented. The interpretation and
assignments are supported by ab initio calculations. The detailed analysis of the TPES shows numerous features in the Jahn-Teller split ground X~2E (2A'-2A") state of CH3Cl
+
and a new continuous band peaking at 13.4 eV. These were assigned to both direct ionization and autoionizing transitions. The transitions to the à 2A and to the
B~2E states undergo a large enhancement ascribed to important autoionizing contributions. Based on the present calculations, the weak to very weak signals in the 19-26 eV photon energy range were mainly assigned to 2a1-1
ionization and to double excitations described essentially by the 2e-2, 4a11 and le-12e-14a11 configurations. The
PIMS study allowed us to investigate in detail the ionization and dissociation of CH3Cl + into CH2 + , CH3 + , CHCl+ and CH2Cl +
from threshold up to 20 eV photon energy. At the onset, the CH3 +
, CHCl+ and CH2Cl +
fragment ion production is correlated to the ground state of CH3Cl+ and all fragment ions have to appear through dissociative
autoionization from the 2e → 3p Rydberg state. This interpretation is supported by the photoabsorption spectrum (PAS) measured recently in the same photon energy range. At higher energies, beside direct dissociation of the Ã
2
A1 and B
~2
E states of CH3Cl +
autoionization also contributes to the fragmentation in all decay channels. For CH3
+
the photoion-pair process is analyzed and detailed assignments are proposed on the basis of recent PAS data.
1. INTRODUCTION
Recently, we investigated in detail the vacuum UV photoabsorption spectrum (PAS) of methyl chloride (CH3Cl) and its perdeuterated isotopomer (CD3Cl) [1,2]. This study was extended from 6 to 25 eV photon
energy.
To the best of our knowledge, the only photo-ionization mass spectrometric (PIMS) work on CH3Cl
was published in 1968 by Krauss et al. [3]. They investigated the molecular ion and the formation of the CH3 +
ion by both the ion-pair process leading to CH3+ + Cl- and the conventional photodissociation process leading to
CH3+ + Cl. This work was extended to the study of the same processes in CD3Cl. Particular attention was paid to
the ion-pair process CH3 +
+ Cl- by analyzing the ionization efficiency of both the CH3 +
and Cl-ions.
This latter process has been investigated more recently by Suzuki et al. [4] and a more detailed analysis of the fine structure observed in the Cl- ion yield curve was presented. The dissociative ionization process, i.e.
CH3+ + Cl, was not considered in this work.
The fragmentation pathways leading to the other fragment ions, e.g. CH2 +
, CHCl+ and/or CH2Cl +
been investigated neither by Krauss et al. [3] nor by Suzuki et al. [4]. Only electron impact studies reported energetic data about the formation of these fragment ions [5-7]. The most recent simulated dissociative photoionization work has been reported by Olney et al. [8] using dipole (e,e) electron scattering. This group measured the absolute differential oscillator strength and the branching ratios for dissociative photoionization of CH3Cl through all its possible ionized fragmentation pathways from their onset up to 80 eV equivalent photon
energy. Threshold energies have been measured for all these species.
Therefore, it seemed of interest to extend our photoabsorption study to the photoionization of this molecule and to examine more deeply several aspects of the photofragmentation of the CH3Cl+ molecular ion.
The aim of the present work is to report on the threshold photoelectron spectrum (TPES) and the dissociative photoionization of CH3Cl into its fragments CH2
+
, CH3 +
, CHCl+ and CH2Cl +
as observed between their onset up to about 20 eV photon energy. To shed light on the present measurements, previous results reported recently on the vacuum UV PAS of CH3Cl [1,2] will currently be used.
2. EXPERIMENTAL
Two distinct experimental setups have been used in this work. They were described elsewhere [9,10] and only the most salient features will be reported here. In all the experiments reported in this work we used the vacuum UV light from the synchrotron radiation provided by the electron storage ring BESSY I (Berlin). 2.1. The threshold photoelectron spectroscopy
For these experiments the light is dispersed by a 3 m normal incidence monochromator (on the 3 m-NIM-1 beamline) equipped with a 2400 lines mm-1 Pt grating. The entrance and exit slit widths were set at 100 µm. Owing to the second order contribution at low photon energy, a LiF window is used when necessary, restricting the observations to an upper photon energy range of 11.8 eV. The photon energy scale is calibrated with rare gas photoabsorption and/or TPES to reach an accuracy better than 2-3 meV. In the present case, Xe has been used for this purpose and the value of the ionization energy IE(Xe+-2P3/2) = 12.130 eV [11] has been
adopted.
The light beam is focused into an ion chamber, in the focusing plane of a tandem electron spectrometer consisting of two 180° electrostatic deflectors. This spectrometer works at constant resolution, i.e. at constant pass energy E0. Its energy resolution, as measured by the full width at half maximum (FWHM) of a rare gas
peak, is given by ∆E/E0 = w/4R0 = w/104 where w and R0 are the slit widths (in mm) and the radius (in mm) of
the sector field. In the present case, slits of 1.0 mm and a pass energy E0=1.1V yield a resolution of about 10
meV. The spectra are normalized to the photon transmission function of the monochromator by measuring the light beam intensity through the photoelectron current of a gold diode inserted in the ion chamber in front of the monochromator exit slit.
2.2. The photoionization mass spectrometry
For these experiments the synchrotron radiation is dispersed by an 1.5 m normal incidence monochromator (1 m-NIM-2 beamline) which is a modified M-225 McPherson monochromator equipped with a laminar gold-coated Zeiss grating of 1200 lines mm-1. Entrance and exit slit widths of 100 µm provided 0.1 nm wavelength resolution. Wavelength calibration is performed by recording the Ar+(2P3/2
-2
P1/2) ion yield curve and
using the Ar+ ionization energy IE(Ar+-2P3/2) = 15.759 eV [11]. The light beam focused at the center of an ion
chamber is detected by a sodium salicylate sensitized photomultiplier fixed in front of the monochromator exit slit. The ions produced in the ion chamber are mass analyzed by a quadrupole mass spectrometer, detected by a channeltron multiplier and recorded by a 100 MHz counter. The ion signal is automatically normalized to the photon flux at all wavelengths.
2.3. Error estimations and data handling
The error estimations on the results presented in this work are the sum of (i) the calibration errors, (ii) the photon energy increments adopted for the signal recording and (iii) the standard deviation obtained from several experiments. The calibration error of 2-3 meV is about the same in all kinds of experiments presented in this report. The energy increments vary from 4 meV (in narrow energy range scans) to 20 meV for broad energy range TPES. In the former case the total error should be about 5 meV whereas in the latter a total error of about
15 meV is a good estimate. The photoionization efficiency curves were all recorded with photon energy increments of 8 meV and the error is estimated at 10 meV. In the PAS covering the 6-24 eV range [1] an error of 15 meV has also been adopted. The PAS as presented in this work is in fact the result of a subtraction procedure used to enhance the low intensity structures superimposed on a strong background signal. This procedure has already been described previously [12].
2.4. Ab initio calculations
All calculations described in this work were performed with GAUSSIAN94[13] using two computers, i.e. a DEC 8400 with eight processors and a DEC 4100 with four processors.
For clarity in this section and in the discussion of the experimental results (Section 4), the molecular configuration of CH3Cl in the C3v point group should be reminded, i.e.
Cl(1s2)C(1s2)Cl(2s22p6)( 1a1)2(2a1)2(1e)4(3a1)2(2e)4 :X1A1
where the first atomic-like orbitals correspond to inner-shell orbitals which are localized on the Cl and C atoms and have 1s, 2s and 2p character. The 1a1 and 2a1 correspond to the inner-valence shell molecular orbitals (MOs)
whereas the 1e, 3a1 and 2e MOs have outer-valence character.
The first excited doublet states were calculated within a multiconfigurational self-consistent field (SCF) method labeled CASSCF (complete active space SCF) [14-16]. The neutral geometry (C3v), optimized at the
CASSCF (6,7) level within the 6-31++G** basis set [17-19] was adopted for the cation, since one refers to vertical excitations. For information, the Gaussian exponents of the diffuse s(H) and s,p(C, Cl) functions are equal to —0.036, -0.0438 and -0.0483 for H, C and Cl respectively. Two active spaces were chosen as defined by the electron and MO numbers involved in the generation of the electronic configurations, i.e. CASS-CF(9,8) (2352 configurations) and CASSCF(11,7) (112 configurations). As an example one calculates at the CASSCF(9,8)/6-31++G** level took 54 h of CPU time. In the first case, the three highest RHF occupied MOs (1e, 3a1 and 2e) and the two lowest unoccupied MOs (4a1 and 3e) represent the active set. In the second case, the
occupied set is extended to (2a1, le, 3a1 and 2e) but the unoccupied set is reduced to only the first 4a1 MO. The
reason is that the larger CASSCF(11,9) calculation becomes intractable (6048 configurations). At the CAS-SCF(9,8) level 14 states were determined while at the CASSCF(11,7) level, 20 states were calculated with a state-averaging procedure in both cases.
Calculations at the MP2/6-31G** level have been performed to provide dissociation energies in different decay channels with respect to the CH3Cl
+
ionic ground state. First excited states of CH2Cl +
, CHCl+ and CH2
+
have also been calculated.
The choice of the CASSCF level was conditioned by the fact that it provides excitation energies at a reasonable cost. However, this method does not take into account the dynamical electronic correlation contribution. This is important when dealing with dissociation energies. Consequently, for this latter study the MP2 method was preferred because of its ability to take into account part of the dynamical correlation and to be size consistent.
3. RESULTS
3.1. The threshold photoelectron spectrum
The TPES recorded for CH3Cl, with a 20 meV energy increment, is represented in Fig. 1a in the photon
energy range of 10-23 eV. Measurements extending up to 30 eV have also been performed. However, the optical transmission of the grating used slowly drops from 23 eV and becomes nearly zero at 30 eV. Therefore, the normalization procedure of the electron current to the light beam intensity introduces a decreasing signal/noise ratio in the photoelectron yield.
Vertical ionization energies are measured successively at 11.32 ± 0.01, 13.40 ± 0.01, 14.54 ± 0.01, 15.24 ± 0.01, 16.10 ± 0.05, 20.10 ± 0.02 and 21.60 ± 0.01 eV. A fairly intense feature peaking at 10.8 eV is ascribed to the second spectral-order contribution and should correspond to the band observed at 21.6 eV in the first spectral order. The differential PAS (see Section 2.3) [1] in the same energy range is also displayed in Fig. lb as a support in our discussion. As already mentioned [1] maxima are observed at 12.1, 13.1, 14.2 eV and at
19.0 eV. A broad structure spreads from 15.7 to 17.6 eV.
Fig. 2a shows a detailed recording, with 4 meV photon energy increments, over the 11-14 eV photon energy range. A window of the PAS of CH3Cl [1] has been superimposed to show the correlation between both
spectra in the vicinity of the structure at 13.4 eV. Already on this scale the presence of more fine structure at low energy, i.e. between 11.2 and 12.0 eV, can be observed. Fig. 2b shows the TPES spectrum in this energy range, together with the differential PAS [1] observed in the same energy window. The energy position of these structures are listed in Table 1. Fig. 2c displays the TPES spectrum in the 18-23 eV photon energy range. Essentially two bands are observed peaking at 20.1 and 21.6 eV successively. While the first band looks as a continuum, its shape could suggest that it will result from three components with maxima near 19.5, 20.1 and 20.6 eV. In the second band a fine structure could be observed and is marked by vertical bars in Fig. 2c. The measured positions in energy are listed in Table 2.
Fig. 1. (a) The TPES of CH3Cl over the 10-23 eV photon energy range. Vertical bars locate vertical IEs. (b) The
differential PAS of CH3Cl as observed in the 11-24 eV photon energy range. For explanation: see text and Ref.
[1].
3.2. The mass spectrometric photoionization results At 20 eV photon energy only CH3Cl
+ , CH2Cl + , CHCl+, CH3 + and CH2 +
ions are observed in the mass spectrum. The CH3
+
ion is the most abundant species at this energy. Apart from CH3Cl +
and CH3 +
, results related to the other ions are reported for the first time.
3.2.1. The CH3Cl+ molecular ion
The photoionization efficiency curve of the CH3C1 +
molecular ion, as recorded between 10 and 20 eV photon energy, is displayed in Fig. 3a. Vertical bars locate the maxima of fairly diffuse peaks in the photoion yield curve at 11.9, 13.3, 16.5 eV and at about 19.0 eV. In the same figure the PAS of CH3Cl, treated by the
procedure referred to in Section 2.3, is superimposed. Clearly maxima are measured at 12.1, 13.1, 14.2, 19.0 eV and a broad structure is centered on 16.5 eV photon energy [1].
Fig. 2. (a) The TPES and the PAS of CH3Cl as observed between 11 and 14 eV photon energy, (b) Details of the
first TPES band and the PAS between 11.2 and 11.7 eV photon energy, (c) Details of the weak TPES bands at 20.1 and 21.6 eV photon energy. Vertical bars indicate critical energies discussed in the text.
Table 1-Position in energy (eV) of fine structures in the PAS [1], TPES, PIMS, PIPP and PES measurements
PAS TPES PIMS PIPP PES Assignments [2]
Réf. [2] This work This work This work [20] This work
11.290 11.296 11.28 11.289 X~2E3/2: 0-0 [11.308] [11.308] 11.310 11.320 11.316 11.31 11.316 X~2E1/2: 0-0 [11.329] [11.328] 11.343 [11.334] 11.340 11.371 11.372 11.36 11.370 11.368 v6 (E3/2) 11.395 [11.400] 11.395 11.399 v5 (E3/2) 11.412 11.41 11.420 11.422 2v6 (E3/2)/v5 (E1/2) [11.430] 11.428 11.444 11.440 11.488 11.48 11.480 11.482 v (E1/2) 11.500 [11.50] 11.506 v5 + v6 (E1/2) 11.512 11.510 11.531 11.53 11.530 11.538 2v5 (E1/2) [11.548] 11.545 v + v5 (E3/2) 11.568 11.57 11.560 11.558 2v5 + v6 (E3/2) 11.584 11.586 3v5 (E3/2)/v5 + 2v6 (E1/2) 11.596 11.600 11.616 11.636 11.64 11.635 v + 2v5/2v (E3/2) 11.652 11.650 11.664 11.670 v + 2v5 (E1/2) 11.680 11.681 2v + v6 (E3/2) 11.688 11.69 11.704 11.710 11.713 2v + v6 (E1/2)
The energies in square brackets correspond to shoulders or less well-defined structures. For the precision on each type of measurement, see text.
Table 2- Energy positions (eV) characterizing the structures observed in the TPES peak at 21.6 eV photon energy (comparison is made with the photoabsorption data reported by Wu et al. [21])
This work Photoabsorption [21]
TPES ∆ cm-1 eVa ∆
Assignments This work
163 670 20.292 n* = 4.053 5s/4d 166200 20.606 0.314 n* = 4.248 5s 168 460 20.886 0.280 n* = 4.365 5s 21.12 170 650 21.158 0.271 n* = 4.533 5s/5p 21.36 0.240 21.60 0.240 21.82 0.220 21.98 0.160 22.14 0.160 a
The most recent recommended value of the conversion factor 1 eV = 8065.54 cm-1
[22] has been used.
The most important difference with the only previously reported photoionization efficiency curve of CH3C1+ [3] is the intensity ratio between the onset region of 11-12.5 eV and the high energy range of 12.5-19
eV. A rough estimate would give a ratio of 1:1 in the former work [3] whereas this ratio would be close to 2:1 in the present experiment.
Fig. 3b represents the photoionization efficiency curve of CH3C1 +
in the threshold region. Several step-like features are clearly visible. To determine the thresholds, the first differentiation of the photoion yield has been calculated numerically. The result is shown in Fig. 3b and the peak positions are listed in Table 1. A good estimate of the noise on the first differentiation is represented by the fluctuations on the base-line observed between 10.8 and 11.2 eV photon energy.
Fig. 3. (a) The direct photoion yield curve of CH3Cl+ over the 10-20 eV photon energy range. Vertical bars
indicate critical energies discussed in the text. The differential PAS in the same energy range is also displayed, (b) The direct and numerical first differentiated ionization efficiency curve of CH3C1
+
near threshold.
3.2.2. The CH2Cl+ fragment ion
The photoion yield curve of the CH2Cl +
fragment ion produced by the dissociative photoionization of CH3Cl between 10 and 20 eV photon energy is reproduced in Fig. 4a. For the CH2Cl
+
ion the appearance energy (AE) is measured at AE = 12.84 ± 0.015 eV by the linear exptrapolation method applied to the first differentiated ionization efficiency curve as described extensively and used earlier [23,24]. The ionization efficiency curve clearly exhibits a maximum at about 14.2 eV and a more diffuse structure peaking around 17.3 eV. A closer examination of the yield curve in the threshold region would suggest a change of the slope in the rise of the ion yield at about 13.20 ± 0.05 eV.
3.2.3. The CHCl+ fragment ion
Fig. 4b represents the photoion yield curve of the CHCl+ fragment ion produced by the dissociative photoionization of CH3Cl as measured between 10 and 20 eV photon energy. The lowest threshold measured by
the extrapolation method applied to the first derivative is at AE = 13.27 ± 0.02 eV. The ion yield steeply rises up to about 14.7 eV where it reaches a first maximum. The first differential yield curve shows a maximum at 14.0 eV. After a decrease up to 16 eV photon energy the ion yield reaches a constant value from about 17 eV.
Fig. 4. Photofragment ion yield curves (PIC) of (a) CH2Cl+, (b) CHCl+ and CH2+ as measured between 10 and
20 eV photon energy. For the three cases the differential PAS curve is displayed in the corresponding photon energy range. Vertical bars indicate critical energies discussed in the text.
3.2.4. The CH3 +
fragment ion
The ion yield curve of the CH3 +
energy range. Superimposed to this curve, the PAS of CH3Cl as well as a slightly smoothed first derivative of the
ionization efficiency curve are also shown. From the latter curve the AE of CH3 +
is estimated at AE = 13.33 ± 0.05 eV. This low precision has to be ascribed to the estimated uncertainty on the onset owing to the curvature in the threshold region. This curvature is probably mainly due to the CH3+ ion kinetic energy distribution close at
threshold.
As shown in Fig. 5a, beside this critical energy several maxima are observed in the first differentiated ion yield curve, i.e. at 14.4, 15.2 and around 18.2 eV.
Below 13 eV the photoionization efficiency curve of CH3 +
exhibits a low intensity contribution between 9.5 and 12 eV. An ion yield curve measured between 9.8 and 11.7 eV using a LiF filter is reproduced in Fig. 5b. The energy positions of the features observed in this curve below 11.3 eV are listed in Table 3. The first structure emerging from the background noise lies at AE = 9.99 ± 0.01 eV. Though lying below this AE and being at the noise level, structures are also listed in this table at energies mentioned in square brackets.
3.2.5. The CH2+ fragment ion
Though the signal at m/e =14 only represents about 1% of the intensity of the peak corresponding to CH3
+
a photoion yield curve measurement has been attempted. The result is shown in Fig. 4c as observed between 13 and 18 eV photon energy. In spite of the bad signal/noise ratio, clearly two distinct onsets are observed 1.0 eV apart, i.e. at 14.00 ± 0.05 and at 15.00 ± 0.05 eV. Up from about 16.6 eV photon energy the photo-ion yield curve reaches a constant value.
The results of the onset measurements and energy position of other features in the photodissociative ionization yield curves of CH2
+
, CH3 +
, CHCl+ and CH2Cl +
ions are summarized in Table 4. 3.3. The ab initio calculations
The results of the ab initio calculations as obtained at both the CASSCF(9,8) and CASSCF(11,7) levels are summarized in Table 5. IE represents the ionization energies provided by adding the calculated excitation energies ∆Eexe to the first IE of 11.11 eV obtained at the MP2/6-31G** level. For clarity, the main configurations
and their configuration interaction (CI) coefficients are indicated in columns 4 and 8. It has to be kept in mind that, according to the MO energies of the neutral at its MP2/6-31G** geometry, the Koop-mans' theorem [25] predicts the following IE: 11.87 eV (2E), 14.97 eV (2A1), 16.58 eV (2E) and 25.00 eV (2A1). The states
corresponding mainly to the ionization of the highest RHF MOs are the 12E at 11.11 eV, 12A1 at about 14.5 eV,
22E at about 16.2 eV and the 6 2A1 at about 24.0 eV. These energies are close to those predicted by Koopman's
theorem. All other states lying in between, i.e. from 16.3 to 24.0 eV energy range, are doubly excited states mainly derived from 2e-1 and 3a1-1 ionic configurations.
The ab initio results obtained in this work have to be compared with those obtained by Von Ni-essen et al. [26], using Green functions (GF) and coupled electron pair approximation (CEPA) calculations. Kimura et al. [27] calculated the IEs using SCF-MO and CI methods at the 4-31G level but restricted their investigations to the outer-valence shell ionizations. All these calculations concern either direct IEs or electronic states related to a specific ionization without any electronic excitation.
The present MP2/6-31G** level calculations predict a CH3Cl +
(X~2A') → CH2Cl +
(X~1A1) + H(² S) dissociation
energy of 1.498 eV taking into account the zero point energy (ZPE). The same calculations applied to the decay CH3Cl+ into CHC1+(X~2A')+ H2(X1Σg+) provided a dissociation energy of 2.03 eV incorporating the ZPE.
Furthermore, a quartet state is calculated at 3.76 eV above the 2A' ground state of CHCl+. For the decay of CH3Cl
+
into CH2 +
(X~2A1) + HCl(X 1
Σ+) the dissociation energy is 2.855 eV taking into account the ZPE. The first excited CH2
+
( Ã 2B1) state lies at 0.922 eV (vertical excitation) and the bent-to-linear geometry
change has a barrier estimated at 0.163 eV.
The most important dissociation channel, i.e. CH3C1+(X~2A') → CH3+(X~1A'1) + Cl(2Pu,3/2) has also been
considered. A dissociation energy of 1.878 eV (including the ZPE) has been calculated.
For these fragmentations, the geometrical parameters calculated at the optimized geometries of the ionic fragments CH2C1 + , CHC1+, CH2 + and CH3 +
Fig. 5. Photoionization efficiency (PIC) curve of CH3+. (a) The high energy part is displayed together with the
slightly smoothed first differentiated (1st deriv.) ionization efficiency curve and the differential PAS of CH3C1 in
the same energy range. Vertical lines locate critical energies discussed in the text. The dashed line indicates an earlier onset energy measurement [3]. (b) The low energy part corresponds to the PIPP. The dashed line locates the onset determined in the present work.
4. DISCUSSION
For clarity in the following discussion the experimental results will be discussed in the same order as their presentation in Section 3.
4.1. The threshold photoelectron spectrum
well-resolved He(I) PES has been reported by Karlsson et al. [20]. They measured adiabatic IEs at 11.289 ±0.003 eV and at 13.8 eV. These were assigned to 2e-1 and 3a1
-1
ionization respectively. The lowest ionic state shows a
2
E3/2 -2
E1/2 spin-orbit splitting of 26±6 meV (21±48 cm -1
) with adiabatic IEs at 11.289 ± 0.003 and 11.316 ± 0.003 eV. From Table 1, the energies obtained in the present work from the TPES spectrum are 11.296±0.010 eV Table 3-Position in energy (eV) of the structures observed in the PAS of CH3Cl and in the PIPP CH3+ + Cl
-efficiency curve (for the precision on each type of measurement, see text) PAS Ref. [2] PIPP This work Assignment(s) Ref. [2] PIPP Ref. [4] 9.816 [9.81] 2e→3d 9.892 [9.90] 3d(ν6) and 2e→3d' 9.934 [9.94] 3d(v5) 9.964 [9.97] 3d'(v6) 10.002 9.99 ± 0.01 3d'(v5) 10.040 10.050 3d(v + v6) a 10.054 3d'(v)a 10.088 3d(v + v5)a 10.102 10.095 2e → 4pa1 10.105 [5pe] 10.119 3d(v + 2v6) a /3d'(v + v6) a 10.125 [5pe'/4d] 10.158 10.160 3d'(v + v5) a 10.182 4pa1(v6) 10.193 10.200 2e → 4pa'1 or 10.198 2e → 4pe 10.230 10.245 3d(2v + v5) a /2e→4pe' 10.255 10.273 10.270 4pa'1(v6) 10.290 10.300 4pa'1(v5) 10.315 [4d'] 10.354 4pa'1(v)a 10.363 10.370 4pa1(v + v5) a [10.398] [4pai(v + 2v6)] a
10.422 10.410 2e→ 5sa1 10.419 [6sa1]
10.426 4pa'1(v + v6)a 10.441 10.440 2e→ 5sa'1 10.448 4pa1(v + 2v5) a /2va 10.459 4pa'1(v + v5) a 10.486 10.480 4pai(2v + 2v6) a 10.501 5sa1(v6) 10.515 4pa'1(2v) a 10.522 10.520 5sa'1(v6) a 10.525 [6sa'1] 10.555 10.550 4pa'1(v + 2v5)a 10.552 [6pe] 10.578 10.580 2e→ 5pa1 10.609 10.610 5sa'1 (v) a 10.606 [5d] 10.624 2e → 5pa'1 10.638 2e → 5pe
10.684 10.690 5pa1(v5) or 2e→5pe' 10.697 [6pe']
10.696 or 5pa'1 (v6) 10.722 10.720 2e → 6sa1 10.746 10.750 2e → 6sa'1 10.762 [7sa1/5d'] [10.756] 10.780 5pa'1(v) a
10.803 10.800 5pa'1(v5 +v6) or 2e → 6pa1 10.819 [7pe/7sa'1]
10.810 10.834 10.830 2e → 6pa'1 10.855 2e → 6pe 10.847 [6d] 10.867 10.870 5pa'1(v + v6)a 10.875 [8sa1] 10.898 10.900 2e → 7sa1 10.924 [7pe'/6d’] 10.912 or 2e → 7sa'1 10.927
Table 3 (continued) PAS Réf. [2] PIPP This work Assignment(s) Réf. [2] PIPP Réf. [4] 10.941 10.940 2e→7pa1 10.942 [8pe/8sa'1] 10.950 10.974 10.980 2e → 7pa'1 11.004 11.010 2e →8sa1
11.030 11.030 2e → 8sa'1 or 2e → 8pa1 11.030 [9pe/8pe'/9sa1]
11.068 11.070 2e → 8pa'1 or 2e → 8pe' 11.088 11.090 2e→9pa1 11.113 11.121 11.120 2e → 9pa'1 11.134 11.146 11.150 2e → l0pa1 11.175 11.170 2e → l0pa'1 or 2e → 12sa1
11.193 11.200 2e→ 13sa1 or 2e→ llpa'1
11.226 [11.227] 2e → 13pa'1
a
For discussion on the nature of the v vibrational mode, see Ref. [2].
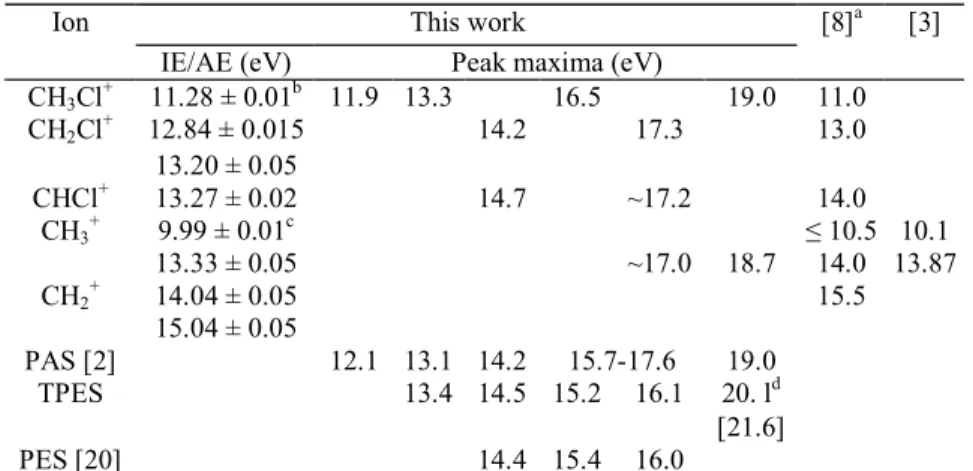
Table 4-IE, AE and peak maxima measured in the photoionization efficiency curves of the parent and fragment ions produced by photoionization of CH3Cl
This work Ion
IE/AE (eV) Peak maxima (eV)
[8]a [3] CH3Cl+ 11.28 ± 0.01b 11.9 13.3 16.5 19.0 11.0 CH2Cl + 12.84 ± 0.015 14.2 17.3 13.0 13.20 ± 0.05 CHCl+ 13.27 ± 0.02 14.7 ~17.2 14.0 CH3 + 9.99 ± 0.01c ≤ 10.5 10.1 13.33 ± 0.05 ~17.0 18.7 14.0 13.87 CH2 + 14.04 ± 0.05 15.5 15.04 ± 0.05 PAS [2] 12.1 13.1 14.2 15.7-17.6 19.0 TPES 13.4 14.5 15.2 16.1 20. ld [21.6] PES [20] 14.4 15.4 16.0
PAS [2] and PES (this work and Ref. [20]) results are reproduced for easiness of the discussion. Previous results [8,3] are shown for comparison.
a
Standard error: ±1.0 eV [8].
b
For more details, see Table 1, column 3.
c
For more details, see Table 1, column 2.
d
For more details, see text.
and 11.316 ±0.010 eV. As shown earlier [2,20] the ionization from the 2e and the le orbitals are accompanied by Jahn-Teller distortion. Contrarily to the case of the CH3F ionization [28], in the present molecular system this
vibroniccoupling is small compared to the spin-orbit coupling [2].
Higher lying ionic states are characterized by vertical IEs reported at 14.4, 15.4 and 16.1 eV corresponding to a 3a1
-1
and a le-1 ionization [20]. The doublet at 15.4-16.0 eV is assigned to the Jahn-Teller splitting arising from the le-1 ionization [20]. In very good agreement with this experiment, the corresponding energies are measured at 14.45 ± 0.02, 15.24 ± 0.02 eV and at 16.10 ± 0.05 eV as a shoulder in the present work.
To our knowledge, the only work at photon energies above the 21.22 eV limit has been reported by Von Niessen et al. [26]. These authors used the He(II) resonance line at 30.4 nm (40.8 eV). Beside the already mentioned IEs below 21.22 eV, they reported two IEs, i.e. at 21.7 and at 24.1 eV successively. These were assigned to 2a1
-1
and 1a1 1
ionizations. These assignments were supported by quantum mechanical calculations. However, by TPES spectroscopy beside the band peaking at 21.60 ± 0.02 eV, an additional feature is observed starting at 19.0 eV and peaking at 20.10 ± 0.02 eV.
Table 5-Vertical excitation energies ∆Eexe (eV) and derived IE (eV) for CH3C1+ at the CASSCF(9,8)/6-31++G**
and CASSCF(ll,7)/6-31++G** levels, obtained at the neutral CASSCF(7,6)/6-31++G** optimized geometry in the C3v point group (the symmetry of the states and their description by the main configurations and their CI
coefficients are included)
CASSCF(9,8) CASSCF(11,7)
∆Eexc IE Symmetry Configuration ∆Eexc IE Symmetry Configuration
0.0 11.11 12E 2e-1: 0.96 0.0 11.11 12E 2e-1: 0.99 3.53 14.64 12A1 3a1 -1 : 0.99 3.32 14.43 12A1 3a1 -1 : 0.99 4.89 16.00 22E le-1: 0.93 5.18 16.29 22E le-1: 0.94 9.24 20.35 22A1 2e-24a11: 0.96 9.23 20.34 32E 2e-24a11: 0.79a/0.56, - 0.56 9.27 20.38 32E 2e-24a1 1 : 0.94a /0.67, -0.67 9.24 20.35 22A1 2e -2 4a1 1 : 0.89 9.88 20.99 32A1 2e -2 4a1 1 : 0.64, 0.64 9.59 20.70 32A1 2e -2 4a1 1 : 0.52, 0.52 10.91 22.02 42A1 le -1 2e-14a1 1 : 0.7, -0.7 10.93 22.04 42A1 le -1 e-14a1 1 : 0.7, -0.7 11.76 22.87 42E 3a1-12e-14a11: 0.82 11.35 22.46 42E 3a1-12e-14a11: 0.83 11.94 23.05 52E 1e-12e-14a1 1 : 0.7, -0.7 12.00 23.11 52E le-12e-14a1 1 : 0.7, -0.7 12.10 23.21 52A 1 le-12e-14a11: 0.7, 0.7 12.90 24.01 62A1 2a1-1 :0.68 3a1-2 4a11: -0.44 13.04 24.15 72A1 le -1 2e-14a1 1 : 0.63, -0.63 13.32 24.43 62E le-12e-14a1 1 : -0.56, 0.56 14.92 26.03 82A1 2a1 -1 : 0.44 a
For the degenerate state 32
E, the CI coefficients for the two states are different and are separated by a slash and correspond respectively to [(2e)1 -1 (2e)2 -1 4a1 1 ]/[(2e)1 -2 4a1 ,(2e)2 -2 4a1 -1 ].
Table 6-Geometrical parameters at the optimized geometries of the fragment cations Species (symmetry group) C-Cl C-H H-C-H H-C-Cl CH2 + (C2v) - 1.0880 139.28 - CH3 + (D3h) - 1.0850 120.00 - CHCl+(CS) 1.5492 1.0911 - 131.72 CH2Cl+(C2v) 1.5877 1.0857 121.38 119.31
These geometries were obtained at the MP2/6-31G** level. The internuclear distances and angles are expressed in Å and degrees respectively.
Beside these latter discrepancies with fixed wavelength PES, peak shape and the relative intensities are quite different or even inverted in the TPES. For instance, while in the He(I) PES [20] the broad band extending from 13.8 to 17.8 eV has about a 20 times smaller intensity as compared to the first band, it dominates the TPES. On the other hand, the present spectrum shows several additional features, e.g. in the first band (see Table 1) and at 13.40 ± 0.02 eV. In the first band the relative intensities of the various vibrational transitions differ from the He(I) PES.
For the first photoelectron band a more detailed analysis together with assignments are presented in columns 2 and 6 of Table 1 respectively. Up to 11.430 eV the results could be compared with photoabsorption data, as shown in column 1 in Table 1 and in Fig. 2b. From the comparison between columns 2 and 5 it appears that all the vibrational transitions observed in the He(I) PES are present in the TPES spectrum. As mentioned earlier [2] we reassigned the vibrational structure in the PES (see column 6 in Table 1) on the basis of ab initio calculations of the vibrational wave numbers of CH3Cl
+
(2A') in the Cs symmetry group.
It is rather uneasy to make unambiguous assignments of the additional features observed in the TPES using the data from the PAS where, above 11.430 eV photon energy, no discrete structure is observed anymore (see Fig. 2b). In the TPES these structures have to be generated by zero or nearly zero kinetic energy electrons as provided by autoionization. However, owing to the finite width of the analyzer bandpass, several of the observed features could be characterized by a term value lying between 0.060 and 0.070 eV. This leads to principal quantum numbers n as high as 15.
Table 7-Energy position (eV) of several structures observed in the TPES of CH3Cl and tentative assignments in
terms of Rydberg states characterized by their term value ∆ = R/n*2, effective principal quantum numbers (n*) and their respective convergence limits
TPES Convergence limit Term ∆a n*
11.308 11.372 (2E3/2,v6) 0.064 14.580 11.328 11.400 (2E3/2, v5) 0.072 13.747 11.428 11.488 (2E1/2, v or 2 E3/2, v5 + v6) 0.060 15.059 11.500 (2E3/2, 2v5) 0.072 13.747 11.444 11.512 (2E1/2,v5 + v6) 0.068 14.145 11.512 11.584 (2E1/2, v + v6) 0.072 13.747 11.596 11.664 (2E1/2, v + v5 or 2 E3/2, 2v + v6) 0.068 14.145 11.652 11.713 (2E1/2,2v + v6) 0.061 14.935 11.688 11.748 (2E3/2,2v + 2v6) 0.060 15.059 a
Standard error: ±0.010 eV.
Though very speculative, such a classification is proposed in Table 7 together with the convergence limit (including the vibrational quantum number), the value of ∆ and the effective quantum number n*. From this table, the resonant or nearly resonant autoionizations can occur to vibrationally excited ionic states of CH3Cl+(2A'). It is likely that the involved autoionizing states would be vibrationally excited Rydberg states.
From Table 1, the comparison of the TPES spectroscopic data with those obtained by photo-ionization mass spectrometry gives some insight on the evolution of these levels. Particularly, several features are present in the photoionization yield curve of CH3C1
+
/CH3C1 or in the photoion-pair process (PIPP) producing CH3 +
+ Cl- which will be discussed later in this section.
A fairly strong "shoulder", filling up the gap between the X~2E and à 2A1 states, is observed at 13.4 eV
photon energy. It can obviously be correlated with the neutral state observed at 13.1 eV in the PAS as clearly shown in Fig. 2a. This state has been assigned to an le→3p Rydberg transition [1]. Vibrational fine structure is present neither in the TPES nor in the PAS. This would indicate that in this energy range one is dealing with a continuum or a continuum-like absorption due to a high density of unresolved vibronic structures close to a continuum. As will be discussed later in this section, several major dissociation channels of CH3Cl
+
are open in this energy range.
As already mentioned, at 14.5, 15.2 and 16.1 eV the à 2A1 and B~ 2
E bands exhibit an intensity inversion with respect to their population in the He(I) PES where these states are measured at 14.5, 15.4 and 16.0 eV [20]. This major intensity increase has very likely to be related to the existence of neutral Rydberg states at 14.2 eV and in the photon energy range of 15.7-17.6 eV. These were assigned to Rydberg transitions from 3a1 and le to
ns orbitals [1]. Their resonant autoionization can contribute significantly to the observed intensity increase of these à 2A1 and B
~2
E ionic states.
Fig. 2c shows an enhancement of the TPES signal observed at high photon energies between 18 and 23 eV. Clearly two bands are observed characterized by a maximum at 20.1 and 21.6 eV successively. The first band starting at 19.0 eV probably consists of three components with their maximum at 19.6, 20.1 and 20.6 eV successively. This band has never been reported earlier. Contrarily, the second band peaking at 21.6 eV has been mentioned in the He(II) PES [26]. Its intensity is about three times stronger than the peak at 20.1 eV. Furthermore, as observed for the first time, it seems to exhibit regularly spaced structures listed in Table 2. Beside the energy interval of ∆ ≈ 240 meV (1940 cm-1) an energy spacing ∆ ≈ 160 meV (1300 cm-1) is detected. This could mean that the peak at 21.6 eV would actually cover at least two different close lying states characterized by two fairly distinct vibrational wave numbers.
Table 2 also displays the results of a photoabsorption measurement reported by Wu et al. [21] in the photon energy range of 20.29-21.16 eV. These authors assigned these features to the fine structure of a Rydberg state converging to the nearest ionization limit, i.e. at 21.5 eV. Comparing the energy intervals ∆ in both the Rydberg and the ionic states, these quantities diverge significantly even when a standard error of 20 meV is taken into account. No error estimate is mentioned in the photoabsorption work. Nevertheless, if this interpretation is correct only one vibrational motion of hcω ≈ 240 meV should be involved and the Rydberg state would be characterized by 4.05 < n* < 4.53. Concerning the nature of these states, we have to refer to the ab initio calculation results obtained in this work.
Below the IE calculated at 24.01 eV, mainly related to the ionization of the 2a1 MO, seven excited
states of the cation are obtained. These can be gathered according to their energies: [20.34, 20.35, 20.70 eV] correspond to a single [2e-2, 4a1
1
] configuration, [22.04, 22.46 eV] correspond to [le-1, 2e-1, 4a1 1
] and [3a1 -1
, 2e-1, 4a11] configurations and finally [23.11, 23.21 eV] correspond to [le-1, 2e-1, 4a11]. Keeping in mind that the
dynamical electronic correlation is not taken into account, these three groups of states could be in fact at somewhat lower energies and correspond to the three components of the low intensity signals near 19.6, 20.1 and 20.6 eV.
For the assignment of the following TPES band characterized by its maximum at 21.6 eV the ab initio calculations (see Table 5) provide three close lying IEs, i.e. at 24.01, 24.15 and 24.43 eV. The first IE corresponds to the ionization of the 2a1 MO, whereas the two other IEs are both related to excited states with a
main le-1, 2e-1, 4a1 1
configuration. These results could be related to the observation of two different vibrational intervals, i.e. hcω ≈ 240 meV and hcω ≈ 160 meV.
Since the electronic correlation is not taken into account, the present ab initio calculation results are in quantitative disagreement with those obtained by the GF(OVGF) and the CEPA methods reported by Von Niessen et al. [26]. These authors assigned the IEs calculated at [22.65, 26.29, 27.54 eV] by GF and at 22.23 eV by CEPA to the 2a1
-1
MO ionization only and correlated these energies with the 21.7 eV peak of their PES. Finally, the same authors related the 24.1 eV band in the He(II) PES to the la1 MO ionization calculated between
26.3 and 29.3 eV.
4.2. Photoionization mass spectrometry 4.2.1. The CH3Cl
+
molecular ion (see Fig. 3)
The investigation of the photoionization efficiency curve of CH3C1 (see Fig. 3) at medium resolution
mainly shows two regions of interest: (i) the threshold region and (ii) the region of broad resonances.
The threshold region exhibits a large number of fine structures listed in the third column of Table 1. The energy position of most of the features are in very good agreement with the TPES and the He(I) PES data. A few structures are common with those of the TPES and are ascribed to autoionization. Very likely the resolution of the photoion yield curve is not sufficient to observe the other autoionization features observed in the better resolved TPES. The last column of Table 1 shows the detailed assignment proposed for these structures.
The remaining broad resonances observed in the CH3C1 +
yield curve at 11.9, 13.3, 16.5 and 19.0 eV could very likely be correlated with the broad resonances observed in the PAS of CH3C1 in the same photon
energy range, i.e. at 12.1, 13.1 eV, in the range of 15.7-17.6 eV and at 19.0 eV. These were assigned to Rydberg transitions [1] which autoionize to lower lying ionization continua, e.g. to 2e-1, 3a1-1 and 1e-1. These observations
corroborate the existence of autoionization processes contributing to modify (strongly in some cases) the relative intensities of the corresponding bands in the PES and consequently the ionization cross-section of CH3Cl.
4.2.2. The CH2Cl +
fragment ion (see Fig. 4a)
The photoion yield curve of CH2Cl+ exhibits a fairly sharp rise at 12.84 ± 0.015 eV as determined from
the numerical first differentiated ionization efficiency curve. This AE lies in the ionization cross-section gap of CH3Cl between 11.8 and 13.8 eV in the He(I) PES. To this energy should correspond the opening of the
dissociation channel CH3Cl + hv → CH3Cl* (1e→3p) autoioniz. CH2Cl + (X~1A1) + H( 2 S) + e- (1)
which could occur at this energy only through a dissociative autoionization process. Both fragments in their specified spectroscopic term correlate with the ground electronic state of CH3C1
+
(2A')· The TPES spectrum of CH3C1 (see Fig. 2a) shows a continuum rising up from 12.4 eV which peaks at 13.5 eV. This same resonance is
observed in the CH3C1+ yield curve and in the PAS [1] (see Table 4).
As mentioned also in Table 4, the CH2Cl+ ion yield curve peaks at 14.2 eV and its first derivative shows
a maximum near 13.20 eV. Fig. 4a clearly shows the overlap of the 14.2 eV peak in the ion yield and in the PAS. However, it has to be kept in mind that the à 2A1 photoelectron band starting at 13.8 eV and having its maximum
at 14.4 eV is structureless. This could suggest that this state has to be fully dissociative in the Franck-Condon region.
In the same Table 4, two weak resonances are identified in the 16-20 eV photon energy range, i.e. at 17 and 18 eV. These resonances are correlated to the weak broad structures in the PAS as shown in Fig. 4a. Here also, dissociative autoionization likely contributes to the CH2Cl
+
ion production at the expense of lower lying ionization continua of the à 2A1 and B~
2
E states.
Introducing the lowest onset energy measured in this work and the heat of formation ∆fH298 related to
the species involved in reaction (1) [29] one obtains ∆fH298(CH2Cl+) = 223 kcal mol-1 or 9.69 eV. Though
somewhat smaller, this is in good agreement with the value obtained from the direct ionization of the CH2C1
radical, i.e. 229 kcalmol-1 [29]. By recent ab initio calculations [30] a value ∆fH298(CH2C1 +
) =226.9 kcalmoH has been reported. Furthermore, the translational energy distribution of this fragment ion has been measured and is essentially thermal [31]. Assuming neither translational nor internal energy is involved in this reaction an upper limit of the dissociation energy of CH3Cl
+
→ CH2C1 +
+ H could be estimated leading to D(H-H2CC1 +
) ≤ 1.55 eV. Ab initio calculations performed in this work, applied to CH3C1
+
at the MP2/6-31G** level, provide a dissociation energy (taking into account the ZPE) of 1.498 eV.
In the PEPICO work of Eland et al. [32] the CH2Cl+ ion signal was too weak to be measured in
coincidence, i.e. about 1% of the CH3Cl+ ion intensity. In the present work, the intensity ratio of ICH2Cl+/ICH3Cl+
about 16% with 20 eV photons. Using the He(I) resonance line this ratio becomes 5%. On the basis of the low intensity of CH2C1
+
, these authors [32] argue that the CH3C1 +
(X~) state is not expected to decay in this channel
owing to the slowness of the internal conversion with respect to competing dissociations, e.g. the CH3+
production. The small amount of CH2C1 +
ions observed in the mass spectrum is ascribed to specific dissociation of the B~2E state. From the present study, coincidences should not be observed at the lowest threshold because there is no ionic state available for either vertical ionization or dissociation over the energy range of about 1 eV above the onset at 12.84 eV. Furthermore, both the à 2A1 and the B
~2
E states should contribute to the CH2C1 +
ion production. The increase of the CH2C1
+
ion yield from 16 eV corresponds to both the vertical IE of the CH3C1+(B
~2
E) state and to a broad band in the PAS. Finally, as will be discussed below, in the CH2C1 +
onset region several dissociation channels are open leading to CHC1+ and CH3
+
. These should be in competition with the H-loss decay.
4.2.3. The CHCl+ fragment ion (see Fig. 4b)
At the onset the photoionization efficiency curve of CHC1+ first shows a slow increase before it rises steeply around 13.6 eV. The best AE of CHC1+ could be obtained from the first derivative of the photoion yield curve and is measured at AE(CHC1+) = 13.27 ±0.02 eV. This energy corresponds again to the weak resonance at 13.1 eV in the PAS and the rather strong maximum at 13.4 eV in the TPES. On the basis of these observations the production of CHC1+ from CH3C1 could schematically follow the path
The threshold of this reaction is at the same energy level as the inflexion point in the ion yield curve of CH2C1 +
. This is a strong indication that at this energy there is competition between the two uni-molecular reactions (1) and (2) producing CH2C1+ and CHC1+.
reaction (2) [29] one obtains ∆fH298(CHC1+) = 12.38 eV or 285.5 kcalmol-1. This result has to be compared to the
value of 298 kcal mol-1 as derived from hydrogen affinity considerations [29] and to the most recent ab initio calculated value of 286.7 kcalmol-1 obtained by Rodriquez et al. [30].
Above 16 eV photon energy a second increase of CHC1+ ion yield is observed. This energy corresponds to the vertical IE of CH3C1
+
(B~2E) state and to a broad band in the PAS. At these levels the dissociative ionization leading to CH2C1+ and CHC1+ should compete.
4.2.4. The CH2+ fragment ion (see Fig. 4c)
Clearly the CH2 +
photoion yield curve exhibits two distinct slopes. The lowest onset is measured at AE(CH2
+
) = 14.04 ± 0.05 eV and the slope change is measured at 15.04 ± 0.05 eV. The CH2 +
ion is the only fragment investigated in this study whose threshold energy lies outside the energy range of 13.1-13.3 eV. In Fig. 4c the PAS of CH3Cl is reproduced between 13 and 18 eV photon energy. As it clearly appears from this figure,
the first part of the ion yield curve runs over the photon energy range covered by the photoabsorption feature at 14.2 eV. However, the vertical ionization of the CH3Cl
+
( Ã 2A1) state is 13.8 eV. As mentioned earlier this state
presumably is a continuum. Very likely at about 14 eV both direct ionization and autoionization compete and contribute to populate the à 2A1 state which in turn dissociates by
The translational energy distribution of CH2+/ CH3Cl has been recorded for 21.22 eV photons [31]. Beside an
important thermal component the distribution shows a long tail extending up to 3.0 eV total kinetic energy. Assuming the thermal ions being produced at threshold and internal energy is involved neither in CH2
+
nor in HC1, the thermo-dynamical onset is calculated at 14.33 eV using the data of Refs. [29,33]. The large discrepancy of 0.29 eV, compared to the precision reported on the available data [29] and on the present measurements, is difficult to explain. On the other hand, the ab initio calculations presented in Section 3.3 predict the dissociation (3) at 2.855 eV above the X~2A' ground state of CH3C1
+
at 11.29 eV, i.e. 14.15 eV close to the onset measured in the present work.
Considering BH2 as the isoelectronic species of CH2 +
, its first electronic state is a linear 2B1 state lying
at 5150 cm-1 [34] above the X~2A1 ground state. These states result from the Renner-Teller splitting of the linear 2
∏ state. Possibly, the threshold observed at 15.04 eV could be assigned to the reaction
Ab initio calculations at the MP2/6-31G** level on CH2 +
in the ground state X~2A1 (C2v) geometry provided an
excitation energy of à 2B1 of 0.922 eV and a bent-to-linear configuration barrier of 0.163 eV.
These fragments could be correlated with the Jahn-Teller split B~2E state of CH3C1 +
[20]. The two components are characterized by vertical IEs of 15.4 and 16.0 eV. The corresponding photo-electron bands do not show any fine structure and are very likely fully dissociative in the Franck-Condon region. As already mentioned earlier, autoionization strongly contributes to the intensity of this photoelectron band and consequently also to the dissociative ionization it brings about.
4.2.5. The CH3 +
fragment ion (see Fig. 5)
The photoionization efficiency curve of CH3 +
energy. It can roughly be divided in two parts: (i) the low-energy, very weak ion yield spreading from 10 to 13 eV and (ii) the high energy, high ion yield curve extending from about 13 to 20 eV. The former part is abundantly structured whereas the latter part has a smooth shape.
The measured lowest threshold energy of the low-energy part should only be an upper limit, i.e. AE(CH3+) ≤ 9.99 ± 0.01 eV. The lack of precision on this critical energy has to be ascribed to the low
signal/noise ratio at the onset (see Fig. 5b). Indeed, a few structures are observed less clearly below 9.99 eV and are listed in brackets in Table 3. Above threshold an abundant structure is observed and the energy position of the resonances are listed in column 2 (PIPP) of Table 3.
To help in the interpretation and assignment of these structures recent photoabsorption data [2] have been used, as shown in column 1 (PAS) in Table 3. In the energy range of 10-12 eV, lying almost entirely below the first IE of CH3C1, the resonance-shaped structure could only be ascribed to dissociative photoionization
processes involving ion-pair production through the mechanism
where the intermediate state has to be a neutral CH3Cl(A1) state in the C3v symmetry group. From the observed
discrete structure in the ion yield and its strong correlation with the vibronic structure in the PAS, the dissociation process should occur by vibronic predissociation of successive Rydberg states listed in column 3 in Table 3. By a thermodynamical cycle, the onset calculated for process (5) should be at 9.87 ± 0.05 eV [29] and has to be compared to the experimental upper limit of 9.99 ± 0.01 eV. From Table 3 almost all Rydberg states above the ion-pair onset are involved and predissociated, i.e. nsa1 (n = 5-13), npa1 (n = 4-13), npe (n = 4-8) and
3d Rydberg states. Most of the vibrational levels involved are of v5 and v6 type and their combination with an
other mode v which could not be assigned unambiguously. However, it could presumably correspond to the CH3
umbrella mode in the molecular ion as discussed in Ref. [2]. Remarkably though this latter mode is excited individually in the Rydberg states, it seldom decays into the ion-pair channel.
At energies higher than those involved in the ion-pair formation, the CH3+ photoion yield curve steadily
rises from 13 to 16 eV. As shown in Fig. 5a, the curve shows a parabolic behavior at threshold. This makes difficult to determine accurately the AE of CH3
+
. To approach this value as close as possible the linear extrapolation method of the first differentiated ionization efficiency has been applied [23,24]. By this method a threshold AE(CH3
+
) = 13.33 ± 0.05 eV has been determined and is shown by a vertical line in Fig. 5a. For comparison, the onset reported earlier [3] at 13.87 eV is shown by a dashed line in the same figure. At this latter energy, the CH3+ ion current is already relatively important.
The AE measured in this work lies below the vertical IE of the CH3Cl +
( Ã 2A1) state and corresponds to
an energy region where no ionization cross-section is measured in the He(I) PES of CH3C1 [20]. Furthermore, it
is close to the onset energy of CH2C1+ (12.87 and 13.2 eV) and CHC1+ (13.27 eV). As noticed earlier, a
continuous-shaped band peaks at 13.4 eV in the TPES spectrum whereas a band is observed at the same energy in the PAS [2] (see Fig. 5a). These observations would suggest that the production of CH3
+
at its lowest onset should occur through the dissociative autoionization mechanism
for which the onset can be calculated [29] at 13.44 ± 0.02 eV and corresponds to the lowest dissociation limit in this decay channel. However, this value could be an overestimate. Indeed, from the present onset energy and IE measurements a dissociation energy D(CH3
+
-C1) = 2.041 ± 0.050 eV is deduced. Ab initio calculations performed in this work provide D(CH3
+
experiment.
The products of reaction (6) correlate with the 2A1 and 2
E states of CH3C1 +
in the C3V symmetry group.
This dissociation should also produce almost thermal CH3 +
ions. The kinetic energy distribution of CH3 +
ions has been measured with He(I) and Ne(I) resonance lines [31]. Beside a broad distribution corresponding to energetic ions a thermal CH3+ peak is observed. This latter contribution has an increasing relative intensity when
decreasing the photon energy [31] and should correspond to those ions produced at or close to the dissociation limit. These ions cannot be observed by the PEPICO technique. Eland et al. [32] only mention CH3
+
ions carrying 0.45 eV translational energy and which are observed in coincidence with à 2A1 and B
~2
E photoelectrons. This situation is quite similar to that observed for the appearance of CH3
+
ions from CH3F which has been
investigated in detail [35-38].
Above the threshold at 13.33 eV several other critical energies are listed in Table 4, i.e. at about 17.0 and 18.7 eV. These are better located in the first differentiated ionization efficiency curve where maxima are measured at 14.3, 15.3 eV and at about 18.3 eV successively. The first two maxima will very likely correspond to the à 2A1 and B
~2
E dissociative ionic states of CH3C1 +
and to the autoionizing contribution of the Rydberg state at 14.1 eV. The maxima at 17.0 and 18.7 eV in the ion yield curve lie in the energy range of the broad absorption bands at 16.5 and 19.1 eV (see Fig. 5a). Obviously these contributions are not observed by PEPICO. 5. CONCLUSIONS
The aim of the present report was to complete our study of CH3C1 by investigating the TPES and the
fragmentation pattern of CH3C1 between 8 and 23 eV photon energy. Ab initio calculations were performed at
the CASSCF and at MP2/6-31G** levels to help in the assignment of states resulting from double excitations. In the TPES, in the 12.0-13.8 eV ionization gap, a strong continuous band has been observed at 13.4 eV. The numerous features observed in the first band have been assigned with the help of PAS data [2]. Furthermore, an important relative intensity inversion of both the à 2A1 (at 14.4 eV) and the B
~2
E (at 15.4-16.0 eV) has been observed. Above 18.0 eV weak to very weak bands have been assigned to doubly excited configurations of the ion and to single inner-valence shell 2a1
-1
ionization.
The medium resolution mass spectrometric photoionization of CH3Cl has been examined in detail. The
most important ions, of relative intensities ranging from 1% to 100%, have been included in the present study, i.e. CH3C1 + , CH2C1 + , CHC1+, CH3 + and CH2 +
. In all dissociative ionization channels the contribution of autoionization has been shown to be important when not crucial. Most of the critical energies could be correlated with photoabsorption bands. This is particularly the case at the lowest onset energy of the decay channels CH3+ +
Cl, CH2C1+ + H and CHC1+ + H2 where the le → 3p Rydberg state plays a central role. For all fragmentations,
the mechanisms have been discussed in detail. For CH3 +
the photoion-pair producing process showed an abundant fine structure which has been interpreted by successive predissociation processes of Rydberg states all identified with the help of the PAS data [2].
Acknowledgements
We are indebted to the University of Liège, the Freie Universität Berlin and the Bundesministe-rium fur Forschung und Technologie for financial support. H.B. acknowledges the Fonds der Chemischen Industrie for financial support. R.L., B.L. and A.H. gratefully acknowledge the European Community for its support through its TMR programme (contract EU-TMR-ERBFMGE-CT-970123). B.L. thanks the Fonds National de la Recherche Scientifique (Belgium) for a research associate position. This work has also been supported by the Direction de la Recherche Scientifique de la Communauté Française de Belgique through an Action de Recherche Concertée (ARC). D.D.'s contribution was supported by the Belgian Programme de Pôles d'Attraction Interuniversitaire (PAI n° P4/03) initiated by the Belgian state, the Prime Minister's Office, the Federal Office of Scientific, Technical and Cultural Affairs. We also wish to thank the BESSY staff for the outstanding maintenance of the equipment.
References
[2] R. Locht, B. Leyh, A. Hoxha, D. Dehareng, H.W. Jochims, H. Baumgärtel, Chem. Phys. 272 (2001) 277. [3] M. Krauss, J.A. Walker, V.H. Dibeler, J. Res. N.B.S. 72A (1968)281.
[4] S. Suzuki, K. Mitsuke, T. Imamura, I. Koyano, J. Chem. Phys. 96 (1992) 7500. [5] H. Branson, C. Smith, J. Am. Chem. Soc. 75 (1953) 4133.
[6] S. Tsuda, CE. Melton, W.H. Hamill, J. Chem. Phys. 41 (1964) 689. [7] S. Tsuda, W.H. Hamill, J. Chem. Phys. 41 (1964) 2713.
[8] T.N. Olney, G. Cooper, W.F. Chan, G.R. Burton, C.E.Brion, K.H. Tan, Chem. Phys. 205 (1996) 421. [9] R. Locht, B. Leyh, K. Hottmann, H. Baumgärtel, Chem. Phys. 220 (1997) 217.
[10] A. Hoxha, R. Locht, B. Leyh, D. Dehareng, K. Hottmann, H.W. Jochims, H. Baumgàrtel, Chem. Phys. 260 (2000) 237.
[11] CE. Moore, Ionization Potentials and Ionization Limits from the Analyses of Optical Spectra, NSRD-NBS 34 (Sept. 1970), US Dept. Commerce Nat. Bur. Stand., US Govt. Print. Off., Washington, DC 20402.
[12] R. Locht, B. Leyh, W. Denzer, G. Hagenow, H.Baumgärtel, Chem. Phys. 155 (1991) 407.
[13] M.J. Frisch, G.W. Trucks, H.B. Schlegel, P.M.W. Gill, G.G. Johnson, M.A. Robb, J.R. Cheeseman, T.A. Keith, G.A. Petersson, J.A. Montgomery, K. Raghavachari, M.A. Al-Laham, V.G. Zakrzewski, J.V. Ortiz, J.B. Fores-man, J. Cioslowski, B.B. Stefanov, A. Nanayakkara, M.Challacombe, C.Y. Peng, P.Y. Ayala, W. Chen, M.W. Wong, J.L. Andres, E.S. Replogle, R. Gomperts, R.L. Martin, D.J. Fox, J.S. Binkley, D.J. Defrees, J. Baker, J.P. Stewart, M. Head-Gordon, C. Gonzalez, J.A. Pople, GAUSSIAN94, Revision D.4, Gaussian Inc., Pittsburgh, PA, 1996.
[14] D. Hegarty, M.A. Robb, Mol. Phys. 38 (1979) 1795. [15] R.H.E. Eade, M.A. Robb, Chem. Phys. Lett. 83 (1981) 362.
[16] F. Bernardi, A. Bottini, J.J.W. McDougall, M.A. Robb, H.B. Schlegel, Faraday Symp. Chem. Soc. 19 (1984) 137.
[17] W.J. Hehre, R. Ditchfield, J.A. Pople, J.Chem. Phys. 56 (1972) 2257.
[18] T. Clark, J. Chandrasekhar, G.W. Spitznagel, P.v.R. Schleyer, J. Comp. Chem. 4 (1983) 294. [19] M.J. Frisch, J.A. Pople, J.S. Binkley, J. Chem. Phys. 80 (1984) 3265.
[20] L. Karlsson, R. Jadrny, L. Mattsson, F.T. Chau, K. Siegbahn, Phys. Scripta 16 (1977) 225. [21] C.Y. Wu, L.C. Lee, D.L. Judge, J. Chem. Phys. 71 (1979) 5221.
[22] P.J. Mohr, B.N. Taylor, J. Phys. Chem. Ref. Data 28 (1999) 1713. [23] R. Locht, J. Momigny, Int. J. Mass Spectrom. Ion Phys. 7 (1971) 121. [24] R. Locht, J. Schopman, Int. J. Mass Spectrom. Ion Phys. 15 (1974) 361. [25] T. Koopmans, Physica's Grav. 1 (1933) 104.
[26] W. Von Niessen, L. Åsbrink, G. Bieri, J. Electron. Spectrosc. Rel. Phenom. 26 (1982) 173.
of Fundamental Organic Molecules, Japan Sci. Soc. Press, Tokyo and Halstaed Press, New York, 1981. [28] R. Locht, B. Leyh, A. Hoxha, D. Dehareng, H.W. Jochims, H.Baumgärtel, Chem. Phys. 257 (2000) 237. [29] S.G. Lias, J.E. Bartmess, J.F. Liebman, J.L. Holmes, R.D. Levin, W.G. Mallard, J. Phys. Chem. Ref. Data 17 (Suppl.1) (1988).
[30] CF. Rodriquez, D.K. Bohme, A.C. Hopkinson, J. Phys. Chem. 100 (1996) 2942. [31] R. Locht, A. Hoxha, B. Leyh, J.C. Lorquet, A.J. Lorquet, to be published.
[32] J.H.D. Eland, R. Frey, A. Kuestler, H. Schulte, B. Brehm, Int. J. Mass Spectrom. Ion Phys. 22 (1976) 155. [33] B. Ruscic, M. Litorja, R.L. Asher, J. Phys. Chem. A 103 (1999) 8625.
[34] G. Herzberg, Molecular Spectra and Molecular Structure. III. Electronic Spectra and Electronic Structure of Polyatomic Molecules, Van Nostrand, Princeton, NJ, 1967.
[35] R. Locht, J. Momigny, Int. J. Mass Spectrom. Ion Process. 71 (1986) 141.
[36] R. Locht, J. Momigny, Photopysics and Photochemistry above 6 eV, Elsevier, Amsterdam, 1985, p. 171. [37] R. Locht, J. Momigny, E. Rühl, H. Baumgärtel, Chem. Phys. 117 (1987) 305.


![Table 1-Position in energy (eV) of fine structures in the PAS [1], TPES, PIMS, PIPP and PES measurements](https://thumb-eu.123doks.com/thumbv2/123doknet/5463124.129313/6.918.147.782.125.584/table-position-energy-structures-tpes-pims-pipp-measurements.webp)