IOP Conference Series: Earth and Environmental Science
PAPER • OPEN ACCESS
An analysis of the development of port operation
in Da Nang Port, Vietnam
To cite this article: T D H Nguyen and M Cools 2018 IOP Conf. Ser.: Earth Environ. Sci. 143 012073
View the article online for updates and enhancements.
Related content
Vietnam to launch Earth-watch satellite
Kulvinder Singh Chadha
-42nd Vietnam National Conference on Theoretical Physics (NCTP-42)
-Improving the Reliability when Designing Formwork following Vietnam Standards
Duc Nang Bui and Tien Nam Nguyen
-Content from this work may be used under the terms of theCreative Commons Attribution 3.0 licence. Any further distribution 1234567890 ‘’“”
CUTE 2018 IOP Publishing
IOP Conf. Series: Earth and Environmental Science 143 (2018) 012073 doi :10.1088/1755-1315/143/1/012073
An analysis of the development of port operation in Da Nang
Port, Vietnam
T D H Nguyen1,3,4 and M Cools2
1Research Center for Quantitative Methods and Operation Management, Management School, University of Liege, Rue Louvrex,14, B-4000 Liege, Belgium.
2Faculty of Applied Sciences, University of Liege, Chemin de Chevreuils 1, Bât B52/3, B-4000,Liege, Belgium.
3Faculty of Project Management, University of Science and Technology, The University of Da Nang, 54 Nguyen Luong Bang St, Danang, Vietnam.
Abstract. This paper presents the current operating status in Da Nang Port, Vietnam in the
period 2012-2016. The port operation had positive changes that were reflected by a significant increase in total throughputs, especially containerized cargo volumes. Classical decomposition techniques are used to find trend-cycle and seasonal components of monthly throughput flows. Appropriate predictive models of different kinds of throughputs are proposed. Finally, a development strategy towards containerization and investment policies in facilities, equipment, and infrastructure are suggested based on the predictive results.
Keywords: Decomposition methods, monthly throughput forecasting, Da Nang port,
seasonally adjusted model, container flows.
1. Introduction
Vietnam is a developing country and its economy is mainly based on marine related sectors. It is estimated that the economic contribution of sea and coastal areas occupied nearly half of the total gross domestic product (GDP) of Vietnam in the period 2010-2015 [1]. The target set by the 10th Communist Party’s Central Committee adopted the Maritime Strategy in which the marine economy will contribute from 53% to 55% to Vietnam’s GDP by 2020 [2]. Thus, the maritime sector plays a vital role in the development of Vietnam’s economy. In other words, the economic performance of Vietnamese seaports can directly affect the country’s prosperity.
The Vietnamese seaport system is divided into three main sub-systems including Northern, Southern and Central ports. In the north, Hai Phong Port plays a significant role as the main gateway to the sea of Northern Vietnam, accounting for 13% of total throughputs of Vietnamese ports in 2016. In the south, ports in Ho Chi Minh city are the main gateway to the sea of Southern Vietnam, accounting for 67% of total throughputs of Vietnamese ports at the same time. There are two major ports, Da Nang Port and Quy Nhon Port, and nine minor ports in the central region. In 2016, total throughputs in Central region occupied 11.65% of total throughputs. Da Nang Port is one of the main ports serving the import and export needs of Central Vietnam [3].
This paper focuses on Da Nang Port, which has a significant strategic geographic position since the hinterland of Da Nang Port is Da Nang city and the Central Vietnam Key Economic Region. Da Nang is the fourth largest city in Vietnam in terms of urbanization and economy and the city with the most socioeconomic and cultural conditions in the central region. The Central Vietnam Key Economic
1234567890 ‘’“”
CUTE 2018 IOP Publishing
IOP Conf. Series: Earth and Environmental Science 143 (2018) 012073 doi :10.1088/1755-1315/143/1/012073
Region covers Thua Thien-Hue, Quang Nam, Quang Ngai, and Binh Dinh provinces, and Da Nang city. The Key Economic Region has four nuclear economic zones including Chan May-Lang Co, Chu Lai, Dung Quat, and Nhon Hoi, and seven major urban areas - Hue, Da Nang, Hoi An, Tam Ky, Van Tuong, Quang Ngai, and Quy Nhon. Da Nang Port is located in Da Nang bay with an area of 12 km2
and lies on a junction of four lanes to Da Nang international airport, national railway station, industrial zones in the area and national highway. Moreover, Da Nang Port is the final gateway of East-West Economic Corridor comprising four countries including Myanmar, Thailand, Laos and Vietnam [4].
The management board of Da Nang Port Company desires to develop the port as the leading trading gateway in the central region and the East-West Economic Corridor by focusing on the development of port operation and logistics services. Improvements have been made through investments by expanding its capacity, increasing the quality of services, warehouse systems with large yards, and good transportation system to serve the cargo transport smoothly. Consequently, the cargo volumes passed through Da Nang Port have increased sharply over the years, especially containerized cargo volumes [5]. Nevertheless, to the best of the authors’ knowledge, there is a lack of academic research related to the development of port operation in Da Nang Port. There are just few technical reports on the general development of the port provided by Asian Development Bank (ADB) [6] and Japan International Cooperation Agency (JICA) [7]. These reports mostly focus on issues that are of interest to the donor organizations. They are generated from fact finding missions combined with available secondary data using different approaches depending on the intended goals of the donors.
The objective of this paper is to present a neutral approach that reflects the development of port operation in Da Nang Port from a multi-dimensional perspective. Firstly, this paper presents and analyses the current status of port operation in Da Nang Port in recent years to help the readers understand the overall picture of its business situation. Then, the classical decomposition method used in time series data analysis is employed to find the trend-cycle and seasonal factors of different kinds of monthly throughputs. This helps port managers understand the evolutions of the container, general cargo, and total throughput flows, which is important for port planning, development and operation. In addition, appropriate predictive models for these flows are provided with the aim to support decision makers to produce efficient long-term development plans. In particular, reasonable investment plans in facilities, types of equipment, and infrastructure for port operation are suggested based on the predictive results. Furthermore, the findings of this paper can be used as a starting point to initiate other studies on possible future development directions of Da Nang Port . While there are several academic studies on Hai Phong Port and those in Ho Chi Minh city such as [8], [9], [10], [11], and [12], no in-depth study on Da Nang Port can be found in literature so far. Lastly, it is also a useful document for foreign investors looking for investment opportunities in Da Nang Port.
The remainder of this paper is structured as follows. Section 2 presents the literature review and general overview of Da Nang Port. The current status of port operation in Da Nang Port is described in Section 3. Section 4 provides the details on data and methodology for analysing the development of port operation in Da Nang Port. Section 5 shows the results of this study. Finally, several discussions and conclusions are presented in Section 6.
2. Literature review and general overview of Da Nang Port
2.1. Literature review
In general, the tendency of the close relationship between ports and supply chain leads to increasing research area that is port hinterland intermodal development. The contributions of early studies focus on the optimization of container flow. Results show that future studies attend to the optimization of global intermodal container flow along with sustainable development [13]. The research towards sustainable port development is also discussed in [14]. The results of this study help identify significant factors of sustainable port development from the perspective of port authorities. The opportunities, challenges, and implications for management in Vietnamese port system are also referred to this study.
Furthermore, the study on the efficiency and competitiveness of Vietnamese port system is discussed in [15]. There are many negative factors in the Vietnamese port system such as outdated
1234567890 ‘’“”
CUTE 2018 IOP Publishing
IOP Conf. Series: Earth and Environmental Science 143 (2018) 012073 doi :10.1088/1755-1315/143/1/012073
work practices, low efficiency, and poor competitiveness compared to other ports in the region. This research determines some of the issues in the Vietnamese port system and suggests some strategies to address them. Recently, a consideration for the developing a dry port system in Vietnam is considered as an emerging research. Dry ports are intermodal transport hubs in the inland, transhipment centres of sea cargo to inland destinations. [16] proposes conditions of the construction of a dry port system in the Indochina including Vietnam, Laos, and Cambodia. [8] presents the concept and classification of dry ports. It also examines and analyses the current status of domestic ports in the North and South of Vietnam. In addition, [10] introduces a multi-criteria approach to determine a dry port location in developing countries with application to Northern ports of Vietnam.
In addition, a strategic positioning analysis for Vietnamese ports is also a recent study direction. [9] uses dynamic portfolio analysis to analyse the competitive position of 20 seaports in five countries in Southeast Asia in six years from 2009 to 2014. This research reveals five ports having a dominant position that includes Tan Cang Sai Gon (Vietnam). [11] analyses the competitive position of seaports in North of Vietnam from 2005 to 2014 by applying the Boston Consulting Group matrix. Finally, [12] use SWOT and Porter's Five Forces methods to analyse the strengths, weakness, advantages, and disadvantages of domestic logistics service firms in Hai Phong Port. This study provides some solutions for these companies to develop better logistics operations and enhance global competitiveness.
As mentioned above, there are many studies on Northern and Southern ports of Vietnam, whereas it is hard to find academic literatures on Da Nang Port. There is only [17] that examines the quality of logistics services in Da Nang city. This study shows that Logistics Service Providers in Da Nang city need to improve Research and Development as well as develop Customer Care Programs. Most literatures related to Da Nang Port has been very much derived from technical assistance reports written by international organizations such as ADB, JICA and other donor organizations. These reports summarized the results of projects improving Da Nang Port such as [6], [7], [18]. Data on throughput flows in Da Nang Port are collected regularly (daily, monthly, quarterly, and annually). Managers in Da Nang Port often rely on statistical and descriptive reports on annual throughputs to give the investment plans in equipment, facilities, and infrastructure corresponding to their growth rate. There has been a gap between planning and actual cargo volumes since there is not any forecasting method used in planning in every year for port management in Da Nang Port [19]. One of basic approaches for forecasting is methods of time series analysis.
The time series analysis and forecasting models for sea port are suggested, for instance [20], [21], [22], and [23]. [20] forecasts the throughput flows in Hong Kong by estimating a co-integrated error correction model while [21] uses time series quarterly data between 1975 and 1998 to forecast the general cargo in Spanish ports. In addition, [22] uses the regression modelling to forecast the container traffic of Port of Rijeka whereas [23] analyses the evolutions of container flows through Vietnamese ports by applying Autoregressive Integrated Moving Average (ARIMA).
There are many methods of time series analysis for forecasting such as: spectral analysis, exponential smoothing, ARIMA modelling, Box-Tao modelling, and regression modelling. However, there is no unique or optimal method to forecast since each port and each type of cargo has its particularity. Furthermore, [24] emphasises that it is not necessary that the most sophisticated methods provide forecasting values more accurate than those of simple methods. Thus, we use regression modelling, a well-known forecasting method, to predict the trend-cycle components of throughput flows in Da Nang Port.
2.2. General overview of Da Nang Port
Da Nang Port is located at 16017′33′North latitude, 108020′30′ East latitude. Its pilot station is 16010′ North latitude and 108011′East latitude. It is located in semidiurnal tidal fluctuations which
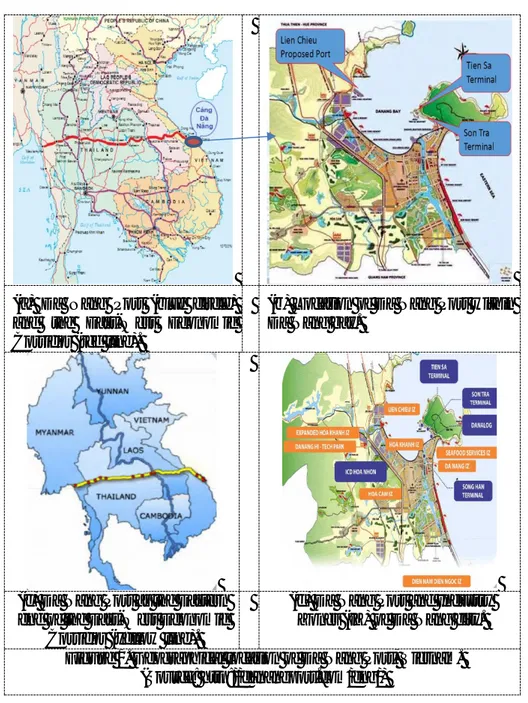
usually average 0.9 meters. Da Nang Port is the cargo gateway of Central Vietnam and plays an important role in the Vietnamese port system. Figure 1 describes the geographical location of Da Nang Port and its advantages on geography. Da Nang Port Company is officially operated as a joint stock company since July 25, 2014. Its business lines are loading and unloading of goods; storage service; service lease; tugging; supporting ships at the port; road and sea transportation; repairing of other
1234567890 ‘’“”
CUTE 2018 IOP Publishing
IOP Conf. Series: Earth and Environmental Science 143 (2018) 012073 doi :10.1088/1755-1315/143/1/012073
means of transport; other maritime services. At present, Da Nang Port has two companies including Tien Sa Port Enterprise and Da Nang Port Logistics Joint Stock Company. Port operation and logistics services are taking place mainly in Tien Sa terminal, one of the three terminals, the others being Han river and Son Tra terminals [4].
(a) Da Nang Port (blue circle)
and the East-West Economic Corridor (red line).
(b) Location of Da Nang Port within Da Nang bay.
(c) Da Nang Port as the Eastern
end of the East-West Economic Corridor (yellow line).
(d) Da Nang Port and Industry
Zones (IZ) of Da Nang city.
Figure 1. Geographical location of Da Nang Port, Vietnam.
(Source: http://danangport.com/eng/)
Tien Sa terminal is a natural deep sea port located in Da Nang Bay. It accommodates big vessels from 35,000 to 50,000 Deadweight tons (DWT) and other specialized ships such as RORO ships, container ships, large and medium-sized passenger ships, super-length and super-weight cargo ships. Furthermore, Tien Sa terminal has total length of the berth of 1,193 metres and depth of the berth of 10-12 metres. The capacity of Tien Sa terminal is as follows: cargo ships from 35,000 to 50,000 DWT, throughput capacity of 8 million tonnes/year. It is expected to be 12 million tonnes/year in 2020. Tien Sa terminal has its space area of 229,414 square metres, its total warehouse area of 14,285 square meters, and its total yard area of 178,603 square metres. While Tien Sa Port Enterprise has big yards and warehouses, Da Nang Port Logistics Joint Stock Company has a modest yards and warehouses. It has space area of 51,037 square metres, total warehouses area of 12,225 square metres, and total yard area of 35,017 square metres . The equipment’s capacity of Da Nang port is described in Table 1 [4].
1234567890 ‘’“”
CUTE 2018 IOP Publishing
IOP Conf. Series: Earth and Environmental Science 143 (2018) 012073 doi :10.1088/1755-1315/143/1/012073
Table 1. Equipment’s capacity of Da Nang Port.
Equipment Quantity(Units) Capacity Quayside gantry cranes exclusively used to
3 36 tonnes load and unload containers at the Gantry
Tyred gantry cranes (RTG) exclusively used
4 36-40 tonnes to load and unload containers at the yard
Fixed gantry cranes (Liebherr) 2 40 tonnes
Fixed gantry cranes (Liebherr) 2 25 tonnes
Forklift truck exclusively used
5 42-45 tonnes to load and unload containers
Wood scraper 2 5 tonnes
Automobile cranes 25 25-80 tonnes
Lifting trucks, excavators, bulldozers all kinds 24 1.5-7 tonnes Tractor trucks, dump trucks, trailers 66
Tugboat 7 500 -1,700 cv
Electronic scale 4
Power supply system for refrigerated container all
kinds 3
(Source: http://danangport.com/eng/)
3. The current status of port operation in Da Nang port
The port operation is expressed by total cargo volumes passed through the port. Data on throughputs are provided by the sales and marketing department, Da Nang Port Joint Stock Company. At the present, the cargo volumes passed through Da Nang Port are divided into four kinds including domestic exports, foreign exports, domestic imports and foreign imports. Domestic exports are exported goods passed through Da Nang Port to other areas in the Vietnam's territory. Foreign exports are exported goods passed through Da Nang Port to other areas outside the Vietnam's territory. Domestic imports are imported goods passed through Da Nang Port from other areas in the Vietnam's territory. Foreign imports are imported goods passed through Da Nang Port from other areas outside the Vietnam's territory. These definitions are used in the statistical reports of Da Nang Port [19]. Considering the structure of cargo source, cargo volumes passed through Da Nang Port are divided into two main categories including container and general cargo. Based on the commodity classification of Vitranss2 [25] (Commodity classification is presented in appendix), general cargo volume passed through Da Nang Port includes commodity groups as follows: food, wood, steel products, building materials, cement, fertilizer, coal, and manufactured goods.
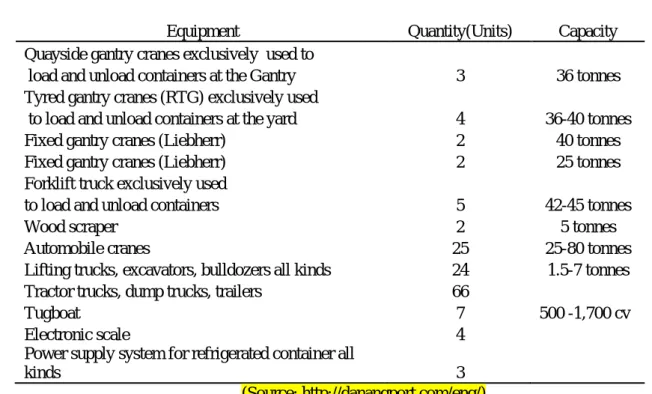
According to statistics from Da Nang Port, there was a significant increase in annual cargo volumes passed through Da Nang Port from 2012 to 2016. The throughput in 2016 was 7,255,000 tonnes, 64% higher than throughput in 2012 [19]. In the table 2, it can be seen that the average growth rate of total throughputs was 13.3% in the period (2012-2016) and the annual volumes of foreign import, domestic import, foreign export, and domestic export increased significantly from 2012 to 2016. The domestic export had the highest average growth rate in the period (2012-2016) of 48.4%, followed by foreign import, foreign export, and domestic import with their average growth rates of 26%, 8.7%, and 5.3%, respectively.
Table 2. Annual cargo volume passed through Da Nang Port from 2012 to 2016. Kinds of throughputs
(tonnes) 2012 2013 2014 2015 2016
Average period
1234567890 ‘’“”
CUTE 2018 IOP Publishing
IOP Conf. Series: Earth and Environmental Science 143 (2018) 012073 doi :10.1088/1755-1315/143/1/012073
1,000,000 2,000,000 3,000,000 4,000,000 5,000,000 6,000,000 7,000,000 8,000,000 2011 2012 2013 2014 2015 2016 C ar go v o lu m e ( to n n e s) Year
Container General cargo Total
(2012-16)
I. Foreign import 908,767 1,345,060 1,576,963 1,901,601 2,249,948 26.0
II. Domestic import 1,287,096 1,005,176 1,414,038 1,142,963 1,388,065 5.3
III. Foreign export 1,990,236 2,361,018 2,285,033 2,421,946 2,749,704 8.7
IV. Domestic export 237,289 298,984 746,011 939,490 867,283 48.5
Total cargo volumes 4,423,388 5,010,238 6,022,045 6,404,000 7,255,000 13.3
(Source: Statistics of Da Nang Port)
Regarding the container and general cargo volumes, there was a steady increase in annual general cargo volume passed through Da Nang Port between 2,267,323 tonnes in 2011 and 2,793,844 tonnes in 2016. Meanwhile, the trend of container volume shot up from 1,601,222 tonnes in 2011 to 4,461,156 tonnes in 2016. Figure 2 depicted the tendencies of the container and general cargo volumes passed through Da Nang Port over the years. It is clearly shown that the share of container volumes was lower than the share of general cargo volumes from 2011 to 2013. However, it was higher than the share of general cargo volume since 2014.
Figure 2. The tendencies of general cargo and container volumes passed through Da Nang
Port from 2011 to 2016. (Source: Statistics of Da Nang port)
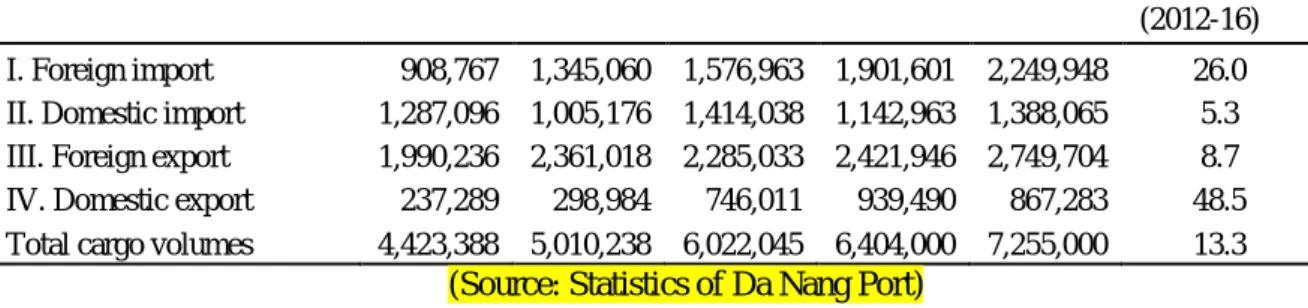
Turning the annual cargo volumes by commodity group passed through Da Nang Port, container always had the highest value and a significant increase in total annual cargo volumes between 2012 and 2016. Table 3 illustrated the percentages of annual general cargo volumes by commodity group passed through Da Nang Port in the period (2012-2016); in addition the percentage of each commodity group at each year was illustrated. The wood group occupied from 24.58% to 30.91% between 2012 and 2016 that explained the highest percentages in total general cargo, whereas manufactured goods group explained the lowest proportions between 0.44% and 0.39% in the same period. The steel products group occupied the second important percentages ranging from 18.65% to 26.36% through years, followed by building materials group from 32.14% to 26.03%. The remaining groups such as
1234567890 ‘’“”
CUTE 2018 IOP Publishing
IOP Conf. Series: Earth and Environmental Science 143 (2018) 012073 doi :10.1088/1755-1315/143/1/012073
cement, fertilizer, food and coal explained relatively small proportions, less than 10% of total general cargo volumes passed through Da Nang Port between 2012 and 2016.
In summary, Da Nang Port throughputs especially container had a significantly increased tendency during the period (2012-2016). To understand the development of port operation in the respective details, we will present data and methodology of research objectives in Section 4 and the results in Section 5 and some discussions and conclusions in Section 6.
Table 3. The percentages of annual general cargo volumes from 2012 to 2016.
Commodity group
The percentages of general cargo volumes by commodity group (%)
2012 2013 2014 2015 2016 Wood 24.58 37.46 31.48 29.56 30.91 Steel product 18.65 25.23 25.17 26.81 26.36 Building materials 32.14 20.24 25.88 25.47 26.03 Fertilizer 4.38 3.43 2.35 7.62 8.55 Food 5.52 4.35 4.04 2.04 2.10 Coal 6.53 4.91 9.04 6.13 4.17 Cement 7.76 3.70 1.78 2.05 1.50 Manufactured goods 0.44 0.25 0.25 0.32 0.39
Total general cargo 100 100 100 100 100
(Source: Statistics of Da Nang port)
4. Data and Methodology
To better understand the basic characteristics of throughput time series data, we use the classical time series decomposition method to find trend-cycle and seasonal components of monthly throughput time series data. Based on the results of the decomposition, appropriate forecasting models of the different kinds of throughputs are provided. In this section, we present data description in Subsection 4.1 and methodology in Subsection 4.2.
4.1. Data Description
The monthly throughput data from January 2012 to December 2016 are used to analyse time series decomposition. Like the classification of cargo volumes passed through Da Nang Port presented in Section 3, there are four main types of throughputs including Domestic Exports, Foreign Exports, Domestic Imports, Foreign Imports. Each type of throughputs is divided into two categories including container and general cargo. For example, Domestic Exports is divided into two kinds including ContainerDomesticExports and GeneralCargoDomesticExports. They are based on the throughput’s classification of Sales & Marketing Department, Da Nang Port [19]. With such above throughput classification, we use 12-time series data given in Table 4 to analyse time series decomposition.
Table 4. Research Objectives and their definitions. Ordered
Objectives Definition
number
1 ContainerForeignImport The foreign imports passed through Da Nang Port are container 2 GeneralCargoForeignImport The foreign imports passed through Da Nang Port are general cargo 3 TotalForeignImport Total foreign imports passed through Da Nang Port
4 ContainerDomesticImport The domestic imports passed through Da Nang Port are container 5 GeneralCargoDomesticImport The domestic imports passed through Da Nang Port are general cargo 6 TotalDomesticImport Total domestic imports passed through Da Nang Port
7 ContainerForeignExport The foreign exports passed through Da Nang Port are container 8 GeneralCargoForeignExport The foreign exports passed through Da Nang Port are general cargo 9 TotalForeignExport Total foreign exports passed through Da Nang Port
1234567890 ‘’“”
CUTE 2018 IOP Publishing
IOP Conf. Series: Earth and Environmental Science 143 (2018) 012073 doi :10.1088/1755-1315/143/1/012073
11 GeneralCargoDomesticExport The domestic exports passed through Da Nang Port are general cargo 12 TotalDomesticExport Total domestic exports passed through Da Nang Port
(Source: Statistics of Da Nang Port)
4.2. Methodology
The technique for analysing monthly throughputs of the port is classical time series decomposition method. This method is developed in [26] and is described, for example, in [27]. A time series data can be broken down into separated components which are trend, cyclical, seasonal, and residual components. The trend component describes the long-term change in time series data. The cyclical component reflects the change in time series data that are a repeated change according to the business cycle. The seasonal component describes the change in time series data that depends on seasonal factors. The random component denotes the change in time series data that depends on random or irregular factors. It represents the residuals or the remainder of time series after other components have been removed from the time series data. The general form of decomposition technique is written as follows:
𝑌𝑖 = 𝑓(𝑇𝑖,𝑆𝑖, 𝑒𝑖) (1)
where 𝑌𝑖 is the time series (or observation) at time i; 𝑇𝑖 is the trend-cycle component at time i; 𝑆𝑖 is the
seasonal component at time i; 𝑒𝑖 is the error (or residual) at time i.
Equation (1) is represented in two different forms, that are multiplicative and additive decompositions. The multiplicative decomposition is described as follows:
𝑌𝑖 = 𝑇𝑖∗ 𝑆𝑖∗ 𝑒𝑖 (2)
The additive decomposition is expressed as follows:
𝑌𝑖 = 𝑇𝑖+ 𝑆𝑖+ 𝑒𝑖 (3)
The additive decomposition is used as seasonal variations do not change in level along the series. On the contrary, if the level of seasonal variations changes as the series goes, the multiplicative decomposition is preferred.
There are three steps to split an original time series data into separated components in both the multiplicative and additive decompositions as follows:
Step 1- Calculating trend-cycle component: By applying a moving average method to the original data, the trend-cycle component in time series data is identified. If the number of observations is odd, m-MA smoother is used to obtain 𝑇𝑖. Otherwise, the trend-cycle component 𝑇𝑖 is computed by using 2
x m-MA.
Step 2- Computing seasonal component: Firstly, the detrended series is calculated. It equals 𝑌𝑖
𝑇𝑖 in the multiplicative decomposition and is equivalent to (𝑌𝑖− 𝑇𝑖) in the additive decomposition. The
seasonal indicator for a specific season is determined by taking the average of detrended values in the same time period. The seasonal time series can be obtained by repeating the seasonal index for the same periods in time series. This seasonal time series is denoted as 𝑆𝑖.
Step 3- Calculating irregular component: After the trend-cycle and seasonal components are determined, the irregular component is calculated as 𝑒𝑖=
𝑌𝑖
𝑇𝑖∗𝑆𝑖 in the multiplicative decomposition and 𝑒𝑖 = 𝑌𝑖− 𝑇𝑖− 𝑆𝑖 in the additive decomposition.
5. Results
5.1. Results of decomposition method
Figures 3, 4, 5 illustrate the trends of container, general cargo, total throughput of draw data from January 2012 to December 2016. Magnitude of the seasonal patterns in these graphs are not so obvious that we tried to use both additive and multiplicative decompositions for separating time series data of throughput flows and choose the one with smaller forecast error such as using MAPE (Mean Absolute Percentage Error).
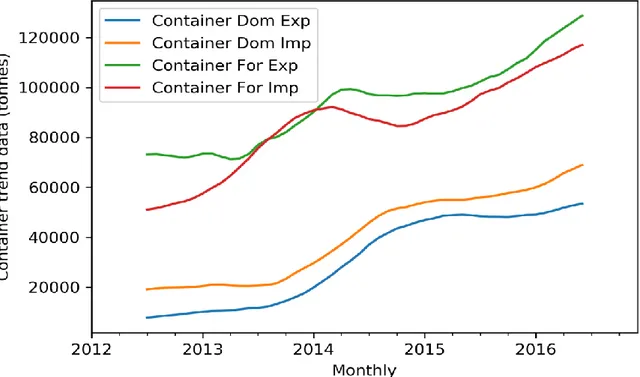
The tendencies of the trend-cycle component of the container, general cargo, and total throughput are shown in Figures 6, 7, and 8 by applying the moving average method to the original data. After the
1234567890 ‘’“”
CUTE 2018 IOP Publishing
IOP Conf. Series: Earth and Environmental Science 143 (2018) 012073 doi :10.1088/1755-1315/143/1/012073
moving average, the data for the first 6 months of 2012 and the last 6 months of 2016 are the missing values. Thus, the trends of the trend-cycle component of throughput flows are illustrated from July 2012 to June 2016. Their seasonal indexes by multiplicative and additive decompositions are described in Tables 5 and 6. The seasonal indexes of the multiplicative decomposition revolves around the value 1 while those of additive decomposition revolves around the value 0.
Figure 3. Raw data of monthly container throughputs from January 2012 to December 2016
1234567890 ‘’“”
CUTE 2018 IOP Publishing
IOP Conf. Series: Earth and Environmental Science 143 (2018) 012073 doi :10.1088/1755-1315/143/1/012073
Figure 5. Raw data of monthly total throughputs from January 2012 to December 2016
1234567890 ‘’“”
CUTE 2018 IOP Publishing
IOP Conf. Series: Earth and Environmental Science 143 (2018) 012073 doi :10.1088/1755-1315/143/1/012073
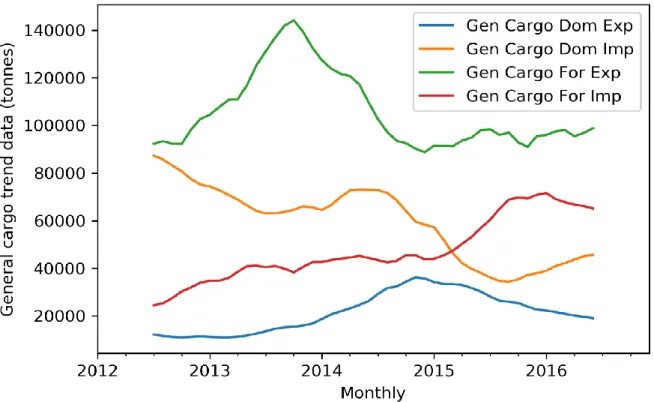
Figure 7. Trend data of monthly general cargo throughputs from July 2012 to June 2016
Figure 8. Trend data of monthly total throughputs from July 2012 to June 2016 Table 5. Seasonal indexes by multiplicative decomposition.
1234567890 ‘’“”
CUTE 2018 IOP Publishing
IOP Conf. Series: Earth and Environmental Science 143 (2018) 012073 doi :10.1088/1755-1315/143/1/012073
Objectives
Seasonal indexes (Multiplicative)
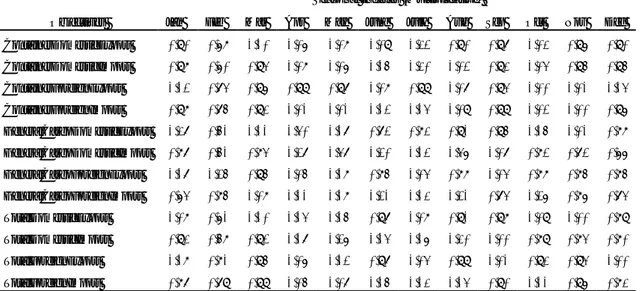
Jan Feb Mar Apr May June July Aug Sep Oct Nov Dec ContainerDomesticExport 0.90 0.68 1.10 1.06 1.08 1.09 1.32 0.90 0.97 1.03 0.96 0.90 ContainerDomesticImport 0.98 0.60 0.94 1.08 1.06 1.15 1.30 1.02 0.93 1.04 0.95 0.95 ContainerForeignExport 1.12 0.74 0.96 0.99 0.97 1.08 0.99 1.07 0.94 1.00 1.01 1.14 ContainerForeignImport 0.98 0.75 0.93 1.01 1.01 1.12 1.14 1.09 0.99 1.02 1.00 0.96 GeneralCargoDomesticExport 1.37 0.51 1.11 1.40 1.17 0.72 0.83 0.91 0.95 1.15 1.01 0.88 GeneralCargoDomesticImport 0.87 0.51 0.84 1.27 1.47 1.20 1.12 1.46 1.07 0.82 0.72 0.66 GeneralCargoForeignExport 1.17 1.25 0.95 1.05 1.18 0.85 1.04 0.88 1.04 0.88 0.85 0.85 GeneralCargoForeignImport 0.64 0.85 1.08 1.11 1.18 1.21 1.13 1.21 0.74 1.26 0.86 0.74 TotalDomesticExport 1.08 0.61 1.10 1.14 1.15 0.97 1.08 0.91 0.98 1.09 1.00 0.89 TotalDomesticImport 0.93 0.58 0.92 1.17 1.26 1.14 1.16 1.30 1.00 0.89 0.84 0.80 TotalForeignExport 1.18 0.81 0.95 1.06 1.12 0.97 1.04 0.99 1.01 0.93 0.94 1.00 TotalForeignImport 0.87 0.79 0.99 1.05 1.07 1.15 1.13 1.14 0.90 1.11 0.96 0.83
Table 6. Seasonal indexes by additive decomposition.
5.2. Forecasting method and results
For predicting purpose, all data of the throughput flows including container, general cargo and total throughput are divided into initialization sets and test sets. The initialization sets include the sets of data between July 2012 and June 2015, which are used to find suitable models and parameters for the observations of study objectives. The evaluation of initialization sets is meaningful in finding the best models fitting observations. The selected models will be run on the test sets of the throughput flows for the last 12 months from July 2015 to June 2016. The evaluation of test sets denotes the accuracy and confidence of chosen models.
Jan Feb Mar Apr May June July Aug Sep Oct Nov Dec
ContainerDomesticExport -418 -9305 2998 -1122 83 2537 7021 -1894 1447 463 -141 -1668 ContainerDomesticImport 740 -15341 -1465 2146 2434 5321 8853 1597 -2755 104 -1027 -605 ContainerForeignExport 11865 -25555 -5276 250 -2267 8493 224 7001 -5407 -519 -426 11617 ContainerForeignImport -302 -22087 -7001 2748 473 12144 11250 6089 -1565 547 -145 -2153 GeneralCargoDomesticExport 12548 -9946 297 9603 1551 -7160 -2929 -1648 -2174 2182 -410 -1914 GeneralCargoDomesticImport -7236 -26818 -6442 15125 24465 5689 6677 28570 3761 -9886 -14711 -19193 GeneralCargoForeignExport 20150 25720 -6562 6350 21525 -16992 3550 -11649 1803 -17663 -12418 -13815 GeneralCargoForeignImport -18169 -3160 1458 6166 6990 10019 1054 8069 -10436 16178 -5447 -12723 TotalDomesticExport 12130 -19251 3295 8480 1633 -4622 4092 -3542 -727 2645 -551 -3582 TotalDomesticImport -6497 -42159 -7908 17271 26899 11009 15530 30167 1006 -9782 -15739 -19798 TotalForeignExport 35477 -37913 -8377 10061 22720 -5037 7235 -1186 -142 -14720 -9381 1264 TotalForeignImport -17842 -24617 -4914 9543 8092 22792 12934 14787 -11372 17354 -4963 -21794
Seasonal indexes (Additive) Objectives
1234567890 ‘’“”
CUTE 2018 IOP Publishing
IOP Conf. Series: Earth and Environmental Science 143 (2018) 012073 doi :10.1088/1755-1315/143/1/012073
5.2.1. Trend- Cycle Forecasting
The general method of using the decomposition techniques in predicting the time series data of the throughput flows is to predict each factor (including the trend-cycle and the seasonal factors) into the future. Forecasting the seasonal component is not difficult since the seasonal indicators are constant over a certain time period. Thus, seasonal indexes in Tables 5 and 6 are repeated to produce forecasting values of the seasonal factor that corresponds to each decomposition method. However, the prediction of the trend-cycle factor is more complex. A common method for predicting trend-cycle factor is the parametric trend model, which is a method of finding the appropriate mathematical model to fit observations.
In this paper, we test the first, second and third degrees of polynomials on the initialization sets of trend-cycle data of throughput flows. We then use the selected models to run on the test sets of the trend-cycle data. There are two criteria for selecting the appropriate model, which are the a high coefficient of determination (R2) on the initialization set and the small mean absolute percent error
(MAPE) on the test set. Table 7 presents the results of the R-square of the first, second and third degrees of polynomials on the initialization sets and the MAPE of these model on the test sets of the trend-cycle data. The results shows that using the first-order models are the most appropriate for the trend-cycle data of container. In addition, the third degree of polynomials are the best models for the trend cycle data of general cargo and total throughput except GeneralCargoDomesticImport used by the first degree of polynomial. Table 8 illustrates the results of the selected mathematical models for the trend-cycle data of the studied objectives.
Table 7. The results of R2 and MAPE of the first, second, and third degrees of polynomials.
Objectives
Order 1 Order 2 Order 3
R-square MAPE (%) R-square MAPE (%) R-square MAPE (%)
ContainerDomesticExport 0.92 19.50 0.96 49.78 0.98 10.77 ContainerDomesticImport 0.90 7.68 0.94 30.55 0.98 20.68 ContainerForeignExport 0.87 4.10 0.87 6.70 0.95 36.70 ContainerForeignImport 0.77 1.85 0.92 24.76 0.92 24.41 GeneralCargoDomesticExport 0.88 83.88 0.89 107.97 0.97 38.04 GeneralCargoDomesticImport 0.65 20.08 0.67 21.61 0.94 173.34 GeneralCargoForeignExport 0.05 4.22 0.63 63.18 0.75 11.56 GeneralCargoForeignImport 0.84 17.74 0.87 26.19 0.96 16.54 TotalDomesticExport 0.91 38.82 0.94 67.11 0.98 18.16 TotalDomesticImport 0.16 10.95 0.17 16.13 0.84 80.95 TotalForeignExport 0.20 3.40 0.67 24.59 0.76 2.91 TotalForeignImport 0.87 6.90 0.95 23.55 0.96 10.39
(The bold numbers showed the better results of R-square and MAPE than those of other models)
Table 8. The results of the selected mathematical models using for trend-cycle forecasting of the study
objective.
Objectives Models R2 MAPE (%)
ContainerDomesticExport 0.92 19.50 ContainerDomesticImport 0.90 7.68 ContainerForeignExport 0.87 4.10 ContainerForeignImport 0.77 1.85 GeneralCargoDomesticExport 0.97 38.04 1439𝑡 − 1506 1310𝑡 + 9895 1026𝑡 + 67500 1238𝑡 + 54953 −3𝑡3+ 177𝑡2− 2047t +16253
1234567890 ‘’“”
CUTE 2018 IOP Publishing
IOP Conf. Series: Earth and Environmental Science 143 (2018) 012073 doi :10.1088/1755-1315/143/1/012073
GeneralCargoDomesticImport 0.65 20.08 GeneralCargoForeignExport 0.75 11.56 GeneralCargoForeignImport 0.96 16.54 TotalDomesticExport 0.98 18.16 TotalDomesticImport 0.84 80.95 TotalForeignExport 0.76 2.91 TotalForeignImport 0.96 10.39 5.2.2. Forecasting results
When the predictions of trend and cycle component are obtained, they are put back in the decomposition model in equation (2) (for the multiplicative model) and in equation (3) (for the additive model). They will be composed of the seasonal indicators presented in Table 5 (for the multiplicative model) and in Table 6 (for the additive model) to create forecasting values. The predicting values for monthly throughputs are computed as 𝑌̂ = 𝑇𝑡 ̂ ∗ 𝑆𝑡 ̂ in the multiplicative 𝑡
decomposition and 𝑌̂ = 𝑇𝑡 ̂ + 𝑆𝑡 ̂ in the additive decomposition. 𝑡
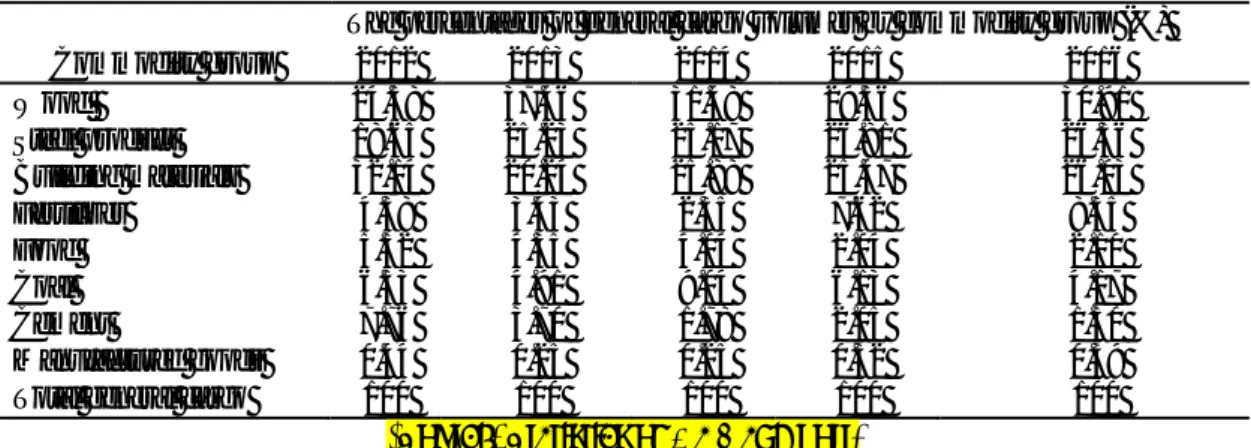
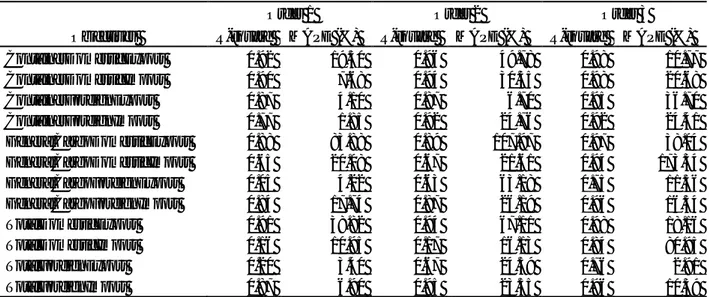
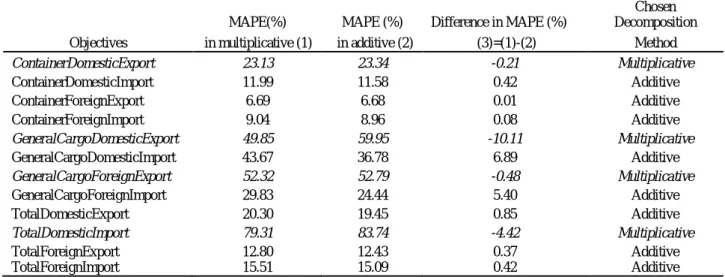
The forecasting models are run on test sets of study objectives from July 2015 to June 2016. The results of MAPE by multiplicative and additive decompositions are presented in Table 9. The MAPE values of forecasting results by additive method are lower than those of multiplicative method in most time series data. It is a clear evidence to determine which decomposition method for each time series data. Table 9 also presents the results of selecting the best decomposition models for time series data of throughput flows. The additive models are preferred for most time series data apart from ContainerDomesticExport, GeneralCargoDomesticExport, GeneralCargoForeignExport, and TotalDomesticImport used in multiplicative models.
Table 9. The results of selecting the best decomposition models for time series data of study
objectives
Based on the results of Table 9, the seasonally adjusted graphs of monthly throughputs of the container, general cargo and total throughput are plotted in Figures 9, 10, and 11. After removing the seasonal component from monthly throughput time series data, the container and total throughputs have significantly increase tendencies whereas those of general cargo volumes are not obvious.
Objectives
MAPE(%) MAPE (%) Difference in MAPE (%)
Chosen Decomposition in multiplicative (1) in additive (2) (3)=(1)-(2) Method
ContainerDomesticExport 23.13 23.34 -0.21 Multiplicative ContainerDomesticImport 11.99 11.58 0.42 Additive ContainerForeignExport 6.69 6.68 0.01 Additive ContainerForeignImport 9.04 8.96 0.08 Additive GeneralCargoDomesticExport 49.85 59.95 -10.11 Multiplicative GeneralCargoDomesticImport 43.67 36.78 6.89 Additive GeneralCargoForeignExport 52.32 52.79 -0.48 Multiplicative GeneralCargoForeignImport 29.83 24.44 5.40 Additive TotalDomesticExport 20.30 19.45 0.85 Additive TotalDomesticImport 79.31 83.74 -4.42 Multiplicative TotalForeignExport 12.80 12.43 0.37 Additive TotalForeignImport 15.51 15.09 0.42 Additive −893𝑡 + 82687 7𝑡3− 514𝑡2+ 10300t + 65374 2.4𝑡3− 144𝑡2+ 3034t +20074 −5.8𝑡3+ 363𝑡2− 4107t +29842 −10𝑡3+ 570𝑡2− 8397t +122917 5𝑡3− 356𝑡2+ 8092t +144026 2𝑡3− 191𝑡2+ 6060t +62696
1234567890 ‘’“”
CUTE 2018 IOP Publishing
IOP Conf. Series: Earth and Environmental Science 143 (2018) 012073 doi :10.1088/1755-1315/143/1/012073
Figure 9. Seasonal-adjusted data of container from January 2012 to December 2016
1234567890 ‘’“”
CUTE 2018 IOP Publishing
IOP Conf. Series: Earth and Environmental Science 143 (2018) 012073 doi :10.1088/1755-1315/143/1/012073
Figure 11. Seasonal-adjusted data of total throughputs from January 2012 to December 2016
6. Discussions and conclusions
6.1. Discussions
The results in Figure 6 and Table 8 show that container flows increase as first-order linear functions having positive and large slopes. Based on these predictive models, we can conclude that the volumes of containerized cargoes will rise significantly both in the growth rate and the magnitude of growth.
For the general cargo, Figure 7 and Table 8 describes the tendencies and models of its flows. The trend-cycle data of general cargo flows vary chaotically so that third-order polynomials are used to model their observations. In general, the growth trends of general cargo flows are unclear.
For total throughput flows, their trend-cycle components are the sum of those of the container and general cargo flows. As presented in Figure 8 and Table 8, the trend-cycle data of total throughput flows generally increase through time.
More interestingly, we have the tendencies of seasonal-adjusted time series data of throughput flows in Da Nang Port. Eliminating the seasonal component from the time series helps us judge the growth prospects of the container, general cargo, and total throughput flows in the long run. Figures 9, 10, and 11 show the seasonal-adjusted data of the container, general cargo, and total throughput flows, respectively. The seasonal-adjusted data of the container flows increase considerably over time, whereas those of the general cargo flows exhibit no clear trend. Finally, there is a steady increase in the seasonal-adjusted total throughput flows in Da Nang Port.
Based on the above discussions on the growth prospects of throughput flows, we provide some policy implications for the development of port operation in Da Nang Port. First, in terms of the development strategy, Da Nang Port should be towards containerization since the tendencies of container flows will increase rapidly in both the growth rate and the magnitude of growth. Second, managers in Da Nang Port should pay attention to the current status of facilities, equipment, and infrastructure. From this current status, there should be more investment in them to meet the growing
1234567890 ‘’“”
CUTE 2018 IOP Publishing
IOP Conf. Series: Earth and Environmental Science 143 (2018) 012073 doi :10.1088/1755-1315/143/1/012073
demand of throughputs, especially for container. In addition, Da Nang Port should maintain general cargo flows although their growth tendencies are mixed up since these types of cargoes meet the consumer demand of Central Region of Vietnam.
6.2. Conclusions
This paper presents the current status of port operation in Da Nang Port. Through the analysis of monthly throughputs, the picture of the operating status in Da Nang Port between 2012 and 2016 becomes clear. The cargo volumes passed through Da Nang port exhibits a dramatically increased trend, particularly in terms of containerized cargoes. Furthermore, the decomposition of monthly throughput time series into trend–cycle and seasonal factors provides appropriate predictive models of container, general cargo, and total throughput flows. In terms of policy implications, this study suggests that the development of Da Nang port should be towards containerization and focus on improving its operation capacity by the investments in facilities, equipment, and infrastructure.
Appendix - Commodity Classification Commodity
code Commodity group Name of commodity
1 Food Rice, cereals, wheat
2 Sugarcane Sugarcane to be refined to produce candy, cake, and sugar 3 Wood Wood to produce joinery and paper
4 Industrial plants Industrial plants such as coffee, tea, rubber, pepper, bean..
5 Sea food Various types of seafood being cached naturally and raised in the farm 6 Meat cattle Pigs, cattle and poultry
7 Steel products Type of steels including steel plate 8 Building
materials Stone, gravel, sand, brick, tile
9 Cement cement
10 Fertilizer Nitrogenous fertilizer and animal feeding
11 Coal Coal as fuel for fertilizer industry, electricity and other industries 12 Petroleum
products Materials derived from crude oil (petroleum) as it is processed in oil refineries excluding petroleum
13 Manufactured
goods Equipment, machinery, chemicals, consumer goods…packed in containers or bulk goods
References
[1] General Statistics Office of Vietnam 2016 Reports of Maritime Economy. [2] Resolution 09-NQ / TW 2007 Vietnamese Sea Strategies until 2020. [3] Vietnam Seaports Association 2017 Reports of ports of Vietnam. [4] Da Nang port’s web (http://danangport.com/eng/).
[5] Nguyen Huu Sia 2016 Workshop Cooperation in developing logistics system and center in the central Vietnam Key Economic Region, Da Nang city.
[6] ADB 2008 Transport and Trade facilitation in the Greater Mekong sub region Time to shift Gears- Evaluation study (https://www.oecd.org/countries/mongolia/42228102.pdf).
[7] Japan International Cooperation Agency 2014 The Study for Tien Sa - Da Nang Port Improvement Project (http://open_jicareport.jica.go.jp/pdf/12250627.pdf).
[8] Nguyen L C , Notteboom 2016 J of International Logistics and Trade 14(1) 65-88. [9] Dang V L, Yeo G T 2003 J of the Eastern Asia Society for Transportation Studies, 5. [10] Nguyen L C, Notteboom 2016 The Asian J of Shipping and Logistics 32 23-32.
[11] Pham T Y, Ma H M, Yeo G T 2016 J of Korean Navigation and Port Research 40(5) 311-316. [12] Deng Y L, Deng Y, Li X 2014 How can Domestic Logistics Enterprises Enhance Their
1234567890 ‘’“”
CUTE 2018 IOP Publishing
IOP Conf. Series: Earth and Environmental Science 143 (2018) 012073 doi :10.1088/1755-1315/143/1/012073
[13] Jasmine S L L, Yimiao G 2013 International J of Shipping and Transport Logistics 5(3) 257-281.
[14] Saeyeon R, Vinh V T, Yiik D W 2016 The Asian J of Shipping and Logistics, 32(2), 107-118. [15] Vinh V T , Devinder G 2005 Asia Pacific J of Marketing and Logistics, 17 (1) 3-31.
[16] Ngoc-Hien D, Ki-Chan N, Quynh-Lam N L 2011 The flagship J of international shipping and
port research 38(1) 1-9.
[17] Limbourg S, Ho T Q G, Cools M 2016 Proc. Engineering Conf. on Sustainable Development in
Civil, Urban, and Transportation Engineering (Ho Chi Minh City) vol 1 p124-130.
[18] Japan International Cooperation Agency 2009 Ex-Post Evaluation of Japanese ODA Loan Project "Da Nang Port Improvement Project" (http://open_jicareport.jica.go.jp/pdf/12033940.pdf).
[19] Sales & Marketing Department of Da Nang Port Joint Stock Company 2017 Statistics of Da Nang port.
[20] Hui E C, Seabrooke W and Wong G K 2004 J. Urban Planning and Development 130(4) 195– 203.
[21] Coto-Millán P, Baños-Pino J, Sainz-González R, Pesquera-González et al 2011 Maritime
Economics & Logistics 13(3)237–249.
[22] Alen J, Svjetlana H, Tanja Poletan J 2011 Promet - Traffic&Transportation 23.
[23] ThiAnhTam T, Mikio T 2015 J of the Eastern Asia Society for Transportation Studies 11. [24] De Borger B and Nonneman W 1981 J of Transport Economics and Policy 15 155-165.
[25] Japan International Cooperation Agency 2000 The study on the national transport development strategy in the Socialist Republic of Vietnam (VITRANSS) final report : summary http://open_jicareport.jica.go.jp/700/700/700_123_11596749.html.
[26] Macaulay F 1938 The Movements of Interest Rates, Bond Yields and Stock Prices in the United
States National Bureau of Economic Research, New York.
[27] Spyros M, Steven C, Wheelwright et al 1998 Forecasting: Methods and Applications John Wiley and Sons Third edition ISBN 0-471-53233-9.XIV+642pp.
Acknowledgment
The authors thank the officers in Sales & Marketing Department of Da Nang Port Joint Stock Company for providing the data used in this study.