Université du Québec
Institut national de la recherche scientifique Centre Énergie Matériaux Télécommunications
Near Infrared-Emitting Quantum Dots: Synthesis, Characterization
and Biological Applications
Par
Fuqiang Ren
Thèse présentée pour l’obtention du grade de Philosophiæ Doctor (Ph.D.) en Sciences de l’énergie et des matériaux
Jury d’évaluation
Président du jury et Aycan Yurtsever examinateur interne INRS-EMT
Examinateur externe Xiaoxia Zhu
Université de Montréal
Examinateur externe Jean-François Morin Université Laval
Directeur de recherche Dongling Ma
INRS-EMT, Université du Québec
Codirecteur de recherche Fiorenzo Vetrone
INRS-EMT, Université du Québec
I
ABSTRACT
Quantum dots (QDs) have attracted significant attention in many applications due to their unique features, such as size-dependent optical absorption and emission, arising from the quantum confinement effect, which the bulk material does not possess. Among diverse QDs, near infrared (NIR) emitting QDs, such as lead-based QDs, which can be tuned to emit from below 1000 nanometer to several thousand nanometers are particularly interesting. Both their excitation and emission can be easily adjusted to lie within the biological windows, highly desirable for some demanding biological applications. Although the synthesis of NIR QDs with a uniform and narrow size distribution is well known today, achieving QDs with high quantum efficiency and excellent stability is still a big challenge.
QDs are tiny crystalline particles with typical dimensions in the range of 1-100 nm. Their surface-to-volume ratio is very large, therefore the properties of QDs become extremely sensitive to surface characteristics. In order to improve the optical properties of these QDs, great efforts have been made in the past few decades on the surface engineering of QDs. A passivation shell is normally grown over the QDs to form a core/shell structure, which in turn improves the optical properties and stability. In the first part of this thesis, the synthesis and optical properties of PbS/CdS core/shell QDs are presented and discussed. We firstly synthesized a series of differently sized PbS QDs by using the traditional hot injection method, then these PbS QDs were coated with a thin CdS shell to form a PbS/CdS core/shell structure by the cation exchange approach, finally the optical properties of these core/shell QDs
II were studied.
In Section I of Part I, we report the development of a reproducible and controllable microwave-assisted cation exchange approach, for the first time, to quickly synthesize high-quality, NIR emitting PbS/CdS core/shell QDs. These monodisperse QDs, emitting in the range of 1300-1600 nm, show a quantum yield (QY) as high as 57% that is ~1.4 times higher than that of QDs achieved by conventional heating in oil bath. Meanwhile, the reaction was successfully scaled up by several times by increasing the starting PbS concentration or by amplifying the reaction volume and the as-synthesized core/shell QDs show similarly high QY.
We then report anomalous size-dependent photoluminescence (PL) intensity variation of PbS QDs with the formation of a thin CdS shell via the same microwave-assisted cation exchange approach. We found previously that thin shell formation is an effective strategy for increasing the PL intensity of large sized PbS QDs. Nonetheless, herein we observed an unusual PL decrease in ultrasmall QDs upon shell formation. We attempted to understand this abnormal phenomenon from the perspective of trap density variation and the probability of electrons and holes reaching surface defects. To this end, QY and PL lifetime (on the ns-µs time scale) of pristine PbS QDs and PbS/CdS core/shell QDs were measured and radiative and non-radiative recombination rates were derived and compared. Moreover, transient absorption (TA) analysis (on the fs-ns time scale) was performed to better understand exciton dynamics on ultrafast time scales. These experimental results along with theoretical calculations of electron and hole wave functions provide a complete
III
picture of the photophysics governing the core/shell system. Ultimately, a model was constructed to show the energy levels and trap states for various sizes.
Part II focuses on the photostability and colloidal stability of water dispersible PbS/CdS/ZnS core/shell/shell QDs and their potential bio-applications. We report for the first time detailed investigations of the synthesis of NIR, water dispersible, strongly luminescent and highly stable PbS/CdS/ZnS core/shell/shell QDs, their properties in different buffers, their cytotoxicity and further their applications in tumor imaging. In particular, we focus on the QDs emitting at 930 and 1220 nm, within the first and second biological windows, respectively. These QDs were synthesized via our recently developed microwave-assisted approach to grow a ZnS shell and to simultaneously exchange initial ligand with mercaptopropyl acid on the PbS/CdS core/shell QDs dispersed in an organic phase. These QDs were extremely stable in commonly used biological buffers and remarkably, they could keep their initial morphology, dispersion status and PL in phosphate buffered saline buffer (PBS) for as long as 14 months, which was the longest time we investigated with both transmission electron microscopy and PL spectroscopy herein. PL images taken on the 930 nm emitting PbS/CdS/ZnS core/shell/shell QDs revealed that they could still emit strongly after 30-month storage in PBS. Such long term stability of water dispersible QDs is rarely reported in the literature. Their colloidal stability was further investigated by keeping them in high ionic concentration conditions. Their PL intensity did not show any change for at least 3 weeks at high NaCl concentration up to 400 mM. The QDs also showed excellent photostability and could keep about 80%
IV
of their initial PL intensity after 1 hour of continuous, strong UV illumination. More interestingly, they showed negligible toxicity to cultured cells even at high QDs concentration (50 nM). Given these outstanding properties, the ultrastable and biocompatible QDs were explored for the first time for in vivo tumor imaging in mice. With one order of magnitude lower QD concentration (0.04 mg/mL), significantly weaker laser intensity (0.04 W/cm2 vs ~1 W/cm2) and considerably shorter signal integration time (≤ 1 ms vs several hundreds of ms) as compared to the best reported rare earth doped nanoparticles, the QDs showed high emission intensity even at injection depth of ~2.5 mm, hard to achieve with visible QDs and other NIR PL probes.
We developed a QD-based imaging system based on NIR-emitting PbS/CdS/ZnS QDs with minimal noticeable toxicity. Through careful engineering of their emission wavelength, we obtained fluorescence imaging nanoprobes with optimal penetration depths in biological tissue. Additionally, this new platform exhibited multifunctionality beyond their use as pure imaging nanoprobes. The system is capable of acting as a biological nanothermometer, based on the reliable thermal-dependent behavior of the fluorescence signal. The PbS/CdS/ZnS QDs studied here can easily be exploited to obtain thermal mapping of subskin areas in live specimens, an accomplishment of great relevance for early disease detection and also for real-time therapy monitoring. Moreover, as a result of the intense signal provided by the NIR-emitting QDs, we are able to elucidate the real-time biodistribution of the QDs by means of in vivo experiments in live mice. We determined the lack of
V
detectable chemical toxicity attributed to the QDs based on cell culture assays, as well as the lack of adverse health effects (no significant weight changes or behavior abnormalities were found over 4 weeks) for mice injected with a low concentration of QDs, coupled with the absence of any fluorescence signal detected in the body organs at the end of the experiment. We can therefore ascertain that the ZnS outer shell imparts a great deal of bio-compatibility and stability of the PbS/CdS/ZnS QDs reported here. Also, the intense fluorescent emission of this material allows for low doses to be used, significantly improving the current state of the art. This greatly diminishes the likelihood of causing adverse health effects on the live specimen when used as optical bioimaging probes.
VI
ACKNOWLEDGEMENTS
Foremost I would like to express my deepest gratitude to my supervisor Prof. Dongling Ma for the continuous support of my PhD study and research, for her kindness, patience, enthusiasm, and immense knowledge. I learned lots from her. Her endless effort in improving the quality of my research project by giving me suggestions and some novel ideas is quite appreciable.
Beside my supervisor, I would like to acknowledge with much appreciation my co-supervisor Prof. Fiorenzo Vetrone. He continually and persuasively helped me in all the time of research and gave me precious advice.
My supervisors have created a warm and stimulating research environment allowing me explore a complex and fascinating scientific field. Being able to study under their supervision is one of the most valuable experience in my life.
I thank Prof. Jinzhong Zhang, Prof. François Vidal, Prof. Daniel Jaque, Prof. John Oh and Prof. Xinyu Liu for their important comments during my project research. I want to acknowledge the contributions to this work made by Dr. Haiguang Zhao, Dr. Antonio Benayas and Dr. Marta Quintanilla, who gave me invaluable help and collaboration. I gratefully acknowledge my collaborators, Dr. Sarah A. Lindley, Dr. Elisa Carrasco, Dr. Vicente Marzal, Dr. Blanca del Rosal, Soyoung An. Thanks to all the group members for their help throughout the work. I am grateful to have been part of such supportive, hardworking, and inspiring groups. These people include Belete Atomsa Gonfa, Long Tan, Fan Yang, Zhenghe Xu, Mee Rahn Kim and Yanlong Liu. I thank the departmental and technical staff at INRS-EMT.
VII
I would like to thank Jean-Philippe Masse at Ecole Polytechnique for the transmission electron microscopy measurements.
I am eternally grateful to my parents, who have been a constant source of love. I would like to thank my wife, Qian Li, who loves me deeply and supports me selflessly. I want to tell them, I love you. I thank my family and my friends for their continuing love and heartily support.
Finally, I wish to acknowledge the following organizations for their financial support: Fonds de recherche du québec nature et technologies for PhD Program and the Natural Sciences and Engineering Research Council of Canada.
VIII
CONTENTS
CHAPTER 1 INTRODUCTION………....1
1.1 Quantum dots and their basic properties……….1
1.2 Near-infrared quantum dots and their applications……….3
1.3 PbS quantum dots………...6
1.4 Core shell quantum dots and their advantages………8
1.5 Bio-applications of lead based quantum dots………12
1.6 Thesis objectives………...14
1.7 Thesis organization………..…..15
CHAPTER 2 EXPERIMENTAL...17
2.1 Materials……….17
2.2 Reaction setup………17
2.3 Synthesis of lead based quantum dots………...18
2.3.1 Synthesis of PbS and PbS/CdS quantum dots in the organic phase…………18
2.3.1.1 Synthesis of smaller PbS quantum dots.………..………....18
2.3.1.2 Synthesis of larger PbS quantum dots..………...….19
2.3.1.3 Synthesis of colloidal PbS/CdS quantum dots...………..20
2.3.2 Synthesis of water dispersible PbS/CdS/ZnS quantum dots………...21
2.4 Characterization………..22
2.4.1 Structural and optical property characterization……….22
2.4.1.1 Transmission Electron Microscopy and Energy Dispersive X-ray Spectroscopy………....22
IX
2.4.1.2 X-ray Powder Diffraction………...23
2.4.1.3 Inductively coupled plasma optical emission spectroscopy…………...…23
2.4.1.4 Property characterization………24
2.4.1.5 Estimation of quantum dots concentration, size and shell thickness calculation……….25
2.4.2 Theoretical calculation of wave functions……….26
2.4.3 Cytotoxicity study of PbS/CdS/ZnS quantum dots………...27
2.4.4 In vivo fluorescence imaging in mice………...27
CHAPTER 3 RESULTS………..…...31
3.1 Part I: Quantum dots in organic phase………...31
Section I Microwave-assisted cation exchange toward synthesis of near-infrared emitting PbS/CdS core/shell quantum dots with significantly improved quantum yields through a uniform growth path………… …………...33
Section II Towards Understanding Unusual Photoluminescence Intensity Variation of Ultrasmall Colloidal PbS Quantum Dots with the Formation of Thin CdS Shell……… ………...42
3.2 Part II: Water dispersible quantum dots and their applications……….….64
Section III Development and Investigation of Ultrastable PbS/CdS/ZnS Core/shell/shell Quantum Dots in the First and Second Biological Windows and their Application in Tumor Imaging………...65
Section IV PbS/CdS/ZnS Quantum Dots: A Multifunctional Platform for In Vivo Near-Infrared Low-Dose Fluorescence Imaging……….109
X
CHAPTER 4 CONCLUSIONS AND PERSPECTIVES………..132
4.1 Conclusions………..132
4.2 Perspectives………..135
REFERENCES……….139
RÉSUMÉ………...144
XI
LIST OF FIGURES
Figure 1.1 Electronic energy states of a semiconductor in the transition from discrete
molucule to nanosized crystals and bulk crystals. Blue shading denotes ground state electron occupation. The schematic illustration is taken from reference [2].
Figure 1.2 Due to quantum confinement effect, an example of size-dependent optical
properties. (a): fluorescence image of CdSe QDs as a function of size. (b): absorbance spectrum as a function of size. The graph is taken from:
http://nanocluster.mit.edu/research.php
Figure 1.3 Absorbance of various tissue and blood components from 200 nm to 10
μm. (Obtained from reference [13]).
Figure 1.4 Optical windows in biological tissues. (Obtained from reference [17]).
Figure 1.5 Composition, size and wavelength ranges of reported NIR-emitting QDs
prepared via solution-based methodologies. Emission wavelengths reported for constant size nanocrystals containing different proportions of elements are represented with broken lines rectangle. (Obtained from reference [19]).
Figure 1.6 NIR-II fluorescence imaging of a xenograft tumor with high uptake of
Ag2S QDs. (a–e) Time course of NIR-II fluorescence images of the same mouse
injected with Ag2S QDs. (Obtained from reference [27]).
Figure 1.7 Room-temperature optical characterization of toluene solutions of PbS
QDs. a) Absorption spectra spanning the range of tuneable sizes. b) Band-edge absorption and photoluminescence peaks for a sample 6.5 nm in diameter. (Obtained
XII from reference [49]).
Figure 1.8 (a) TEM image of oleate stabilized PbS or PbSe QDs, (b) pictures of
dispersion of PbS/CdS and PbSe QDs in TRIS, buffer and water, respectively. (Obtained from reference [54]).
Figure 1.9 Schematic representation of the four limiting charge carrier localization
regimes in core/shell semiconductor QDs. The conduction and valence band edges (i.e., the highest occupied molecular orbital (LUMO) and lowest unoccupied molecular orbital (HOMO) energy levels) are indicated by CB and valence band (VB), respectively. The plus and minus signs represent the charge carriers (hole and electron, respectively). The electron and hole ground-state wave functions are schematically depicted in the lower panel (Type I, Type-I½ and Type II illustrations obtained from reference [62]).
Figure 1.10 TEM images of the plain CdSe-cores and core/shell nanocrystals
obtained under typical reaction conditions: (A) TEM images of CdSe-cores (before injection of Cd2+ solution); (B) (A) plus 2 monolayers of CdS; (C)/(E) (B) plus 3.5 monolayers of Zn0.5Cd0.5S; (D)/(F) (C) plus 2 monolayers of ZnS. (Obtained from
reference [61]).
Figure 1.11 (a) PL spectra of 5.2 nm diameter PbSe NQDs (higher wavelengths) and
corresponding PbSe/CdSe NQDs (lower wavelengths), (b) PL spectra of (∼7 nm) PbS and two aliquots during CdS shell formation, showing relative PL enhancement during the process. Arrows indicate progress of reaction during CdS shell formation. (Obtained from reference [67]).
XIII
Figure 1.12 II-BW fluorescence images (1100 nm) of a breast cancer tumor 1 h (a)
and 48 h (b) after injection of anti-HER2 antibody conjugated PbS QDs. The tumor location in (a) is indicated by the dotted circle. Scale bar: 10 mm. Ex vivo images of the breast cancer tumor using (c) bright field microscopy, (d) fluorescence microscopy at a visible light wavelength (535 nm), and (e) fluorescence microscopy at a II-BW wavelength (1100 nm). Scale bar: 2 mm. (Obtained from reference [76]).
Figure 2.1 Schematic illustration of the setup for the synthesis of PbS, PbS/CdS core
shell and PbS/CdS/ZnS core shell shell QDs.
Figure 2.2 Schematic illustration of the synthesis of core shell PbS/CdS QDs by
microwave-assisted cation exchange approach.
Figure 2.3 Schematic illustration of the synthesis of core shell sehll PbS/CdS/ZnS
QDs by microwave-assisted epitaxial growth method.
XIV
LIST OF ABBREVIATIONS AND SYMBOLS
AbbreviationsCB………Conduction band CNTs……….…Single-walled carbon nanotubes DMEM……….Dulbecco’s modified Eagle’s medium EDX……….Energy dispersive X-ray spectroscopy FBS………Fetal bovine serum ICP-OES………..Inductively Coupled Plasma-Optical Emission Spectrometer LED……….Light emitting diode NC……….Nanocrystal NIR……….Near infrared NIST………..National Institute of Standards and Technology PL………..Photoluminescence PBS………...Phosphate buffered salin PMT………Photomultiplier tube QD………..Quantum dot QY………Quantum yield SILAR………Successive ionic layer adsorption and reaction TEM………...Transmission electron microscopy TA………....Transient absorption UV……….……..Ultraviolet VB………...Valence band
XV
Vis……….……Visible XRD……….X-ray powder diffraction
Symbols
A………Absorbance
A1………..Normalized amplitudes of the components
A2………..Normalized amplitudes of the components
C………...Molar concentration
d………..Diameter of a QDs E………Band gap energy h………...Planck constant I……….…PL intensity
I0……….Initial PL intensity
Krad……….Radiative recombination rate
Knr………...Non-radiative recombination rate
t………Time τ………..Average lifetime
τ1………...Decay time constant
τ2………...Decay time constant
………...Quantum yield
……….Refractive index
1
CHAPTER 1 INTRODUCTION
1.1 Quantum dots and their basic properties
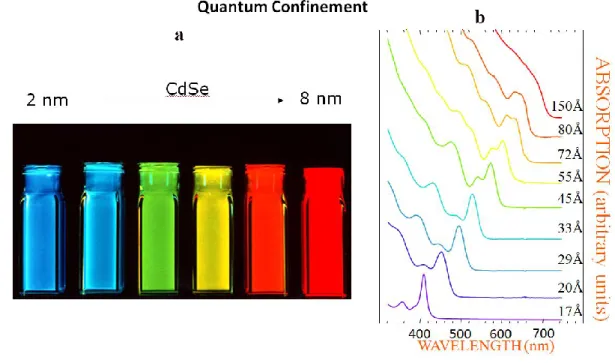
A quantum dot (QD), is a semiconductor nanocrystal (NC), which is normally composed of group II-VI, IV-VI or III-V compounds. Typically, the QDs are smaller than 100 nm in dimension and show novel properties different from their bulk materials, such as size-dependent optical absorption and emission spectra [1]. These unique characteristics arise from the quantum confinement effect which is observed as long as the size of the material is smaller than the Bohr exciton radius, defined as the size of an exciton (the electron-hole pair). The quantum confinement affects the exciton wave function, and induces changes to the density of electronic states and to energy level separation, which are manifested as the increase of the bandgap with decreasing size and the appearance of discrete energy levels near band edges [2, 3]. In fact, the electronic properties of the QDs are intermediate between those of discrete molecules and of bulk semiconductors, displaying discrete electronic transitions [2], as shown in Figure 1. Therefore, the bandgap changes as the size of the QD changes. As a result, the optical properties of QDs become strongly size dependent, making it possible to tune their absorption and photoluminescence (PL) over a wide spectral region by varying their size and shape [3, 4]. For example, lead selenide (PbSe) has a Bohr exciton radius of 46 nm. This means as long as the NCs size is smaller than 46 nm, their optical spectra show size dependent properties. Figure 1.2 displays the quantum confinement effects for CdSe QDs, showing that the wavelengths of fluorescence and absorption can be tuned by nanocrystal size. The Bohr exciton radius of CdSe is 9.6 nm and its emission wavelength can be tuned throughout the visible range by adjusting the QD size from 2 to 8 nm. The size-dependent bandgap and optical properties of QDs have made them potentially a good candidate in a great deal of applications such as bio-imaging [5, 6], light-emitting diodes [7, 8] and solar cells [9, 10].
2
Figure 1.1 Electronic energy states of a semiconductor in the transition from discrete molecules to
nanosized crystals and bulk crystals. Blue shading denotes ground state electron occupation. The schematic illustration is taken from reference [2].
Figure 1.2 An example of size-dependent optical properties due to the quantum confinement effect. (a):
fluorescence image of CdSe QDs as a function of size. (b): absorbance spectrum as a function of size. The graph is taken from: http://nanocluster.mit.edu/research.php
3
1.2 NIR QDs and their applications
Fluorescence-based optical imaging in the visible range (400-700 nm) benefiting from fast feedback has been shown to be useful for both in vitro and in vivo imaging [11], but it is great limited by tissue penetration of approximately 1 mm [12]. In complex biological systems like cells, or especially in living organisms, the fundamental problems for optical imaging are auto-fluorescence, high light reflection, refraction and scattering of the tissue, and strong absorption of the different tissue and blood components: water, haemoglobin (Hb), melanin, protein [13]. Especially in the range of 200 (in the UV range) to 650 nm, the absorbance of blood components are very high, as shown in Figure 1.3. The absorption reduces the transmission of the excitation light and also the emitted fluorescence signal is significantly weakened, or even completely quenched [14]. This is a major barrier for visible optical imaging.
For deep tissue imaging, NIR fluorescence probes, which allow much lower tissue absorption and scattering, lower undesirable infrared autofluorescence and deeper penetration are more desirable [15, 16]. In particular, two wavelength ranges between 650-950 nm and 1000-1350 nm, now known as the first and second biological windows (I-BW and II-BW), respectively, have been identified [17]. Generally speaking, a suitable NIR fluorophore, which can be used for biological application, must fulfil the following requirements [18, 19]: (a) dispersible and stable in relevant buffers, cell culture media or body fulids, (b) high brightness and available in a reproducible quality, (c) no toxicity or interference with cell physiology. However, there are only limited choices of NIR-emitting fluorophores, such as single-walled carbon nanotubes (SWCNTs) [20, 21], Nd3+ and Er3+ doped nanoparticles [22-25] , certain types of QDs [26-28] , and a few organic dyes [29, 30]. The relatively low fluorescence quantum yields (QYs) and absorption coefficients, and/or poor biocompatibility of SWCNTs, dyes and rare-earth doped nanoparticles have limited their widespread use for in vivo imaging [18, 31]. It has also been reported that carbon nanotubes can impale pulmonary cells like needles [32, 33]. Therefore, it is urgent
4
to exploit other brightly fluorescent and biocompatible NIR-II fluorescent probes for biological imaging both in vitro and in vivo.
Figure 1.3 Absorbance of various tissue and blood components from 200 nm to 10 μm. (Obtained from reference [13]).
5
Figure 1.4 Optical windows in biological tissues. (Obtained from reference [17]).
Figure 1.5 Composition, size and wavelength ranges of reported NIR-emitting QDs prepared via
solution-based methodologies. Emission wavelengths reported for constant size nanocrystals containing different proportions of elements are represented with broken lines rectangle. (Obtained from reference [19]).
NIR emitting QDs which can be tuned to emit from below 1000 nanometer to several thousand nanometers are particularly interesting [34]. They can absorb photons over a broad wavelength range in the solar spectrum, from ultraviolet (UV)-visible (vis) to NIR. Both the excitation and emission of NIR QDs can be easily tuned to lie within the biological windows, in which tissues do not absorb and scatter the light as much as in the UV-vis regime and thus lower autofluorescence is involved. Bio-imaging with NIR QDs, is more desirable for some demanding biological applications, where deeper tissue penetration and higher signal-to-noise ratios are required [35, 36]. Several types of QDs such as InAs and InP (III-V) [37, 38], PbSe and PbS (IV-VI) [39, 40], Ag2S and Ag2Se (I-VI) [26, 41], which can be
tuned to emit in the NIR range as shown in Figure 1.5. Among them, Ag2S QDs with relatively high
6
with these Ag2S QDs afforded deep inner organ registration, dynamic tumor contrast, and fast tumor
detection. However, their low photostability can be a major issue for some applications. It has been reported that their PL intensity decreased by half in the first 200 s under continuous illumination with a 808 nm laser diode [42].
Figure 1.6 NIR-II fluorescence imaging of a xenograft tumor with high uptake of Ag2S QDs. (a–e)
Time course of NIR-II fluorescence images of the same mouse injected with Ag2S QDs. (Obtained from
reference [27]).
1.3 PbS QDs
PbS QDs owing to their unique features, such as narrow bandgaps (0.41 eV at room temperature), large Bohr radii (18 nm) and size-dependent optical absorption and emission spectra (Figure 1.7) have gained considerable attention in the last decade [44]. Due to these unique features, the PbS QDs have shown potential applications in, for instance, solar cells, bioimaging, telecommunications and light emitting diodes (LEDs) [45-47]. Some contents of this chapter were published in a review article by our group in 2016 [48].
The synthesis of colloidal PbS QDs is normally done through the hot injection method, which is performed by injecting the sulfur source to the hot lead organometallic precursors. Since this method can separate the nucleation and growth stages by precisely controlling temperature, it usually yields the
7
best quality, judged by size and shape distribution as well as optical properties. The seminal work on the synthesis of relatively monodisperse PbS QDs by an organometallic route using hot injection was first reported by Hines and Scholes [49]. The QDs show a narrow size dispersion (15–20%) with a full width at half maximum of PL peak of about 100 meV without any size selection process. However, their synthesis involved the use of the toxic chemical bis(trimethylsilyl)sulfide (TMS) as the sulfur source. Another breakthrough on the PbS QD synthesis was later on achieved by Ozin’s group, who discovered a solventless, heterogeneous, and relatively green route to synthesize PbS QDs via the hot injection method, by replacing TMS with sulfur [50]. The obtained high quality QDs have an even narrower size distribution, with a full width at half maximum of PL peak as low as 52 meV. However, this synthesis was achieved in a highly viscous solution, which may not be easy to operate under certain circumstances. Learned from all these previous studies, we attempted to develop a simple, green and easily reproducible approach to synthesize PbS QDs. We made effort to do the synthesis in a “non-viscous” solventless oleylamine (OLA) system, by using a constant reaction temperature [51].
Figure 1.7 Room-temperature optical characterization of toluene solutions of PbS QDs. a) Absorption
spectra spanning the range of tuneable sizes. b) Band-edge absorption and photoluminescence peaks for a sample 6.5 nm in diameter. (Obtained from reference [49]).
8
The hot injection method synthesized PbS QDs are normally dispersed in an organic phase. For biomedical applications, QDs are required to not only be dispersible in water, but also show high QY and good PL stability in buffer. In this case, surface modification of QDs is indispensable, which is usually achieved through ligand exchange, silica coating or intercalation process. One of the earliest reports on surface modification of Pb-based QDs was published by Colvin’s group, where 11-mercaptoundecanoic acid was used to replace the oleate ligand on the surface of PbSe QDs [52]. Such prepared water dispersible QDs were found to be stable in water, but not in physiological buffers. Hinds et al. subsequently transferred PbS QDs from organic solvent to aqueous solution by replacing the oleate ligand with (1-mercaptoundec-11-yl) tetra (ethylene glycol) [53]. These PbS QDs exhibited improved colloidal stability in buffer for about 5 days. Recently, Veggel’s group used a modified polymer approach to functionalize PbS/CdS core/shell QDs and transfer them into water [54], as shown in Figure 1.8. These QDs showed significantly enhanced, excellent long term colloidal stability in buffers, however, no information was provided on the photostability of these QDs under continuous illumination in buffers, which is an important requirement for biomedical applications when long term tracking of biological processes is needed [55].
Figure 1.8 (a) TEM image of oleate stabilized PbS or PbSe QDs, (b) pictures of dispersion of PbS/CdS
and PbSe QDs in TRIS, buffer and water, respectively. (Obtained from reference [54]).
1.4 Core/Shell QDs and their advantages
9
of nanomaterials that only capped by organic ligands become extremely sensitive to surface characteristics. In particular, surface atoms have fewer neighbours than their interior counterparts, it is difficult to simultaneously passivate both anionic and cationic surface sites by organic ligand. Therefore, the surface atoms possess unsatisfied chemical bonds (dangling bonds), which can trap charge carriers and increase the probability of nonradiative decay events [56]. For these reasons, optical properties can be largely affected. It is thus essential to control the surface quality and to eliminate dangling bonds. To this end, researchers have made great efforts in the past few decades on surface engineering of QDs. Better surface passivation has been achieved by overgrowing an inorganic shell of a wider band gap semiconductor to form core/shell structure [57]. As a result, the impact from the surface defect states, trap sites and environmental factors on the QDs will be diminished [2, 58-61].
Figure 1.9 Schematic representation of the four limiting charge carrier localization regimes in core/shell
semiconductor QDs. The conduction and valence band edges (i.e., the highest occupied molecular orbital (LUMO) and lowest unoccupied molecular orbital (HOMO) energy levels) are indicated by CB and valence band (VB), respectively. The plus and minus signs represent the charge carriers (hole and electron, respectively). The electron and hole ground-state wave functions are schematically depicted in the lower panel (Type I, Type-I½ and Type II illustrations obtained from reference [62]).
10
passivated and protected. Therefore, compared to the QDs capped only by organic ligands, the thermal, mechanical and chemical stability of core/shell QDs can all be enhanced. Furthermore, the optical properties of core QDs can be modified or improved via this core/shell strategy through adjusting the energy level alignment in the core/shell structure. This core/shell strategy has been proved to be an effective way to improve the photophysical properties of QDs [61, 63, 64]. Specifically, depending on the relative alignment of CB and VB edges of core and shell semiconductors, the core/shell QDs can be classified as: Type-I, Type-I½ (also known as ‘‘quasi type-II’’), Type-II and Reverse Type-I (Figure 1.9). In the Type-I and reverse Type-I core/shell QDs, the VB and CB edges of one semiconductor lies entirely within the bandgap of the other material. Therefore, both electrons and holes are confined primarily in the narrower bandgap material. In type II core/shell QDs, either the VB or CB edge of the core is situated in the bandgap of the shell. As a consequence, the photogenerated electrons and holes are spatially segregated, with one type of charge carriers being preferentially confined in the core and the other in the shell. In the Type-I1/2 structure, the energy offset between one type of band edges (VB or CB) of the core and shell is so small that only one type of charge carriers can be confined in one of the components, while the other is delocalized in the entire core/shell structure.
The growth of the shell has been achieved by different approaches, such as precursor co-precipitation and successive ionic layer adsorption and reaction (SILAR) [65]. For example, Bawendi’s group used a two-step method (SILAR) to synthesize monodisperse CdSe/ZnS QDs with CdSe cores ranging in diameter from 2.3 to 5.5 nm as early as 1997 [66]. Recently, R. Xie et al used the same method to synthesize highly luminescent CdSe-Core CdS/Zn0.5Cd0.5S/ZnS multishell nanocrystals [61], they
gradually changed the shell composition from CdS to ZnS in the radial direction. Due to the stepwise adjustment of the lattice parameters in the radial direction, the resulting nanocrystals show a high crystallinity and are almost perfectly spherical (Figure 1.10). In contrast to the SILAR method, another approach named cation exchange method has been used to synthesize high quality lead chalcogenide core/shell QDs. In this method, a shell grows at the expense of a core crystal by replacing the cations in
11
the core with newly introduced cations in solution. The synthesis of high quality PbSe/CdSe and PbS/CdS core/shell QDs in a controlled manner via a cation exchange reaction was first reported by Hollingsworth and co-workers [67]. The formation of the core/shell structure was supported by detailed structural characterization as well as PL spectral analysis. Both PbSe/CdSe and PbS/CdS core/shell QDs show gradual blue shift in their PL spectra with the proceeding of the cation exchange reaction, in line with the steady shrinking of the core due to shell growth, as shown in Figure 1.11.
Figure 1.10 TEM images of the plain CdSe-cores and core/shell nanocrystals obtained under typical
reaction conditions: (A) TEM images of CdSe-cores (before injection of Cd2+ solution); (B) (A) plus 2 monolayers of CdS; (C)/(E) (B) plus 3.5 monolayers of Zn0.5Cd0.5S; (D)/(F) (C) plus 2 monolayers of
12
Figure 1.11 (a) PL spectra of 5.2 nm diameter PbSe NQDs (higher wavelengths) and corresponding
PbSe/CdSe NQDs (lower wavelengths), (b) PL spectra of (∼7 nm) PbS and two aliquots during CdS shell formation, showing relative PL enhancement during the process. Arrows indicate progress of reaction during CdS shell formation. (Obtained from reference [67]).
1.5 Bio-applications of lead based QDs
It is well know that in the first and second biological windows (I-BW and II-BW), the NIR light is minimally absorbed by tissue components and scattered as compared to visible light, resulting in deeper penetration depth [15, 16, 68-74]. The emission of PbS-based chalcogenide QDs with a large Bohr radii can be easily tuned to this spectral range. As such, they have high potential in deep tissure and animal bioimaging. One of the earliest reports on surface modification of Pb-based QDs and their use as NIR fluorophores was published by Colvin’s group, where thiol ligands were used to replace the oleic acid ligands on the surface of PbS and PbSe QDs [75]. These water-dispersible lead-based QDs had fluorescence QY of about 10%, as a first example, NIR fluorescence imaging of human colon cancer cells is demonstrated using these fluorophores. Jin’s group recently synthesized glutathione (GSH) coated PbS QDs by reacting Pb(CH3COO)2 and Na2S in the presence of GSH [76]. These QDs was used
for non-invasive fluorescence imaging in the second near-infrared biological window (as shown in Figure 1. 12). But their QY was too low, which was 6% for 1200 nm emitting PbS QDs.
13
Figure 1.12 II-BW fluorescence images (1100 nm) of a breast cancer tumor 1 h (a) and 48 h (b) after
injection of anti-HER2 antibody conjugated PbS QDs. The tumor location in (a) is indicated by the dotted circle. Scale bar: 10 mm. Ex vivo images of the breast cancer tumor using (c) bright field microscopy, (d) fluorescence microscopy at a visible light wavelength (535 nm), and (e) fluorescence microscopy at a II-BW wavelength (1100 nm). Scale bar: 2 mm. (Obtained from reference [76]).
When QDs containing heavy metals of Pb or Cd are used for biological applications, toxicity remains a strong concern. To the best of our knowledge, so far there are no in-depth studies on the toxic effects of Pb-based QDs. However, several reports have demonstrated the toxicity of Cd-based QDs in both cell culture and small animal studies. Derfus et al. reported that CdSe QDs dispersed in aqueous solution could release Cd2+ ions and the concentration of the Cd2+ ions was directly correlated with the level of cytotoxicity [77]. Their research also demonstrated that Cd2+ ion release was enhanced by oxidation, either through exposure to air or UV irradiation, but was suppressed by encapsulating the QDs with
14
appropriate shells, such as ZnS or an additional organic shell. Kirchner et al. investigated the cytotoxicity of CdSe and CdSe/ZnS QDs undergoing different surface modifications, such as coating with mercaptopropionic acid, silica and polymer. They claimed that coating of CdSe QDs with a ZnS shell increased the critical concentration, up to which no toxic effects could be observed, by almost a factor of 10, with respect to the CdSe QDs capped only by mercaptopropionic acid [78]. The reason was that a ligand shell of mercaptopropionic acid around the QDs was not very stable and could not prevent the release of Cd2+ ions from the QD surface [78]. Ye et al. demonstrated that rhesus macaques injected with phospholipid micelle-encapsulated CdSe/CdS/ZnS QDs did not exhibit any evidence of toxicity [5]. Blood and biochemical markers remained within normal ranges following the treatment, and histology of major organs showed no abnormalities after 90 days. Therefore, capping the Pb-based QDs with a biocompatible ZnS shell is an imperative way to use them as fluorescent imaging probes.
1.6 Thesis objectives
This thesis is divided into two parts: the first part is mainly devoted to the study of the PbS/CdS core/shell QDs.
To date, there are several approaches to produce PbS QDs in the organic phase, however, the QY is only between 20%-40% for the larger-sized QDs, whose emission peaks are in the range of 1300-1600 nm [49, 50, 79, 80]. This is because the emission of larger QDs can be easily quenched by localized trap states compared to that of smaller QDs emitting in the region of 1100-1300 nm [81], which typically possess QY between 60%-90% [49, 50, 79, 80]. Therefore, it is highly desirable but also challenging to develop a feasible approach for synthesizing high-quality PbS-based QDs with high QY in the longer wavelength range [82]. The objective for this section is:
1. To develop a reproducible and controllable approach to quickly synthesize high-quality, NIR emitting PbS/CdS core/shell QDs at longer wavelengths (1300-1600 nm).
2. To study the cation exchange mechanism of the forming of PbS/CdS core/shell QDs under different heating source. By understanding the exchange mechanism, further optimizing the reaction parameters
15
to synthesize high quality and large amounts of core/shell QDs.
3. To synthesize a series of differently sized PbS/CdS core/shell QDs by changing the initial PbS size. 4. To study and understand the PL intensity variation of colloidal PbS QDs with the formation of thin CdS shell from the perspective of trap density variation and the probability of electrons and holes reaching surface defects.
The second part is mainly focused on the photo and colloidal stability of water dispersible PbS/CdS/ZnS core/shell/shell QDs and their potential bio-applications. As mentioned above, the hot injection method synthesized PbS QDs are normally dispersed in an organic phase. For biomedical applications, QDs are required to not only be dispersible in water, but also show high QY and good PL stability in buffer. Although the water dispersible visible emitting QDs have been synthesized through ligand exchange, silica coating or intercalation process, relevant reports on NIR-emitting PbS QDs are still lacking. It is highly desirable but also challenging to develop a feasible approach to synthesize high-quality water-dispersible NIR-emitting PbS-based QDs. Hence, the objective of this section is: 1. To synthesize water dispersible PbS/CdS/ZnS core/shell/shell QDs by growing a biocompatible ZnS shell on the PbS/CdS core/shell QDs surface. By tuning and optimizing the CdS and ZnS shell thickness to synthesize high quality water dispersible QDs.
2. To investigate their photo and colloidal stability as well as their cytotoxicity effects, so as to use these waterdispersible QDs to serve as imaging agents.
3. To study their thermal-dependent behavior of the fluorescence signal. The PbS/CdS/ZnS QDs are exploited to obtain thermal mapping of subskin areas in live specimens.
1.7 Thesis organization
This thesis is divided into four chapters and organized as follows:
Chapter 1 Introduction: This chapter is the introduction to the thesis. It also presents the objectives of
this thesis.
16
PbS/CdS core/shell and PbS/CdS/ZnS core/shell/shell QDs. The characterization of the core/shell and core/shell/shell QDs and the investigation of the potential biological applications of core/shell/shell QDs are also presented.
Chapter 3 Results:
Part I: Quantum dots in organic phase
Section I: Microwave-assisted cation exchange toward synthesis of near-infrared emitting PbS/CdS core/shell quantum dots with significantly improved QYs through a uniform growth path
Section II: Towards understanding unusual photoluminescence intensity variation of ultrasmall colloidal PbS quantum dots with the formation of thin CdS shell
Part II: Water dispersible quantum dots and their applications
Section III: PbS/CdS/ZnS quantum dots: A multifunctional platform for in vivo near-Infrared low-dose fluorescence imaging
Section IV: Development and investigation of ultrastable PbS/CdS/ZnS core/shell/shell quantum dots in the first and second biological windows and their application in tumor imaging
Chapter 4 Conclusions and Perspectives: In this part the conclusions drawn based on the analysis of the
17
CHAPTER 2 EXPERIMENTAL AND CHARACTERIZATION
In this chapter, experiment details for the synthesis and characterization of colloidal PbS, PbS/CdS core/shell and PbS/CdS/ZnS core/shell/shell QDs are described. Firstly, PbS QDs were synthesized by the normally used hot injection method. Then these PbS QDs were coated with a CdS shell via cation exchange approach in an organic phase to form PbS/CdS core/shell structure. Finally, I synthesized water dispersible and biocompatible PbS/CdS/ZnS core/shell/shell QDs by coating another ZnS shell around PbS/CdS QDs and simultaneously replacing hydrophobic oleic acid ligand with mercaptopropyl acid ligand during facile microwave-assisted ZnS shell formation process. After tuning the synthesis parameters to vary separately the shell thickness of CdS and ZnS and performing reaction optimization, I obtained high quality, water dispersible PbS/CdS/ZnS core/shell/shell QDs.
2.1 Materials
Lead chloride (98%), lead acetate trihydrate (≥99.99%), bis(trimethylsilyl) sulfide (TMS) (synthesis grade), trioctylphosphine (TOP) (technical grade, 90%),sulfur (100%), oleylamine (OLA) (technical grade, 70%), cadmium oxide (99%), cardiogreen (IR 125), methanol (anhydrous, 99.8%), octadecene (ODE),nitric acid (70%), mercaptopropyl acid (MPA) (≥99.0%), 1-methyl-2-pyrrolidinone (NMP) (≥99%),butylamine (99.5%), dulbecco’s modified Eagle’s medium (DMEM), dimethyl sulfoxide (DMSO), 3-(4,5-dimethylthiazol-2-yl)-2,5-diphenyltetrazolium bromide (MTT), phosphorous pentasulfide (99%) and zinc chloride (99.999%) were obtained from Sigma-Aldrich Inc. Hexane, buffer solution pH 9.2 (borate) traceable to National Institute of Standards and Technology (NIST), 10X Tris-EDTA (pH 7.6) solution, phosphate buffered salin (PBS, pH 7.4), oleic acid (OA), toluene, and ethanol were purchased from Fisher Scientific Company. Plasma standard sotlution (sulfur, lead and zinc) were purchased from Alfa Aesar Company. All chemicals were used as purchased.
18
Figure 2.1 Schematic illustration of the setup for the synthesis of (a) PbS and (b) PbS/CdS core/shell
and PbS/CdS/ZnS core/shell/shell QDs.
Schematic illustration of the typical reaction setup for the synthesis of PbS, PbS/CdS core/shell and PbS/CdS/ZnS core/shell/shell QDs is shown in Figure 2.1. Both of the smaller sized PbS QDs (less than 3 nm in diameter) and the larger sized PbS QDs (3.4 to 6 nm in diameter) were synthesized by using the reaction setup shown Figure 2.1a. Since the nucleation and growth processes of synthesizing PbS QDs are very sensitive to oxygen, I set up this reaction under the protection of inert N2. The PbS/CdS
core/shell QDs were synthesized by using a microwave-assisted cation exchange approach (Figure 2b). Briefly, the purified PbS QDs were mixed with Cd-OLA solution, after bubbling 10 min of N2, this
mixture was quickly heated to 100 °C by microwave. Depending on the CdS shell thickness, the reaction time can be kept for a few seconds to several min. The same microwave-reaction setup (Figure 2b) was used for synthesizing PbS/CdS/ZnS core/shell/shell QDs. Detailed information can be found in the synthesis part.
2.3 Synthesis of lead based quantum dots
2.3.1 Synthesis of PbS and PbS/CdS quantum dots in the organic phase 2.3.1.1 Synthesis of smaller PbS QDs
The smaller sized PbS QDs (less than 3 nm in diameter) were synthesized following previously reported method [49, 83]. The typical procedures are as follows:
19
1. Accurately weighed 760 mg of lead acetate trihydrate, 2.4 ml of OA and 15 ml of ODE were added to a 50 ml three neck round bottom flask.
2. The mixture was mixed well and then gradually heated to 150 °C in an oil bath. The mixture was kept at this temperature for at least 1 h under continuous stirring and purging with N2.
3. After the solution became transparent and homogeneous, the temperature was decreased to 130 °C, the N2 flow was stopped and then the solution was pumped for 15 min. After that the N2
flow was restarted.
4. The mixture of TMS and TOP (1:10 ratio by volume; 2 ml in total) was rapidly injected into the flask, the solution was quickly cooled to 100 °C and kept at this temperature for approximately 5 min, and then quenched with cold water.
5. The QDs were precipitated by centrifugation and then re-dispersed in cold hexane. After keeping the QD dispersion at 4 °C for two days, the QD dispersion was centrifuged at 8000 rpm for 30 min and the sediment was discarded. Following methanol addition, it was centrifuged at 3000 rpm for 5 min. After removing the supernatant, the QDs sediment was re-dispersed in toluene. This purification step was repeated one more time.
2.3.1.2 Synthesis of larger PbS QDs
The larger sized PbS QDs (3.4 to 6 nm in diameter) were synthesized by using OLA as capping ligands [40]. The typical procedures are as follows:
1. Accurately weighed 10 g of lead chloride and 24 mL of OLA were loaded into a 50 ml three neck round bottom flask.
2. After mixing well, the solution was heated by oil bath to 160 °C and kept at this temperature for 1 h under the protection of N2.
3. After the solution became transparent and homogeneous, the solution was cooled to 120 °C and pumped for 30 min.
20
5. Accurately weighed 115 mg of sulfur was dissolved in 4 mL of OLA by ultrasonication to form S-OLA precursor.
6. S-OLA precursor was quickly injected into the PbCl2-OLA suspension under vigorous stirring. The
reaction cell was quenched with cold water after the growth reaction was conducted at 100 °C for 1−30 min to obtain PbS QDs of different sizes (3.4-6 nm).
7. The purification procedure was carried out in air using anhydrous solvents. 20 mL of hexane and 30 mL of ethanol were added to the reaction solution followed by centrifugation to separate QDs. Obtained PbS QDs were redispersed in 20 mL hexane, again precipitated with 40 mL of ethanol and redispersed in toluene.
2.3.1.3 Synthesis of colloidal PbS/CdS QDs.
Figure 2.2 Schematic illustration of the synthesis of PbS/CdS core/shell QDs by microwave-assisted
cation exchange approach.
The PbS/CdS core/shell QDs were synthesized by microwave-assisted cation exchange approach. The typical procedures are as follows:
1. 3 g of cadmium oxide, 15 mL of OA and 20 mL of ODE were mixed well in a 50 ml three neck round bottom flask.
2. The mixture was heated to 200-250 °C using an oil bath until the solution turned colorless. 3. The solution was cooled to 100 °C and degassed under vacuum for 30 min.
4. The temperature was further decreased to 20 °C and 12 mL of PbS QD dispersion with known concentration was added via syringe to mix with Cd-solution.
21
5. 20 mL of this mixture solution was introduced into a 35 mL reaction tube, and then heated via microwave (Discover; CEM corporation) to 100 °C for different times.
6. To purify the PbS/CdS QDs, ethanol was added to precipitate QDs. The precipitate was subsequently redispersed in toluene and again precipitated with ethanol. The redispersion/precipitation procedure was repeated additionally once or twice.
The above recipe was used to synthesize a relatively thick CdS shell (0.3 ~ 0.6 nm). For synthesizing a very thin shell (0.2 ~ 0.4 nm), the precursor concentration was lower, with reaction steps being the same.
2.3.2 Synthesis of water dispersible PbS/CdS/ZnS QDs
Figure 2.3 Schematic illustration of the synthesis of PbS/CdS/ZnS core/shell/shell QDs by
microwave-assisted epitaxial growth method.
The PbS/CdS/ZnS core/shell/shell QDs with MPA as the capping ligand were prepared as follows. Coating the PbS/CdS QDs with a ZnS shell and replacing OLA by MPA were achieved simultaneously. The typical procedures are as follows:
1. 0.02 g of phosphorous pentasulfide, 0.5 g of MPA, 0.3 mL butylamine and 10 ml NMP were mixed well in in a sealed vial then heated to 110 ºC and kept at this temperature for 20 min. 2. In a separate vial, 0.07 g of zinc chloride, 0.5 g of MPA and 0.3 mL of butylamine were mixed in
22
3. 0.007 g of OA-capped PbS/CdS QDs were dispersed in the phosphorous pentasulfide solution after it was cooled down to room temperature, and the QD dispersion was mixed with zinc chloride solution.
4. The mixture solution was heated at 70 ºC for 30 min in the microwave oven, yielding the MPA-capped PbS/CdS/ZnS core/shell/shell QDs.
5. The PbS/CdS/ZnS core/shell/shell QDs were purified by solvent extraction four times using hexane. The purified QDs were dried overnight at the room temperature in vacuum and dispersed in water. Water dispersible QDs were purified by ultrafiltration using an Ultracel-15 centrifugal filter (Millipore) three times and re-dispersed in phosphate buffered saline (PBS) solution and the pH of the solution was adjusted to 7.5 by adding NaOH solution.
2.4 Characterization
2.4.1 Structural and optical property charcaterization
PbS, PbS/CdS and PbS/CdS/ZnS QDs were characterized by various techniques. Briefly, the structure and composition of the QDs were characterized by Transmission Electron Microscopy, Energy Dispersive X-ray Spectroscopy, Powder X-ray Diffraction and Inductively Coupled Plasma-Optical Emission Spectroscopy. The optical property was characterized by a Cary 5000 UV-visible-NIR spectrophotometer and Fluorolog®-3 system. Detailed information is introduced below.
2.4.1.1 Transmission Electron Microscopy and Energy Dispersive X-ray Spectroscopy
Transmission electron microscopy (TEM) provides the direct visualization of nanostructures by using a beam of electrons to transmit through an ultra-thin specimen and an image can be formed from the interaction of the electrons with the specimen. This TEM technique has been a major analysis method for observing the morphology, size and structure of the materials[84]. In my experiments, TEM was used to directly observe the morphology, shape and size of synthesized PbS, PbS/CdS and PbS/CdS/ZnS QDs. Samples for TEM measurements were deposited onto copper TEM grids coated with thin (5-50 nm thickness) carbon films. One drop of solution containing PbS, PbS/CdS or PbS/CdS/ZnS QDs was
23
deposited onto the grid. The grid was subsequently put in the fume hood with high airflow to let it dry before TEM measurements. Low- and high-resolution TEM images were obtained using a JEOL 2100F microscope. Energy dispersive X-ray spectroscopy (EDX), which is a technique used for determining the elemental composition of a material, was used to confirm the presence of all expected elements (Pb, Cd and S) in the PbS/CdS core/shell QDs and (Pb, Cd, Zn and S) in the PbS/CdS/ZnS core/shell/shell QDs.
2.4.1.2 X-ray Powder Diffraction
X-ray powder diffraction (XRD) is an analytical technique mainly used for identifying the atomic and molecular structure of a crystalline material [85]. XRD study of PbS and PbS/CdS QDs after extensive purification was carried out with a Philips X’pert diffractometer using Cu Kα radiation source (λ = 0.15418 nm). Diffraction patterns were collected in the 2θ range of 20-80°, by using the step of 0.1° and counting time of 10 s. In order to perform XRD, highly concentrated PbS or PbS/CdS solution was deposited on glass substrate and dried in fume hood to form a film.
2.4.1.3 Inductively coupled plasma optical emission spectroscopy
Inductively Coupled Plasma-Optical Emission Spectrometer (ICP-OES) is an analytical technique used for the determination of trace elements. In ICP-OES, the inductively coupled plasma produces excited atoms and ions that emit electromagnetic radiation at wavelengths characteristic of a particular element. The light emitted by the excited atoms and ions in the plasma is measured to obtain information about the sample [86]. In our experiments, the contents of Pb, Zn and S elements in PbS and PbS/CdS/ZnS QDs were characterized by the ICP-OES (Agilent Technologie, 5100). Basically, the PbS QDs were precipitated with ethanol, centrifuged, and then dried in vacuum. Then, the PbS QD powder was completely dissolved by nitric acid to make aqueous solution for measuring ICP-OES. For the water dispersible PbS/CdS/ZnS QDs, they were dried in vacuum then dissolved by nitric acid. In order to measure ICP-OES, the standard solution of Pb, S and Zn with a series of concentrations: 1, 5, 10, 20, 50, 100 was prepared.
24
2.4.1.4 Property characterization
Absorption spectra were acquired with a Cary 5000 UV-Vis-NIR spectrophotometer (Varian) with a scan speed of 600 nm/min. Fluorescence spectra were taken with a Fluorolog®-3 system (Horiba Jobin Yvon) using charge coupled device or photomultiplier tube detectors, depending on emission wavelengths. A Xenon lamp was used to excite the QDs. The QY of smaller sized QDs (≤ 2.9 nm) was measured by using dye IR-125 as a reference and the QY of larger sized QDs (≥ 3.4 nm) was measured by using dye IR-26 as a reference, taking their respective sample transmittance into account [87, 88]:
x / st = (Gradx / Gradst) * (x2/ st2) (2.1)
where the subscripts ST and X denote standard and unknown respectively, is the fluorescence QY,
Grad is the gradient from the plot of integrated fluorescence intensity versus absorbance, and is the refractive index of the solvents used for the measurements.
The photostability of PbS/CdS/ZnS QDs dispersed in PBS buffer was tested by placing them under continuous illumination of a 4 W UV lamp (115 V, 60 Hz, Model 22-UV, Optical Engineering, UV light Inc.). The NIR luminescence image of 930 nm emitting PbS/CdS/ZnS QDs was obtained under 635 nm excitation with a silicon chip camera (Point Grey) equipped with a 785 long pass filter (Chroma).
The PL lifetimes of PbS and PbS/CdS nanocrystals in toluene were measured using a pulsed laser diode of 2.79 eV, photomultiplier tube detectors, and a fast multichannel scaler mode. PL decay curves were fit with a typical biexponential function [89]:
I(t)/I0 = A1exp(-t/τ1) + A2exp(-t/τ2) (2.2)
In this equation, I represents the PL intensity, t is time and I0 is the initial PL intensity at t = 0. A1 and A2
represent the normalized amplitudes of the each components, τ1 and τ2 represent the decay time
constants.
Average lifetime (τ) was calculated from two lifetime components, τ1 andτ2, by using the following
equation:
25
where B1 andB2 represent the relative amplitude of τ1 andτ2, respectively, and were also obtained from
the fitting of the biexponential function. The error on τ was obtained through differentiation of the above definition and expressed as a function of the uncertainty on the fitting parameters B1, B2, τ1, and τ2.
These uncertainties were calculated automatically from the software (DAS6 Fluorescence Decay Analysis).
Transient absorption (TA) spectroscopy was performed with a Quantronix-designed femtosecond transient absorption laser systemcomprising an Er-doped fiber oscillator, regenerative amplifier, and a diode-pumped, Q-switched, second-harmonic Nd:YLF pump laser (527 nm, 10 W capacity). After amplification, the as-generated fundamental beam (∼800 nm, 760 Hz repetition rate) was split in a 1/9 ratio to generate a white light continuum probe pulse and a pump pulse, respectively. The pump pulse was subsequently routed through an optical parametric amplifier to generate the desired 350 nm pump beam with a pulse duration of ∼180 fs. Pump power was modulated by the use of absorptive neutral density filters before illuminating the sample. The pump and probe beams were overlapped spatially and temporally at the sample and the spectra were recorded after excitation with the pump and interrogation with the probe over a delay interval of 0-1000 ps between the pump and probe pulses. Variation in time delay was achieved by a motor-controlled translation stage with 1 μm resolution (6 fs time resolution). The difference absorption of each sample was measured over the aforementioned interval two times and the data averaged to achieve lower overall noise.
2.4.1.5 Estimation of QD concentration, size and shell thickness calculation
The size of PbS QDs and the PbS cores in core/shell QDs was calculated based on bandgap energy estimated from the first exciton absorption peak [40, 80, 90]:
E = 0.41 + 1/(0.0252 d2 + 0.283d) (2.4) The band gap energy was calculated from the absorption peak following the equation:
E = hc/λ (2.5)
26
core/shell QDs, h is Planck constant and λ represents the first excition absorption peak position. The only exception was 2.7 nm PbS/CdS core/shell QDs, for which the relationship between photoluminescence (PL) peak energy and bandgap energy was used to estimate the bandgap energy, and thereby the average size of PbS cores, due to the lack of a clear exciton absorption peak [91]. Since the overall size of PbS/CdS core/shell QDs remained the same as that of initial PbS QDs, the CdS shell thickness was estimated by subtracting the radius of PbS cores in PbS/CdS core/shell QDs from the radius of initial PbS QDs [92].
The size of PbS/CdS/ZnS core/shell/shell water dispersible QDs was measured by TEM with good precision. More than 150 QDs were analyzed for each sample; the size distribution was analyzed with a Gaussian distribution.
The concentration of purified PbS QDs in toluene was determined using the Beer-Lambert’s law [40]:
A = εCL (2.6)
where A is the absorbance at the peak position of the first exciton absorption peak for a given sample, C is the molar concentration of QDs, ε is the extinction coefficient per mole of QDs and L is the light path length. ε was determined using:
ε = 19600 d2.32
(2.7) where d is the radius of QDs.
2.4.2 Theoretical calculation of wave functions
To calculate the electron and hole wave functions, we solved the stationary Schrödinger equation in spherical geometry, in which we used the bulk values for the effective masses of electrons (me*) and holes (mh*), namely me* = 0.085 me and mh* = 0.085 me for Pbs, and me* = 0.2 me and mh* = 0.7 me for CdS, where me is the electron mass at rest in vacuum [93]. The potentials for electrons and holes as a function of position were approximated as the lowest unoccupied molecular orbital and highest occupied molecular orbital levels, respectively, for the bulk materials [94]. For PbS, these levels are -4.5 and -4.91 eV, respectively, while for CdS they are -3.3 and -5.8 eV, respectively [93]. Outside the QD,
27
the potentials were set as 0 and -9.8 eV for electrons and holes, respectively. The interaction between electrons and holes was neglected in the calculations.
2.4.3 Cytotoxicity study of PbS/CdS/ZnS QDs
In order use the water dispersible PbS/CdS/ZnS core/shell/shell QDs for bio-application, the cytotoxicity effects of these QDs were first tested. HeLa cells were plated at 5 X 10⁵ cells/well into a 96-well plate and incubated for 24 h in DMEM (100 μL) containing 10% fetal bovine serum (FBS). Then, DMEM was removed and at this point, live cells were attached onto the bottom of the wells. QDs dispersions in PBS were diluted with DMEM to make a series of concentrations (1 nM, 3 nM, 5 nM and 50 nM). These dispersions of QDs in DMEM (100 μL) were dispensed to 96 wells. Blank controls without any QDs, only with pure DMEM ran simultaneously. Cell viability was measured using CellTiter 96 Non-Radioactive Cell Proliferation Assay Kit (MTT, Promega) accroding to manufacturer’s instruction. Briefly, MTT solution (15 μL) was added into each well. After 24 h incubation, the medium containing unreacted MTT was carefully removed. DMSO (100 μL) was added into each well in order to dissolve the formed formazan blue crystals, and then the absorbance at λ = 570 nm was recorded using Powerwave HT Microplate Reader (Bio-Tek). Each concentration was 12-replicated. Cell viability was calculated as the percentage ratio.
2.4.4 In vivo fluorescence imaging on mice
For the animal experiments, we used six female athymic nude mice (Harlan, Holand) aged 7 weeks. The animals were subcutaneously inoculated in both flanks with 10 × 106 MDA-MB-231 cells per flank in a volume of 200 μl of PBS to generate the human tumor xenografts. When the estimated tumor volume reached 90 mm3, we proceeded to carry out imaging experiment. For the imaging, the mice were anesthetized with 2% isoflurane and 50 µL PBS solution containing PbS/CdS/ZnS QDs (0.2 mg/mL) was injected into each tumor. The tumors were then irradiated with an 808 nm laser diode (LIMO) at a power density of 0.04 W/cm2 and NIR fluorescence images were acquired by using an InGaAs camera (XEva1.7-320) with enhanced sensitivity in the 1000-1700 nm spectral range. A long pass filter with
28
cut-off wavelength at 850 nm was used to remove the 808 nm pump background. The exposure time for all the images shown in the paper was shorter than 1 ms. All the experimental procedures with animals were carried out in compliance with the 2010/63/UE European guideline and were approved by the Ethics Committee from Universidad Autónoma de Madrid (CEIT) in the frame of the project FIS-MAT2013-47395-C4-1-R supported by the Spanish Ministerio de Economía y Competitividad. Fluorescence nanothermometry experiments were carried out by optically pumping a cuvette containing the 1270 nm emitting QDs solution in PBS. The solution temperature was varied by placing the cuvette on a temperature controlled microscope stage (Linkam PE120) operating in the 5-55 °C range with a temperature accuracy of ± 0.5 °C. The thermal contact between the cuvette and the platform was guaranteed using silver filler. Thermal stabilization of the cuvette was ensured by setting heating and cooling ramps as low as 1 °C/min and performing spectral acquisitions after stabilization times close to 10 min thus guaranteeing the reported temperature value had been reached throughout the whole sample.
The optical pumping was provided by a multi-mode fiber coupled laser diode operating at 808 nm (LIMO Gmbh). Pump power was kept below 50 mW for all experiments. The 808 nm radiation was focused into the cuvette by using a low numerical aperture microscope objective (10X, 0.2 NA). The NIR luminescence was collected with the same objective and spectrally analyzed by a high-resolution spectrometer (Horiba HIR 320) connected to an AsGaIn detector.
In order to determine whether the PbS/CdS/ZnS can be used for bio-imaging, we investigated the toxicity and cell viability of the HeLa epithelial cancer cells after treatment with the PbS/CdS/ZnS 1270 nm emitting QDs. For this purpose, we used the MTT assay, a method based on the activity of mitochondrial dehydrogenases, which will be functionally affected by QDs in vitro. As can be observed, the PbS/CdS/ZnS QDs did not show toxicity in HeLa cells with two concentrations used (1:50 and (b) 1:100 of an aqueous solution of those aforementioned QDs with an original concentration of 5 mg/ml). In vitro cell viability/cytotoxicity studies. This study was undertaken using a cervical cancer cell line,
![Figure 1.3 Absorbance of various tissue and blood components from 200 nm to 10 μm. (Obtained from reference [13])](https://thumb-eu.123doks.com/thumbv2/123doknet/5389150.125293/20.918.259.666.183.527/figure-absorbance-various-tissue-blood-components-obtained-reference.webp)