E
E
E
C
C
C
O
O
O
N
N
N
O
O
O
M
M
M
I
I
I
C
C
C
D
D
D
E
E
E
V
V
V
E
E
E
L
L
L
O
O
O
P
P
P
M
M
M
E
E
E
N
N
N
T
T
T
A
A
A
N
N
N
D
D
D
P
P
P
O
O
O
L
L
L
I
I
I
C
C
C
Y
Y
Y
I
I
I
N
N
N
N
N
N
O
O
O
R
R
R
R
R
R
A
A
A
N
N
N
O
O
O
R
R
R
R
R
R
L
L
L
A
A
A
N
N
N
D
D
D
–
–
–
T
T
T
H
H
H
E
E
E
S
S
S
W
W
W
E
E
E
D
D
D
I
I
I
S
S
S
H
H
H
P
P
P
E
E
E
R
R
R
I
I
I
P
P
P
H
H
H
E
E
E
R
R
R
Y
Y
Y
Lars Olof Persson
Nordregio (Nordic Centre for Spatial Development), Stockholm, and Department of Infrastructure, Royal Institute of Technology, Stockholm
This report is largely based on DORA - DYNAMICS OF RURAL AREAS National Report – Sweden (unpublished manuscript June 2001) by Lars Olof Persson
and Vânia A Ceccato
Report prepared for the Peripheral Regions Workshop, Montreal, Canada October 11-13, 2001
TABLE OF CONTENTS
List of figures and tables...i
Sweden’s Periphery in National and European context...1
Introduction...1
Local decision-making...2
Welfare State country...3
The sparsely populated and remote rural areas...5
Selected Study Areas ...6
Cases of two study regions...6
Dynamics of Norra Norrland ...12
Natural resources ...12
Human resources...13
Infrastructure...23
Investments...32
Economic structure and organisation ...39
Institutions ...43
Networks...47
Culture ...51
Outlook for Sweden´s Periphery...55
A Typology of Regions...58
The Importance of Realistic Objectives...58
A Need for Flexibility ...59
Towards a Framework for Policy...62
Measures for economic growth...62
Measures for improved living conditions...63
References ...64
LIST OF FIGURES AND TABLES
Figure 1 - Rural areas according to the national rural development agency...6Figure 2 - The North Sweden region...8
Figure 3 - Total unemployment 1990-1999 (%) ... 17
Figure 4 - Perception of how high school education is adapted to entrepreneurs’ needs according to entrepreneurs (a) and municipal politicians (b) ... 21
Figure 5 - Infrastructure in the municipalities according to entrepreneurs (a) and municipal politicians (b). ... 25
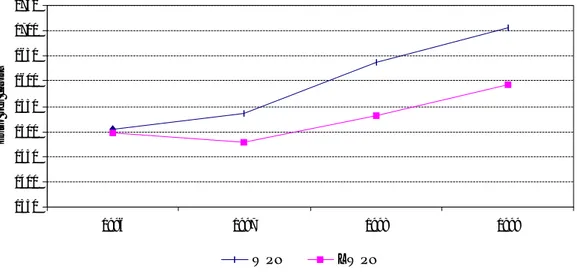
Figure 6 - Spending on EU projects in North Sweden, Euro per capita... 33
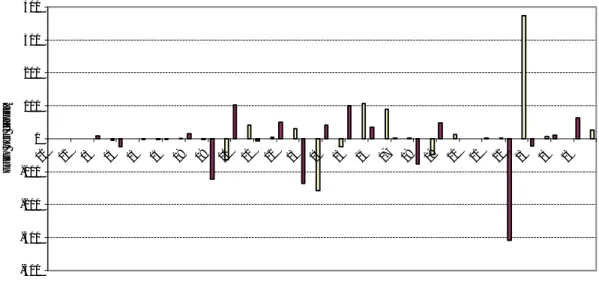
Figure 7 - Differences in national spending 1997-98 in areas of expenditures in North Sweden... 36
Figure 8 - Government grants and intra-municipal equalisation to North Sweden... 37
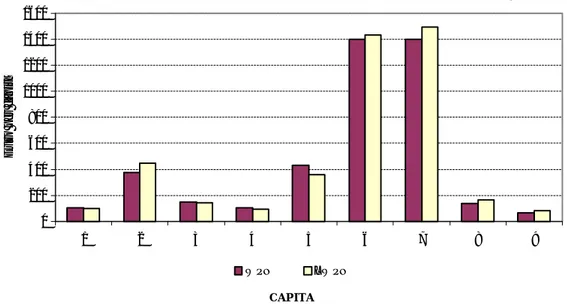
Figure 9 - The net costs for municipal activities in North Sweden in 1999, Euro per capita.... 38
Figure 10 The north Sweden economic structure, WPN and LWPN respectively -Employment 1998... 42
Figure 11 - ‘Networks’ promoted for entrepreneurs in the municipality according to entrepreneurs (a) and municipal politicians (b), 1999... 45
Figure 12 - The perceived municipal rules and bureaucracy according to entrepreneurs (a) and municipal politicians (b), 1999. ... 46
Figure 13 - Density of local organisations, organisations/inhabitants 1997... 48
Figure 14 - Enterprises’ contact with universities in the region according to entrepreneurs (a) and municipal politicians (b), 1999... 50
Figure 15 - General attitude towards entrepreneurship according to entrepreneurs (a) and municipal politicians (b), 1999... 53
Figure 16 - Municipal politicians attitude towards entrepreneurship according to (a) entrepreneurs and municipal politicians (b), 1999 ... 53
Figure 17 - Tentative characteristics of one Well and one Less Well Performing Depopulating Region in sparsely populated regions in Sweden... 61
Figure 18 - Tentative characteristics of one Well and one Less Well Performing area in more densely populated regions in Sweden ... 62
Table 1 - The North Sweden region: population, size and population density ...9
Table 2 - Area of different types of land at agricultural holdings with more than 2 hectares .. 13
Table 3 - Net migration (per cent)... 14
Table 4 - Population change (annual rate) (per cent) ... 14
Table 5 - Population by age classes – WPN and LWPN areas - 2000... 14
Table 6 - Netto migration of youth (18-24) by gender 1995-1999 från/till övriga län... 15
Table 7 - Employment change (annual rate) (per cent)... 15
Table 8 - Population projections for the Local Labour Market Areas (Thousand inhabitants) Alternatives B/D2... 16
Table 9 - Unemployment rate (per cent) 1990/1999... 17
Table 10 - Supply of high schools and temporary university courses by study areas... 19
Table 11 - Students starting university 1999-2000 in 1000 over 18-64 age population... 19
Table 12 - Areas of expenditures of the Swedish national budget and expenditures towards labour market, labour force skills and education in 1998, Euro per capita... 20
Table 13 - Passenger per airport 2000... 24
Table 14 - Good transport per destination 1999... 24
Table 15 - Number of stores by type (1990-1996) and the percentage of change between 1996 and 1999... 27
Table 16 - Selected areas of expenditures of the Swedish national budget and expenditures towards North Sweden in 1998, Euro per capita ... 30
Table 17 - RGA Norrbotten, budget year 2000, Euro per capita... 31
Table 19 - Areas of expenditures of the Swedish national budget and expenditures towards North Sweden in 1998, Euro per capita ... 34 Table 20 - Classification of county council net costs and national average 1999, Euro per
capita... 37 Table 21 - Business Start-ups (Average for 92-96 and 96-98 - enterprises per 1000
inhabitants)... 42 Table 22 - Access to computer and Internet - home and work 1998 (16-64 aged population) ... 51 Table 23 - Percentage of foreign citizens 1995... 54
SWEDEN’S PERIPHERY IN NATIONAL AND EUROPEAN
CONTEXT
Introduction
There are at least three aspects that make Sweden a special country in a European context. The first aspect deals with the country’s traditional local decision-making. Of course, there are regions in Sweden that are traditionally more independent than others. They may be more apt to stimulate local co-operation, to better represent different local interests and be able to face changes and new challenges. Nation-wide, Sweden is characterised by a system of strong political decentralisation in which the municipalities (municipalities are also active in local economic development plan-ning) have major responsibilities (for service supply and power of decision particu-larly in land use planning). This is important in the context of economic performance as it is expected that the closer to the people the decisions are made, the more responsive and effective the system should be.
The second important aspect is Sweden’s status as a welfare State. Despite the clear evidence of diminishment of the State’s role and strong influence on a global market economy during the last decades, Sweden has succeeded in keeping a great part of the welfare system core intact. In fact, these structural changes constitute an on-going challenge to the current planning system that is struggling to maintain a balance between the quality of life standard attained over the last century, and a series of new demands emerging from the globalisation process. The equalisation
system among regions and municipalities is a mechanism that directly aims to decrease imbalances. Traditional mechanisms directed at keeping people’s quality of life are associated with new policies with a strong welfare content which means the gap between the lagging and leading areas in a regional rural context may be relatively small. When differential economic performance between regions is assessed a sensitive method that goes beyond the analysis of ‘hard factors’ is highly relevant (especially in consideration of those that are supplied by common national welfare policy). Thus, two identical indicators of infrastructure standard may tell us very little about how resources are used locally. They may hide huge differences as to how similar infrastructure is used to achieve a better economic performance.
Within a European context, one important characteristic of Nordic countries is the extremely sparsely distributed population. The Northernmost peripheral region has a population density of 3 inhabitants/km2 against 22 inhabitants/km2 of the whole Sweden and an EU average of 116 inhabitants/km2. Sweden is an urbanised rural country. According to the definition of 'rural areas' from The Swedish National Rural Development Agency (Glesbygdsverket), about 65 per cent of Swedish municipalities are somehow rural but they are far from being homogenous. At least two groups can be identified: the first group is composed of 10 per cent of the most sparsely popu-lated municipalities (glesbygdskommuner) located mostly in North Sweden, and the second group constitutes of 55 per cent of the municipalities adjacent to urban areas
(tätortsnära landsbygdskommuner). This extremely low population density has a
clear impact on the potential dynamism of these areas in terms of innovative capac-ity, industrial sector diversification, labour force competence and mobilcapac-ity, and not least of all, infrastructure and communication.
Local decision-making
Sweden has a long tradition of local decision-making on local matters. The system is relatively decentralised. Since the Middle Ages, there was a well-developed system of local self-government both in rural areas and cities (Häggroth et al., 1993). Nowa-days, there are two types of local governments, the municipalities and the county councils. Municipal and county councils services expanded rapidly during the 1960’s and 1970’s and, despite the cutbacks in the 1980-90’s, it is estimated that around one-fourth of the Swedish labour force are employees of municipalities or county councils. In rural regions it is common that about half of the labour market is in public services.
The governing process in Sweden functions on three democratically elected levels: the
Riksdag at a national level, the county councils at a regional level, and the
munici-palities at a local level, each with different spheres of responsibility. Assemblies elected by the people govern both the municipalities and the Country Council. There are 289 municipalities in Sweden. These are responsible for local issues in the immediate environment of the citizens (In addition, there are a number of commit-tees whose duty involves dealing with various matters of business that are subse-quently raised in the council). Each municipality is responsible not only for
implementation of policies related to urban matters but also for those related to the rural areas, which are part of their territory. The municipalities have traditionally been responsible for operating the compulsory comprehensive schools (including adult education and Swedish language for immigrants), municipal social services (child care, care of the elderly and disabled, etc.) technical and emergency services, land use planning, environmental and primary health care, and recreation and culture.
The county councils operate on the regional level, with the health specialised care system as their dominant field of responsibility and also public regional transport. As for regional economic development, the county administrative boards have a direct influence on State planning at the county level. The boards are in charge of the regional development funds, which provide financial and other assistance to regional and local business, rural development and development of projects.
Welfare State country
The welfare state principles still constitute the basis for the government’s action in Sweden. This means, in practice, that there are mechanisms to equalise the differ-ences in the financial situation of various municipalities (and county councils) – the revenue equalisation system being the most important one. At municipal level, the revenue equalisation system is based on differences in the taxation resources of various municipalities, which in its turn is dependent upon the percentage of popula-tion with paid employment (that is, age and economic structure) and on income levels. The lower the taxation resources of a given municipality itself, the larger its grant will be. It is known that the “most expensive” municipalities are those small, sparsely populated ones, and some major cities. At regional level, there is the equali-sation system for structural differences in expenditures in order to create equitable financial conditions in various municipalities, since there are municipal costs that go beyond the control of the individual municipality.
The State grant system, which went into effect in 1993, uses the entire block grant appropriation for equalisation of municipal revenue basis. “A system aimed at equalising structural differences in municipal expenditures has been connected to it. This system is financed entirely by the municipalities themselves in the form of
inter-municipal equalisation payments”. Municipalities with low costs subsidise those with high costs (Häggroth, 1993, p.82). Besides the regional equalisation system, there is a system of regional incentives to stimulate businesses locating and setting up or expanding in designated priority areas in Sweden, primarily in North-western Sweden. In these areas, “the regional incentives are comprised of five grants, a loan scheme and a concession on social security contributions. The grants include a regional development grant for hard investment, regional development grant for soft investment, employment grant, transport grant, and rural development grant.” Unlike most other EU countries, in Sweden some of these subsidies are granted automatically to all companies, which fulfil the requisite eligibility criteria (Aalbu et al., 1999, p.44).
In the last decade, the relations between the State and the local governments have been characterised by a trend toward deregulation. The Local Government Act of 1991 gave the municipalities considerable freedom in structuring their committees, deregulating significant parts of school and social services and opening up participa-tion of the private sector in matters that were strictly public sector business. New forms of solving problems via co-operation/partnership have also resulted owing to changes in the State’s role and the deregulation process (for more information about the impact of the partnerships and experiences see Westholm, 1999)). At regional level, the so-called Regional growth agreement, announced in the policy bill Regional Tillväxt (1997/98:62), which has a central concept the idea of “partnership” (Dahl-gren, 1999) constitute a good example of such a trend. Each County partnership developed its own plans based on their own regional specificity. The idea is that the public sector and private enterprises should jointly fund projects for economic growth in each region.
Part of these structural changes is related to the fact that Sweden (along with Finland and Austria) joined the European Union in January 1995 through a referen-dum campaign with a relatively close result. The number of Member States was increased to 15, when a northward expansion took place.
Sweden has often been considered “a reluctant European”, since Sweden always wanted to take advantages of a common economic market whilst, for political reasons looking suspiciously upon rules that might infringe the country’s neutrality status. The ties between Sweden and European Community became tighter during the
1980’s, when the country joined the Nordic Council and the European Free Trade Association (EFTA). According to Miles (1997), the Swedish relations with the EC underwent relatively dramatic changes during the late 1980’s after which the country went on to become a full member in 1995.
The sparsely populated and remote rural areas
Rural areas in Sweden have several distinct features. The first aspect deals with the concept of rural areas. Rural areas in Sweden include a large extension of the territories, which are heterogeneous in nature. According to The Swedish National Rural Development Agency, they range from areas in adjacent urban centres to areas that are extremely sparsely populated. One of the most important characteristics of the Swedish rural areas is the population distribution – which is extreme sparsely distributed mainly over the northernmost parts of the country, a fact that has traditionally had a strong impact on the establishment of the regional policies. Moreover, rural areas in Sweden, mostly the most remote ones up North, are also synonymous with an ageing population and population reduction, i.e. a population that increasingly moves towards more urbanised regions and larger labour market areas. In terms of general economic performance, any attempt to make generalisa-tions is a difficult task since there are areas that follow the general trend of economic decline, such as the great part of North Sweden inland, while others are competitive even European–wide, such as areas in Småland. Rural areas in Sweden tend to be specialised in traditional sectors, such as agriculture, forestry and manufacturing. Nowadays, several areas are struggling to establish a more modern and competitive economic structure, through investments in human capital and knowledge-based sectors that are adapted to international demands.
FIGURE 1 - RURAL AREAS ACCORDING TO THE NATIONAL RURAL DEVELOPMENT AGENCY
SELECTED STUDY AREAS
Cases of two study regions
In this case study, Storuman, Sorsele and Lycksele compose a group of municipalities in Northern Sweden regarded as dynamic compared with other municipalities in the same region, the so-called WPN – Well Performing Norra Norrland. The Less Well
Performing North Sweden area – LWPN, is composed of three municipalities,
Över-kalix, Pajala and Gällivare located in Norrbotten County1.
This section contrasts the potentialities and constraints experienced by each region. The potentialities of the North Sweden region cannot be limited (Figure 2) to its location and the uniqueness of its environment. The region has a strong potential for tourism (“Europe’s last wild land” – is the current slogan) and has a strategic location
1 It is worth noting that Gällivare and, to a less extent, Lycksele’s performance may be influenced by the size of urban structure. Both municipalities have larger urban centers than the other
municipali-Urban areas Rural areas in adjacency to urban areas Rural areas – sparsely populated areas
compared to other Nordic countries. The landscape of this huge area is widely varied. It extends from the mountains in the west, along the great rivers and through the vast forests and farming areas. Many natural reserves and protected rivers are found in this region, including Kebnekaise, Sweden’s highest mountain. Besides the natural resources, this region has other singularities; for instance, it is a multicul-tural area. It is the only region in Sweden that has boundaries with two other countries (Norway and Finland). North Sweden is part of the so-called Barents Euro Arctic Region (which also includes Finland, Norway and Russia). The region is also characterised by its long tradition of mining (e.g., iron) and forestry, both of which are still important exporting sectors in Sweden. This traditional sectors combined with the exploitation of watercourses (hydropower) are crucial for the regional economy.
Working against these potentialities, there are several constraints such as relative remoteness and size. The region is located in the periphery of Europe and also of the Swedish territory, but is relatively close to the Finland, Norway and Russian. The total area is 165 000 km2, which corresponds to almost 40 per cent of Sweden's area and 5 per cent of the EU's area. The region is the EU's absolute largest NUTS II-region, as large as Austria, the Netherlands and Denmark together. The region is also known by the decreasing sparse and ageing population. Such development in terms of population structure has created regional imbalances in education and, consequently, in the labour market during the last decades, especially between the coastal and inland areas. Mining and forestry industry, often named as “male based industry” does not contribute to decrease an always-segregated labour market, in which women are often limited to activities within the public sector. All these tangible barriers are certainly accentuated by a weak and diffuse regional identity (despite the strong rural communities movement during the 1980-90’s –
lands-bygdsrörelse) and the historical paternalistic attitude towards the State (which
previously was the sole owner of all natural resources in the region) and, more recently, the EU organisations.
Six per cent of Sweden's and 0.1 per cent of the EU total population live in the region. The DORA region’s population density shows 1.2 inhabitants/km2 while the North Sweden region has almost 3 inhabitants/km2 against 22 inhabitants/km2 of Sweden compared to EU’s average of 116 inhabitants/km2 (Table 1). A large part of the population is concentrated in urban areas. In 1999 the inland areas comprised
around approximately 35 per cent of the population while the coastal areas figured at about 65 per cent. Although the total population has increased since the 1970's by about 30,000 inhabitants, the inland part has had a strong reduction in its popula-tion. During 1998-1994, nine municipalities noted a population reduction of 5 per cent; among those who had the highest decrease is Överkalix, one of the LWPN municipalities. Birth rate has significantly decreased during the last few years and followed by a negative net migration it constitutes a large problem for the region. The net migration pattern for the coast areas is more balanced than the inland. The inland areas are characterised by a disproportionate age structure as those who frequently move out are young people between 18-24 years old, with women in the majority, while those who migrate into the area are mostly retired or close to retire-ment age2. In the WPN area, the population reduction has been lesser than the entire North Sweden region but higher than the Swedish average. The LWPN area has experienced a constant and substantial population decline during the last 30 years, about –10 per cent per decade, one of the highest in Sweden.
FIGURE 2 - THE NORTH SWEDEN REGION
Lycksele Storuman Sorsele Överkalix Gällivare Pajala Norra Norrlan d Norrbotten County Västerbotten County
Although a significant improvement of education levels has taken place since the 1980’s, the WPN is still characterised by a smaller share of population having a university degree (16 per cent) than the national average (24 per cent), which is still higher than the LWPN’s figures (14 per cent). In the entire region more women than men have an academic degree, which may partially explain part of the female labour force deficit in several inland municipalities. In terms of educational infrastructure, the relatively high share of college and universities associated with the introduction of new sectors of the economy, such as electronics and telecommunications, and an increasing educational level among the population constitute a promise to further development in the region. Established at Luleå University of Technology in 1994, the Centre for Distance-spanning Technology, CDT, is the only institute of its kind in Sweden. Research, development and programmes of study are conducted in software engineering, data communications and signal processing. CDT’s task is to foster collaboration between IT companies and the University in order to effect the practical application of research results. Another example of technological cluster is the mining town of Kiruna, which has become Sweden’s space research centre, with a concentration of high-tech in companies and organisations such as Satellitbild, Esrange, IRF, the Swedish Institute of Space Physics, and the cartography unit of the National Land Survey.
TABLE 1 - THE NORTH SWEDEN REGION: POPULATION, SIZE AND POPULATION DENSITY WPN LWPN North Sweden
region Sweden
Population (1998) 23844 33132 56976 8 854 322 Size (in km2) 20617.2 26672.9 47290.1 410934.2
Density (inhab/ km2) 1.2 1.2 1.2 22
Between 1994 and 1998, more than 50 per cent of the municipalities had an increase of business start-ups. Many inland municipalities, including those belonging the North Sweden, have experienced a greater establishment of new business than the municipalities along the coast. In the WPN, there were about 10 new enterprises to 1000 inhabitants against 6-8 in municipalities of the LWPN (a partial explanation for this may be the fact that the region belongs to the Objective 6 programme). Even if
more and more women choose to start a business, the share of female entrepreneurs is still relatively low3. The region is highly dependent upon the public sector as source of employment. The proportion of those publicly employed in the region is significantly greater in North Sweden compared with the country at large, 11 per cent greater for women and 8 per cent for men. The regional labour market is known to be very gender segregated. Male labour force is to a great extent employed in the manufacturing industry while about half of the female labour force in North Sweden works with education and health care, which made the labour market for women extremely vulnerable to cut backs during the 1990’s. In the WPN, nine out of ten branches have decreased the total number of employed persons during 1990’s while in the LWPN municipalities, all ten sectors decreased. The largest losses were in agriculture, hunting, forestry and fishing followed by non-specified sector and basic infrastructure (electricity, gas and water, etc.). The unemployment rate in the whole North Sweden has dramatically increased during 1990-1999, from 4 to 10. In the LWPN, the unemployment rate reached almost 15 per cent in 1999, including the unemployed labour force engaged in governmental labour market programs against 9 per cent in the WPN.
The North Sweden region is composed of six municipalities belonging to a larger region known as North Sweden, which has in total 29 municipalities, two Counties, Västerbotten and Norrbotten. The WPN and LWPN municipalities are, as in other municipalities in Sweden, responsible not only for implementation of policies related to urban matters but also for those related to the rural areas, which are part of their territory.
Besides the traditional institutions, the Sami community, who were once a nomadic people, Norrbotten County (which includes the LWPN municipalities) is to be considered as the main centre of the Sami culture, particularly in Jokkmokk and Kiruna. The new Sami Council has convened in Kiruna since October 1993. Besides the Swedish and Sami languages, a third language, Tornedalen Finnish, is spoken in the border region of Finnish Lapland. The region North Sweden is “a melting pot” of Sami, Finnish and Swedish culture, which has roots in the historical development of the territory and continues to affect the self-awareness of the people since the region
seems to continuously search for a clearer identity. Still there is much controversy about the region’s cultural background. There are those who argue that this diversity is responsible for creating a weak or diffuse regional identity that is often associated with the Northern region. Since the central Scandinavian governments have re-pressed cultural diversity for centuries, it has been only in recent decades that ethnical local minorities have been able to use their language, express their political rights and traditions and be recognised as a potential for the region. Besides the natural resorts, the Sami culture is argued to be of importance in terms of the region’s tourist attraction.
It is difficult to judge the magnitude and impact the recent investments will make in North Sweden in terms of economic performance. Certainly in terms of infrastruc-ture, one of the largest investments in the WPN area is being made in the Bothnia Railway4, which will create a link along the coast of Northern Sweden, serving not only high-speed trains but also heavy freight transportation. In the LWPN, compara-ble investments have been jointly made by the County Administration of Norrbotten, the County Council, the region’s trade and industry sector and Luleå University of Technology. The effort is co-ordinated via a development company, IT Norrbotten, with support from the EU structural funds. Four municipalities of DORA study areas (out of six) have airports with daily flights to Stockholm (Storuman, Lycksele, Gällivare and since 1998, Pajala).
The northern parts of Sweden have traditionally been known as dependent on State through different types of regional policies since the 1960’s. However, during the last few years an attitude change seems to be happening among those who live, work and make decisions there. This change is concretely reflected in several types of policy documents as well as in actions taking place in the area. The project “The guide in Norrbotten”, "Vägvisaren" is a good example of this attempt to change peoples' attitude, making the population more active and responsible for their actions in order to have a more prosperous future for the region.
More jobs and increased prosperity through business incentives is the goal of the
Regional Growth Agreement for the WPN. The agreement is also to contribute to
equal opportunities and ecologically sustainable development. The programme has
five working areas: education and skills, as well as research and development; infrastructure, technological development, technology dissemination; environment and market; business development, financing and venture capital; living environ-ment factors: service and culture for growth.
From a European perspective, the North Sweden region is a receptor of structural funds through the Counties of Västerbotten and Norrbotten. For the period 2000– 2006, the total number of objectives decreased to three (1, 2 and 3 Objectives) as well as the number of common initiatives to four: Interreg III, Leader +, Equal and Urban. The program Objective 1 in North Sweden was developed to focus on the following areas: development of infrastructure (including IT), development of business; competence development and employment, development of rural areas, environment and culture and the Sami community.
DYNAMICS OF NORRA NORRLAND
Natural resources
Natural resources have historically played an important role in North Sweden’s economy. The region’s land ownership structure has its roots in forestry and mining activities. The region’s natural resources (ore, timber and hydro-power) have largely formed the basis of Sweden’s wealth and economy during this century and especially forestry is still an important exporting sector in Sweden (Table 2). Nowadays, these resources contribute in different degrees and ways to the region’s economy. North Sweden has also been seen as a tourist receptor defined mostly by its peripheral location and natural landscape (Pettersson, 1999). The reasons behind leisure trips to northern parts of Sweden are in fact related to its variety of natural landscapes or activities related to nature (Turistdelegationen, 1996).
Traditionally the WPN municipalities are characterised by having a nature that promotes tourism, such as skiing and fishing and hiking (during the summer). Infrastructure for tourism already exists and, in certain cases, such as Storuman
(Tärna Mountains5), a well-established industry exists that took the first steps in the beginning of the 19th century. Storuman and Sorsele are typical winter resorts – part of the Swedish ‘mountains regions’ fjällen and part of Europe's largest nature reserve, Vindelfjällen. Although Lycksele is not known as part of the fjäll municipali-ties, the municipality has an increasing tourism infrastructure, attracting people also from abroad that want to experience exotic winter activities, such as snow scooter racing. Festivals with ethnical content (e.g., Sami Weekend Festival in Sorsele) are indications that local resources are perceived more often as assets than in LWPN municipalities.
TABLE 2 - AREA OF DIFFERENT TYPES OF LAND AT AGRICULTURAL HOLDINGS WITH MORE THAN 2 HECTARES
Per cent in parenthesis
Arable land Pasture Forest Other
Västerbotten (including WPN) 78392(3,0) 4992(1,1) 302254(7,6) 80643(10,0) Norrbotten (including LWPN) 42988(1,5) 3652(0,8) 239333(6,0) 85726(11,0) Sweden 2798574 449651 3997400 773998 Source: SCB Jordbruksstatistik, in: Statistical yearbook, 1999.
Human resources
D
EMOGRAPHIC STRUCTURE AND EVOLUTIONThe study area of North Sweden has a population of about 57,000 inhabitants and has had a drastic reduction since the 1970’s. Birth rate has significantly decreased during the last few years and is followed by a negative net migration that constitutes a large problem for the region (Table 3). The net migration pattern for the coast areas is more balanced than the inland. The inland areas are characterised by an age structure since those who often move out are young people between 18-24 years old, predominantly women, while those who move in are mostly retired individuals or those close to retirement age. Only in the 1990’s, the population of North Sweden decreased by 9 per cent, the highest figures are found in the LWPN (Table 4).
5 Arell (1996) presents the evolution of tourism in the Tärna Mountains looking at the actors’ perspec-tives, from a local and to some extent, a relatively close arena, to an arena which is exposed to forces coming from national as international levels.
TABLE 3 - NET MIGRATION (PER CENT)
WPN LWPN North Sweden Sweden
1970-1979 -6.5 -14.0 -11.0 1.5
1980-1989 -4.8 -7.8 -6.5 1.7
1990-1999 -7.0 -8.3 -7.8 2.4
TABLE 4 - POPULATION CHANGE (ANNUAL RATE) (PER CENT)
WPN LWPN North Sweden Sweden
1970-1979 -4.0 -9.3 -7.1 2.7
1980-1989 -4.5 -7.9 -6.5 2.5
1990-1999 -8.2 -9.7 -9.0 3.1
Although depopulation and disproportionate age structure are typical characteristics of the northernmost peripheral rural Europe, the worst scenario is found in munici-palities belonging to the LWPN area (Table 4). People living in these areas are aware of the importance of demographic structure and population evolution to the regional economy, since depopulation has been one of the most important challenges during the last four decades. In certain areas, the imbalance is not limited to age but also gender (Table 5). Pajala, one of the LWPN municipalities, is nationally known for its lack of women, who often migrate temporarily to larger centres looking for education and jobs (Table 6). The poor diversification of the local labour market associated with ‘a traditional male culture’ (see the dialogue below) are factors that contribute ‘to keep away’ the female labour force.
TABLE 5 - POPULATION BY AGE CLASSES – WPN AND LWPN AREAS - 2000 0-15 16-24 25-44 45-64 65-Lycksele 19,9 9,8 23,9 26,3 20,2 WPN Sorsele 18,5 8,7 21,3 25,4 26,0 Storuman 18,0 9,5 22,6 27,2 22,7 Västerbotten 19,7 12,1 26,0 25,0 17,3 Överkalix 16,7 8,1 20,8 28,1 26,3 LWPN Gällivare 18,9 8,6 25,2 28,7 18,6 Pajala 17,5 7,9 19,5 28,8 26,3 Norrbotten 19,1 10,2 25,7 27,1 17,9 Sweden 19,6 10,4 27,4 25,4 17,2
TABLE 6 - NETTO MIGRATION OF YOUTH (18-24) BY GENDER 1995-1999 FRÅN/TILL ÖVRIGA LÄN
1995 1996 1997 1998 1999
Female Male Female Male Female Male Female Male Female Male
Lycksele 25 -35 -23 -42 -19 -53 -40 -29 -46 -53 WPN Sorsele 3 2 -8 -4 -4 1 -17 -8 -9 2 Storuman -2 -8 -17 -23 -5 -9 -20 -24 -14 -26 Västerbotten 357 286 212 160 336 236 273 82 191 8 LWPN Gällivare -42 -54 -49 -55 -48 -68 -57 -50 -49 -79 Pajala -27 -30 -30 -29 -32 -31 -14 -37 -30 -21 Överkalix -17 -8 -8 -12 -21 -21 -1 -9 -15 -17 Norrbotten -302 -319 -117 -415 -190 -436 -247 -430 -283 -511
L
ABOUR FORCE STRUCTURE AND PARTICIPATION RATESThe initial assumption assumed here was that labour force structure and its charac-teristics (age and gender) relate to economic performance. It was also expected that high participation rates of the labour force would tend to influence positively the economic performance of the area. The leading area should have a better perform-ance in activating labour force than the lagging one.
The economically active population (employed and unemployed) has been quite constant during the last part of the 1990’s in Sweden. However, employment change and participation rate have been lower in LWPN than WPN area (Table 7).
TABLE 7 - EMPLOYMENT CHANGE (ANNUAL RATE) (PER CENT)
WPN LWPN North Sweden Sweden
1985-1992 -7.2 -19.2 -14.0 -3.7
1993-1998 -2.1 -9.4 -6.2 4.7
The large population reduction, with low birth rate and out-migration, leads conse-quently to a decrease in the labour force. As Table 8 shows, independent of the
method employed in the projections (Nygren and Persson, 2000)6, a striking popula-tion decrease (more than 50 per cent) in these local labour market areas is expected to occur up to the years 2010 and 2030. The six municipalities of Norra Norland constitute six local labour market areas, of about 60,000 inhabitants in 1999 and can be constituted by not more than 21,000 in the year 2030, if these labour markets continue to decrease in size (alternative B).
TABLE 8 - POPULATION PROJECTIONS FOR THE LOCAL LABOUR MARKET AREAS (THOUSAND INHABITANTS) ALTERNATIVES B/D2
WPN LWPN North Sweden Sweden
1999 27 33 60 8318
2010 23/24 25/27 48/51 9047/9047
2030 12/16 12/15 21/31 9464/9465
It is important to stress that this dramatic population decrease due to demography is the most important factor behind dynamics of these rural areas in North Sweden. This fact per definition is a consequence of bad economic performance in the past. The North Sweden regional labour market is known to be very gender segregated. Male labour force is to a high extent employed in the manufacturing industry while about half of the female labour force in North Sweden works with education and health care, which made the labour market for women very exposed to cut downs during the 1990’s. The share of public employed in the region is significantly greater in North Sweden compared with the country, 11 per cent greater for women and 8 per cent for men. Several State authorities are located in North Sweden, among them, the National Security organ, had also cut downs with serious implication for male employment of the region.
6 The alternative B is based on a more population concentrated trend to the largest Swedish urban areas, based on a prolongation of the observed migration pattern during 1997-99 while and alterna-tive D, represents a more balanced regional trend, based on a prolongation of the observed migration
FIGURE 3 - TOTAL UNEMPLOYMENT 1990-1999 (%)
Left to right: Umeå, WPN region (Lycksele, Sorsele, Storuman) and LWPN (Gällivare, Pajala and Överkalix). Total unemployment (bestående av öppen arbetslöshet samt personer i åtgärder).
TABLE 9 - UNEMPLOYMENT RATE (PER CENT) 1990/1999
WPN LWPN North Sweden
region Sweden
Labour force in governmental
financed programs 4.3/8.8 9.8/14.6 4.4/10.5 3.2/7.3 Unemployed labour force 2.3/5.7 4.9/9.0 1.8/7.1 1.3/5.0
The region’s unemployment rate is one of the highest in the whole country. The LWPN study area had during the 1990’s one of the highest figures (Figure 3 and Table 9). Figure 3 compares the study areas with one of the largest regional munici-palities: Umeå, illustrating the status of DORA study areas in comparison with one of the most dynamic centres of the region. Most striking is not that the LWPN area had the highest unemployment figures of the region, but rather that it concentrated one of the highest figures for long-term unemployment, at least higher than the WPN in 1997.
One important dynamic aspect in terms of labour force structure is how well the labour force is capable of matching the labour market demands over time. As may be expected, the WPN municipalities perform better in activating labour force than the
LWPN areas and than the regional average for North Sweden. This might be related to the fact that the Local Labour Markets (LLM’s) of WPN areas are characterised by (1) relative high business start-ups during the 1990's; (2) reduction of the surplus of unemployed labour force through out-migration; and (3) high efficiency of the mu-nicipalities in placing the unemployed population in governmental financed pro-grams which helps to soften the statistics of unemployment. There is a fourth explanation, i.e., that in places with a biased age structure leading towards an elderly labour force, the high rate of retirement of labour per year tends automati-cally to lead to more vacancies that need to be filled by new recruitment. This seems to be especially true when comparing their performance in activating students within unemployed labour force. The LWPN Local Labour Market not only shows a worse performance compared with the whole region and the national average but also a more heterogeneous (or more unstable and less sufficient) performance pattern than the one for WPN area from 1991 to 1996. However, the LWPN had a similar per-formance to the national perper-formance in terms of employing people with primary education. This relatively good performance could be explained by the predominance of traditional economic branches in the area (mining and quarrying, manufacturing, forestry and transport and communication) and also by the existence of a great share of labour force with low education levels - which means that, in relative terms, part of labour demand matches quite well the labour force supply. Besides, as one of the interviewees pointed out, several programmes are financed by public funds for this “un-placeable” labour force. Regardless of the study areas, interviewees are aware of the fact that there is a chronic overrepresentation of long term unemployed labour force, which will hardly find a job.
H
UMAN CAPITALThe starting point here was that ‘human capital’ invested in the labour force (educa-tion, training, skills) would contribute to its improvement and tend to influence economic performance in the area positively. How do the study areas differ in terms of human capital?
One good indicator of the population’s educational level is the supply of schools and universities. Table 10 shows the supply of post-secondary schools and temporary university courses by study areas. The study areas perform similarly: both study areas have post secondary schools (except Sorsele) and all municipalities import
temporary university courses (exception is Överkalix) in the near future. As Table 11 illustrates the demand for university education in both study areas and by County is slightly lower in the LWPN municipalities.
TABLE 10 - SUPPLY OF HIGH SCHOOLS AND TEMPORARY UNIVERSITY COURSES BY STUDY AREAS High School Temporary university courses
Gällivare Välkommaskolan
Euro Sky University (sky university)
Lapplands kommunalförbund /Umeå Universitet Pajala Laestadiusskolan
Lapplands kommunalförbund /
Luleå tekniska universitet och Umeå Universitet Överkalix Överkalix Gymnasieskola
-Lycksele Tannbergsskolan Umeå Universitet /Lär Centrum/ Akademi Norr Storuman Luspengymnasiet Coming soon - Akademi Norr
Sorsele - Coming soon - Akademi Norr
TABLE 11 - STUDENTS STARTING UNIVERSITY 1999-2000 IN 1000 OVER 18-64 AGE POPULATION Per cent Lycksele 15,3 WPN Storuman 14,9 Sorsele 13,9 Västerbottens County 14,4 Gällivare 9,7 LWPN Pajala 9,4 Överkalix 11,0 Norrbottens County 13,2 Riket 11,5
Source: SCB, Education statistics.
The sources of investments in labour force skills and education are from supra national (EU) to municipal levels, with small variations among the study areas. Figures from 1998 shows that expenditures of the Swedish national budget and expenditures related to labour market and labour force skills in North Sweden study areas are in general higher than the national average. This can be partially
ex-plained by the fact that North Sweden’s unemployment rate in the study areas is higher than in the rest of the country. The same reason may explain the difference in expenditures in labour market and working life between WPN and LWPN. Another interesting area to look at is the one on Education and university research. Here the level of spending is significantly lower than the national average showing that, compared to the national average, few institutions of higher education are located in the North Sweden region (Table 12), (e.g., 2 per cent of the Swedish national budget spent in LWPN area may be explained by a research centre located in Gällivare). A slight difference between the study areas can be found in 1999 for the category ‘education’. The WPN spent more money in education than the LWPN (Table 12), whilst at municipal level, the costs for education seem to be higher in the LWPN than in the WPN. Besides the traditional sources at County Council level, all Swed-ish municipalities are eligible for projects in the RGA (Regional Growth Agreements). By comparing the two RGAs (where the Counties for WPN and LWPN are located) the common focus of the two study areas on development of knowledge and compe-tence is evident. Two equally important areas of investment are found: education and development of competence as well as development of local SMEs – when comparing the two areas, one sees that the amount towards ‘education and competence’ in the leading area (WPN) is two per cent higher in the LWPN.
TABLE 12 - AREAS OF EXPENDITURES OF THE SWEDISH NATIONAL BUDGET AND EXPENDITURES TOWARDS LABOUR MARKET, LABOUR FORCE SKILLS AND EDUCATION IN 1998, EURO PER CAPITA
Area of expenditure WPN LWPN National average*
Labour market and working life 984 (12) 1098 (13) 631 (7) Study support 232 (3) 221 (3) 291 (3) Education and university research 103 (1) 168 (2) 365 (4)
Total 8106 8559 9447
Data source: NUTEK (2000b)
* Data source: Aggefors & Bodevik (2000), p.59.
A region that performs economically well must also have a great part of the labour force matching the local labour market, which requires, among other things, an educational infrastructure adapted to the region’s demands. Figure 4 illustrates differences in perception of entrepreneurs and politicians on how well the high school
education is adapted to the local economy from an independent survey performed by the Swedish Confederation of Swedish Enterprise - SAF, Företagarenkät, SAF/Demoskop (1999). One interesting finding is that neither entrepreneurs nor politicians believe that the high school education is adapted enough to the require-ments of the local market (the only exception are politicians in Storuman and Överkalix). In both study areas, entrepreneurs are less satisfied than politicians. Differences in perception are evident among LWPN and WPN entrepreneurs, who are the ones that directly depend on labour force skills and education (demand side). The lowest averages are found in the LWPN municipalities, which certainly indicates the area’s disadvantages in terms of educational infrastructure, creating a less attractive area not only for entrepreneurs but also for the future of the young local labour force.
(a) (b)
FIGURE 4 - PERCEPTION OF HOW HIGH SCHOOL EDUCATION IS ADAPTED TO ENTREPRENEURS’ NEEDS ACCORDING TO ENTREPRENEURS (A) AND MUNICIPAL POLITICIANS (B)
Source: SAF, Företagarenkät, SAF/Demoskop.
Among the interviewees, the majority recognises the lack of (or deficient) educational infrastructure in their municipalities. When higher education exists, it is often uni-faceted – that is, it is limited to professional courses directed to the immediate needs of the local market. This may be seen as a good indicator if the labour force was absorbed at the same speed as it was supplied.
Excellent Very good G o o d Acceptable Not acceptable B a d Average Umeå Lycksele Sorsele Storuman Gällivare Överkalix WPN LWPN Pajala WPN LWPN
Umeå Lycksele Sorsele
Gällivare
Överkalix
Pajala
Umeå University and Luleå University of Technology are the driving forces behind the industrial, commercial and social development of North Sweden. More than 30,000 students and researchers are involved in advanced studies and spearhead research in technology, medicine and social sciences7. However, no universities are located in the DORA study areas, which directly stimulate daily or weekly commut-ing to these greater regional centres, where the universities are located. There are successful cases in which courses are ministered by distance using IT resources. In other cases, the only solution is out-migration. For these small rural municipalities, the long-term out-migration of young labour force creates a constant demand for labour force with university degrees, such as doctors, teachers, and lawyers, which is often solved by having commuters from neighbouring regions. Besides, as pointed out by the interviewees, in more dynamic rural areas, the constant need for high skilled labour force constitutes a limiting factor for overcoming structural changes in the local economy, for instance, from an economy based on traditional industry to a more knowledge-based one. The opposite could also be said; diversified skilled labour forces tend to function as an attraction factor for new businesses.
Even if there is a constant need for skilled labour force in North Sweden rural municipalities, they seem to be unable to activate this skilled labour force at the same speed as Sweden as a whole. Findings from Ceccato and Persson (2000) show that if one takes Sweden as a whole, the higher the educational level, the easier it is to be activated into the labour market. However, the DORA study areas were not able to follow this trend as fast as other parts of the country did between 1990 and 1996. In general, leading and lagging areas have similar performance in activation rate for labour force with post-secondary education when compared with the national average. Differences can, however, be found for certain categories of labour force when comparing a particular year.
In terms of labour market policy, the majority seems to agree that it is not perfect but it has reached a large parcel of the labour force through short or long-term measures. Regardless of the study area, some controversy exists as whether or not the Swedish labour market policy is equally effective in activating Swedes as it is to
employ non-native labour force. The main argument is that unemployment rate among non-native labour force is constantly higher than among Swedes.
Infrastructure
T
RANSPORT INFRASTRUCTURETransport infrastructure has a special importance when dealing with a peripheral region as North Sweden. This is true since ‘transport infrastructure’ has a cost reducing or output increasing impact on the economic activities and therefore improves the attractiveness and economic performance of a region. In general terms the region is relatively well served of transport infrastructure. Information on transport infrastructure in the WPN and LWPN areas is limited to general guide-lines for each County; therefore, any comparison based on the exact infrastructure supply between the two areas is difficult to make. Only to give an idea, Luleå and Umeå, North Sweden’s largest centres, have Sweden's fourth and sixth biggest airports, respectively. The combined traffic volume of these two airports is 1 400 000 passengers per year8. It is worth noting Lycksele and Storuman (WPN) Gällivare and Pajala (LWPN) have airports with domestic flights (see Table 13 for the volume of passengers per airport). Whilst Luleå is Sweden's leading bulk goods harbour with approximately 7 million tonnes/year, Umeå is the major harbour for the east-west traffic. The main northern railway line carries 4 million tonnes of freight. A sum-mary of goods transportation can be found in Table 14. A new rapid transit line, the Bothnia line, which will carry rail traffic along the coast, is in its planning phase. The roads and highways play a vital role in binding together these enormous coun-ties, which vary greatly in quality of maintenance and types of users. Seven per cent of Sweden’s road network is to be found in Norrbotten, the region with the highest per capita number of automobiles. For passengers, busses are often used for com-muting distances between municipalities while for freight, railways are still very common.
TABLE 13 - PASSENGER PER AIRPORT 2000
Passenger/airport % County % Sweden
Gunnarn/Storuman 17 473 1,7 0,1 Lycksele 26 202 2,5 0,1 Västerbotten County 1 056 537 100 4,3 Gällivare 51 104 4,1 0,2 Pajala 2 145 0,0 0,0 Norrbotten County 1 234 916 100 5,0 Sweden 24 490 635 100 Source: Luftfartsverket, 2000.
TABLE 14 - GOOD TRANSPORT PER DESTINATION 1999 Goods transported Destination (%)
County 1 000 ton Within County Abroad
Västerbotten 18 736 81 19
Norrbotten 12 435 87 13
Sweden 328 900 73 27
Source: SCB, 1998.
One good indicator of how well the transport infrastructure is adapted to the local needs, either for transporting goods or passengers, is the suppliers’ and users’ opinion about the infrastructure. According to the SAF survey (1999), entrepreneurs (users) are in general much more discontent with the transport infrastructure than politicians (suppliers). A striking difference in opinion is found between entrepre-neurs of the WPN and the LWPN. Entrepreentrepre-neurs in Pajala and Överkalix and, to less extent, Gällivare (all LWPN municipalities) judge the infrastructure as unac-ceptable (Figure 5).
Interviewees also pointed out that the lack of maintenance of railways and motor-ways is one of the most limiting factors (for several, it was the most important one) for the region’s economy, not only in terms of freight but also for passengers.
(a) (b)
FIGURE 5 - INFRASTRUCTURE IN THE MUNICIPALITIES ACCORDING TO ENTREPRENEURS (A) AND MUNICIPAL POLITICIANS (B).
Source: SAF, Företagarenkät, SAF/Demoskop.
B
USINESS-
RELATED INFRASTRUCTUREBusiness-related infrastructure is important since it fosters regional growth by cost reducing effects and provides attractive locations for new investments. Business-related infrastructure is composed of essentials used by business (such as industrial parks, technology parks, business districts, R&D infrastructure) or which has a special relevance for the locational decision or cost structure of business (such as energy/water supply, waste treatment, telecommunication).
In terms of technological parks, the regional universities constitute important actors together with local businesses in creating economic dynamism. One example is Umeå University that has made a large investment in information technology in the Umeå Centre for Interaction Technology (UCIT). This is a multi-disciplinary research centre focusing on interaction between humans, information and computers. Re-searchers from various areas cooperate to solve problems of transition from the industrial to the information society. Several municipalities, including the LWPN’s, are actively trying to attract investments in these new areas often concentrated in larger regional centres, where a more complete business-related infrastructure exists. The DORA study areas are very similar in terms of basic urban infrastructure (such as energy/water supply, waste treatment, telecommunication) since it has also been a part of the welfare system. The same could be said about vacant places for
E x c e l l e n t V e r y g o o d G o o d A c c e p t a b l e N o t a c c e p t a b l e B a d Average Umeå Lycksele Sorsele Storuman Gällivare Pajala Överkalix WPN LWPN WPN LWPN Umeå Lycksele Sorsele Storuman Gällivare Pajala Överkalix
industries and businesses; often there is a good supply that is used to attract new business through special arrangements. As pointed out by interviewees, there is a surplus of apartments and, as they declare, places for new businesses seem to be easily arranged by the municipal leaders, when they are not available
C
ONSUMER-
ORIENTED INFRASTRUCTUREA well-developed consumer-oriented infrastructure improves the quality of life in a region, here analysed by supply and accessibility to basic services (stores, post offices, pharmacy and schools). While this can be seen as a form of regional success in its own light, it can also be seen as a location factor. This type of basic infrastructure contributes to the attractiveness of a region for new investments by providing a certain level of life quality for the entrepreneur and employees, as well as inhabi-tants of the region in general.
For those who live in rural areas a good access to services is the fundamental ele-ment in their decision of staying in the countryside. Accessibility to public and private services has also been an important aspect of the Swedish welfare system, which has struggled during the last decades to provide and keep equal living condi-tions over the whole country. What does the accessibility to services in rural areas in Sweden look like? During the 1990’s, basic services were closed down over the whole country; thus, people nowadays travel longer to have access to basic services than ever before. How are the DORA study areas performing? Even though the differences are very small between areas, the WPN is performing slightly better than the LWPN regarding population access to stores, post offices and pharmacy, the exception being schools.
According to The Swedish National Rural Development Agency Yearbook (2000), the access to services in rural areas declined during the last decade. Nine per cent of the shops in rural and urban adjacent rural areas disappeared in the last four years (1995-1999) and 20 per cent between 1980 and 1999. The four northernmost counties, which had the lowest access level, were most affected by this reduction process. This reduction has mostly happened at large in certain types of rural areas and urban adjacent rural areas. In these areas, about 230 stores have disappeared during the last three years. It has mostly been small food shops that have been closed and, in few cases, were transformed to “service stores”, combining other functions, such as
post office and sales. Table 15 shows changes in the number of stores between 1980 and 1999 by type and the percentage of change between 1996 and 1999.
TABLE 15 - NUMBER OF STORES BY TYPE (1990-1996) AND THE PERCENTAGE OF CHANGE BETWEEN 1996 AND 1999
Type 1990 1996 1999 1996-9 (%)
Least 400 km2 selling area 1860 2000 1950 -2
Other type of daily stores 3360 3000 2130 -29 Service-gas station’s stores 2480 2120 2800 32
Others - 70 10 -90
Total 7700 7190 6890 -4
Source: Based on The Swedish National Rural Development Agency Yearbook (2000), p.9.
Norrland’s inland is the region with the highest per cent of the population with the longest travel time to services and where the travel time has increased most of all during the last few years. However, this varies from service to service. In Southeast Sweden, 85 per cent of the population has less than 5 km to a store (43 per cent have less than 1 km). Surprisingly, in North Sweden region, although sparsely populated areas, about 85 per cent have access to stores within 5 km; however more than 6 per cent needs to travel more than 10 km to have access to stores against only 2 per cent in Southeast Sweden. Both in the well performing as well as in the less well per-forming areas, 75 per cent of the individuals have access to stores within 5km, which is lower than the average for the North Sweden region (85 per cent). In both areas, the percentage of individuals that had lesser travel time to stores decreased between 1996 and 1998.
A Post Office service is a special type of service9 since it constitutes a basis for other services in Sweden, especially in small communities. In North Sweden 11 per cent of the population has more than 15 km to a post office against 5 per cent in Southeast Sweden. The LWPN area is slightly better served by post offices than the well performing. Within 5-km distance, 71 per cent of individuals living in the less well performing area had in 1998 access to a post office against 66 per cent in the well performing area.
According to service database from The National Rural Development Agency, the number of pharmacy10 was approximately 1000 and they were located mostly in rural areas. The share of households in 1999 with more than 10 km to the closest phar-macy or pharphar-macy representation was on average 4 per cent in Sweden. The data also shows that the Northern Sweden had the most sensitive structure in terms of accessibility to pharmacy; it means people in Northern parts of Sweden need to travel much longer than others living in Southern Counties if the closest pharmacy were to be closed down. More people are travelling longer nowadays than they have done before but this trend does not seem to affect dramatically the North Sweden study areas in terms of percentage of population having access to this pharmacy. However, the WPN area still has fewer people travelling longer than LWPN (Appendix 2). Regarding schools’ supply, 170 schools, about 10 per cent of the total, in urban adjacent rural areas were closed down while the number of rural schools remained the same between 1995 and 1998. However, the rural schools have fewer students, which means that schools are still at risk of being closed down (The Swedish Na-tional Rural Development Agency Yearbook, 2000). In rural areas, taxis and school busses are fundamental to make shorter the distances to schools in rural areas in Sweden. Pupils in North Sweden have to travel longer to go to school than their
9 The State has signed a contract with Posten AB, which is the main post office enterprise, which lately has worked with other partners, such as chains of local stores ("post i butik"). This contract states that “a good basic cash service ("kassaservice") must be provided to all clients over the whole country” five days a week and the total number of households that do not have daily post service should not increase. In 1999, about 83 per cent of all post offices also provided cash service. This reorganisation resulted in more stores providing mail services; the number of households with great distances to post office has decreased slightly in the country as a whole. However, the regional differences remain and to a certain extent have been strengthened (The Swedish National Rural Development Agency Year-book, 2000, p.13). A reduction has happened in places with at least 3,000 inhabitants (The Swedish National Rural Development Agency Yearbook, 2000, p.10).
friends living in Southeast Sweden. In Norra Norrland, contrary to what was ex-pected, students in the LWPN area had to travel less farther to school than those living in the WPN area. Fifty-five per cent of the pupils in the WPN had access to Högstadiet School within 5 km compared with 67 in the LWPN area. The striking difference is found among those who live in rural areas. In the LWPN, only 16 per cent of students had access to school within 15 km against 34 per cent of those living in WPN. Differences between the two pairs of study areas in North Sweden could be related to municipalities' size (larger, more demand) and relative location (distance from the main regional urban centres).
R
EGIONAL POLICY AND DECISION MAKINGIn Sweden, regional policy and policy directed to rural areas are traditionally strongly interlinked. Regional policy was introduced as ‘localisation policy’ in the mid-60’s aiming to increase economic effectiveness by improving regional balance in the country. This was done by state subsidies, which should stimulate industrial investments in the large sparsely populated areas of North Sweden, which were hit by structural change and depopulation (Närings-och Handelsdepartementet, 1997) Additionally, the idea of equal living conditions all over the country and the right to live and work wherever one wants are connected to this policy (Norberg, 1999, p.85-89). During the following decades the state obtained a strong position in the Swedish setting, allowing redistributing 53 per cent of the income differences in the mid-80’s, which had a positive spatial effect providing an almost equal income in remote rural areas as well as in city regions in the end of the 1980’s (Westholm, 1999).
Within the past years, considerable changes occurred, which had an impact on the role of the Swedish state. An important aspect was Sweden’s decision to enter the EU, which demanded adjustments by the institutional setting, for instance, to fulfil the requirements of EU regional policy (Näringsdepartementet, 2000). Facing these changes, Sweden is undergoing a reform adjusting the social welfare system, which includes a modification of regional redistribution programmes as well as downsizing of the provision for basic services and infrastructure. This cutback in public sector expenditures particularly affects rural areas, as they were the primary beneficiaries of support and compensation transfers given by the Swedish state (Persson, 1997). With the 1998 government bill (Proposition 1997/98:62) a new direction in regional policy was proposed: away from supporting weak regions and equalising regional
differences towards promoting regional growth which makes use of spatial differ-ences.
Hence, endogenous potentials should be activated by means of growth agreements, which define the capital accessible for regional development. This change in policy represents a big step, since regional policy is now concerned with all Swedish regions and not only the weak, i.e. sparsely populated areas and regions with industrial decline, having varying aims and means depending on each region’s needs and capability (Westholm, 1999). This indicates that systems have become even more decentralised and independent of the central government. In theory, it could be expected that the more decentralised and democratic the system is, the better it would fit the specific regional needs. However, since decentralisation has always been a typical characteristic of the Swedish system, it is difficult to assess how large is the impact of the recent events towards a more decentralised regional policy in the DORA study areas. Thus, in the Swedish case, regional policy decentralisation per se cannot be taken as a differing factor among the study areas.
TABLE 16 - SELECTED AREAS OF EXPENDITURES OF THE SWEDISH NATIONAL BUDGET AND EXPENDITURES TOWARDS NORTH SWEDEN IN 1998, EURO PER CAPITA
Area of expenditure WPN (%) LWPN (%) National average* (%) Regional balance and development 304 (4) 323 (4) 33 (0,5) Transport and communications 758 (9) 1072 (12) 374 (4) General grants to local government 2108 (26) 2003 (23) 956 (10)
Total 8106 8559 9447
Data source: NUTEK (2000b).
* Data source: Aggefors and Bodevik (2000), p.59.
Looking at the areas of expenditures of the Swedish national budget towards North Sweden (Table 16), there exist areas of expenditure besides the social welfare in which the region receives more money per capita from the state than the average. Firstly, ‘regional balance and development’: here extreme disparities exist between national average and the amount the northern region receives (4 per cent against 0,5). The main reason is that regional policy of the Swedish state aims to stimulate and support economic attractiveness, particularly in Northwestern Sweden.
Sec-ondly, in area ‘transport and communication’ the high level of expenditures is explained by the fact of very sparsely population density of the area, which, conse-quently, results in higher per capita costs for technical infrastructure. The LWPN receives more, 12 per cent, than the WPN, 9 per cent. Thirdly, the expenditure on ‘general grants’, is also showing evident differences compared to the national aver-age, being more than twice as much (26 per cent in the WPN and 23 per cent in the LWPN).
TABLE 17 - RGA NORRBOTTEN, BUDGET YEAR 2000, EURO PER CAPITA Area of investment Sum %
Knowledge and competence 142 38 Knowledge intensive activities and networks 114 31 Access and good technical infrastructure 49 14 Culture, cultural environment and cultural heritage 58 16 Reindeer business and Sami culture 5 1
Total 369 100
Source: Länsstyrelsen Västerbotten (2000), p.78.
TABLE 18 - RGA VÄSTERBOTTEN, BUDGET YEAR 2000, EURO PER CAPITA Area of investment Sum %
Education and competence 151,94 36 Infrastructure and technical development 36,30 9 International relation and markets 15,84 4
SME development 161,10 39
Quality of Life: Service and culture for growth 41,02 10
Not specified 11,74 3
Total 417,95 100
Source: Länsstyrelsen Norrbotten (2000), p.4-5.
Regional policy spending in different types of regional infrastructure helps to provide preconditions for regional growth. By comparing the two RGA’s in terms of issues for improving economic development, the common focus on development of knowledge and competence as a kind of infrastructure is quite obvious in both areas (Table 17